About the Ronald H. Brown
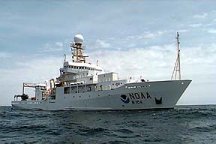
The NOAA ship Ronald H. Brown was commissioned on 19 July, 1997, and is one of the most advanced research vessels for global oceanographic and atmospheric studies. With five laboratories providing nearly 4000 square feet of space and room on deck for nine laboratory vans, the ship can accommodate the largest scientific projects. Its full suite of scientific sensors even includes a Doppler radar, one of the few shipboard systems in the world. The ship's two azimuthing stern thrusters and water jet bow thruster give it outstanding maneuvering and station-keeping abilities. These state-of-the-art features make the Ronald H. Brown an ideal platform for a host of multidisciplinary environmental research projects. For more information on the Ronald H. Brown, follow the link to its home page.
Prior to the NOAA Ship Ronald H. Brown's first research cruise, the Ocean Carbon Cycle Group (OCC) at NOAA's Atlantic Oceanographic and Meteorological Laboratory (AOML) installed an automated instrument to measure the surface pCO2 in the ship's hydro laboratory. The installation was greatly facilitated by the cooperation of the ship's officers and crew, especially the survey and electronic technicians who provide on-going care. While the ship conducts the research that is the focus of a cruise, the pCO2 instrument makes regular measurements of the outside air and of the water flowing through the dedicated scientific sea water system. Three versions of pCO2 analytical system have been installed on the Brown.
The first and second versions were similar in configuration and operation. They included a large showerhead equilibrator whose headspace was sampled eight times an hour, and outside air was sampled three times an hour. Three standards were analyzed every hour to calibrate the infrared analyze, which was operated in the relative mode. A standard gas close to the concentration of outside air was flushed through the reference cell while the other gases flushed the sample cell of the analyzer.
The third version included a smaller sprayhead equilibrator, and the headspace was sampled twenty times an hour. Four standards and five outside airs were analyzed about every 3 hours. The analyzer was operated in absolute mode; the reference cell was flushed with CO2-free air. The second and third versions of instrumental systems were used at the same time during several cruises in 2007 and 2008. The results from the two pCO2 systems were within analytical uncertainties of each other
About this Website
This web site provides access to the fugacity of CO2 (fCO2) data collected on this ship.
Note, fCO2 is the partial pressure pCO2 corrected for non-ideality of the CO2
gas; they are numerically similar (fCO2 ≃ 0.995 pCO2). The processed data are organized by
year and by cruise. For each cruise, the color coded fCO2 values are plotted along the ship's cruise
track on a chart. Next to each chart are links to the comma-delimited data file and the associated Readme
file. To download a data file, select the year from the drop-down list box and click on GO. Choose a chart and
cruise, right-click on the link to its data file or Readme file, and select the download option. Please consult
with and acknowledge the AOML Ocean Carbon Cycle group if data is used for publication or presentation (contacts
in Master Readme, or Denis.Pierrot@noaa.gov).
The Master Readme link in the menu bar on the left provides meta data that is applicable for all data gathered from this ship. The individual Readme files next to the charts provide meta data specific to the associated cruise. The Realtime Display link displays plots of the raw xCO2 data as a function of time and location. These plots are suitable for monitoring but are not suitable for environmental interpretation since the Realtime data has not been processed nor quality controlled.
Data Downloads
All of the data available via these web pages are also available through the Ronald H. Brown Landing Page at NCEI. The NCEI
Landing Page is organized as a table with a row for all of the cruises within a year.
https://www.ncei.noaa.gov/access/ocean-carbon-data-system/oceans/VOS_Program/Brown.html