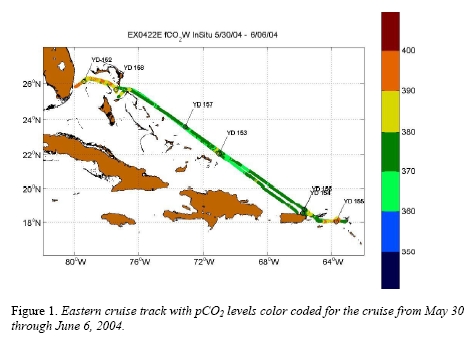
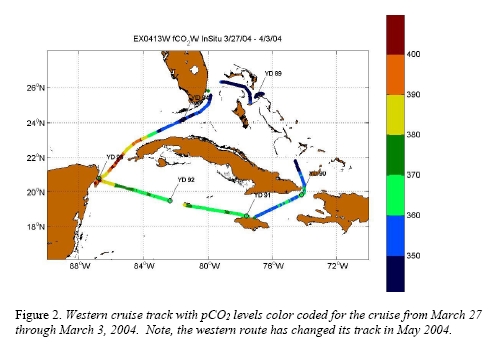
The Explorer of the Seas project is an excellent venue to study the feasibility of creating flux maps using remote sensing because of the high density of in situ measurements and high quality remotely sensed data in the region. The cruise track are repeated on a bi-weekly basis alternating from an eastern track from Miami to St. Maartin (figure 1) and a western track between Miami and Mexico (figure 2). The weekly data is posted at: http://www.aoml.noaa.gov/ocd/gcc/explorer_introduction.php.
Details of production of the flux maps for 2002 can be found in Olsen et al. 2004, [Olsen, A., J. Triñanes, and R. Wanninkhof, Sea-air flux of CO2 in the Caribbean Sea estimated using in situ and remote sensing data, Remote Sensing of Environment , 89 , 309325, 2004.] Olsen and co-workers determined that surface water pCO2sw in this region could be well predicted from a relationship with SST and location of the form:
pCO2sw = 10.18 * SST + 0.5249 * lat - 0.2921 * lon + 52.19
n = 40204; rms = 5.7 uatm; Corr = 0.87
Triñanes fit the 2003 and 2004 data with a similar relationship:
For 2003: pCO2sw = 10.451 * SST + 0.3629 * lat - 0.5144 * lon + 36.5203
n= 60373; rms = 5.9 ; Corr = 0.92
where n is the number of pCO2sw data points used for the fit, rms is the root mean square deviation, and Corr is the correlation coefficient. The two relationships are very similar except that the latter gives pCO2sw values about 4 uatm higher than the former. Over half this change can be attributed to the rise in surface ocean pCO2 levels following the atmospheric increase.
For 2004: pCO2sw = 10.64 * SST + 0.9745 * lat - 0.3687 * lon + 30.68
n = 86695; rms = 7 uatm; Corr = 0.85
These relationships are used to create weekly flux maps for the region from 15 to 30 N and 60 to 90 W (long is negative).
The weekly maps of pCO2 and Flux using remotely sensed QuickSCAT winds are downloadable using the panel at the left hand side of the screen.