[Atlantic Oceanographic and Meteorological Laboratory]


HRD Home
About AOML
About HRD
Programs
Data Sets
 yellow triangle bulletMission Catalog
 yellow triangle bulletSfc. Wind Anal.
 yellow triangle bulletSyn. Surveillance
 yellow triangle bulletRe-Anal. Proj.
 yellow triangle bulletBasin-Wide Data
 yellow triangle bulletData Formats
Weather Info
What's New
Links

OAR logo
OAR


NOAA 
Aircraft Operations Center Logo
NOAA Aircraft Operations Center

Site Map

Staff Data Center Contact  Information

Research Divisions


Hurricane Research 
Division

IFEX daily log

Saturday, July 23, 2005

A follow-on daytime mission was planned with a takeoff time of 14 UTC. The 
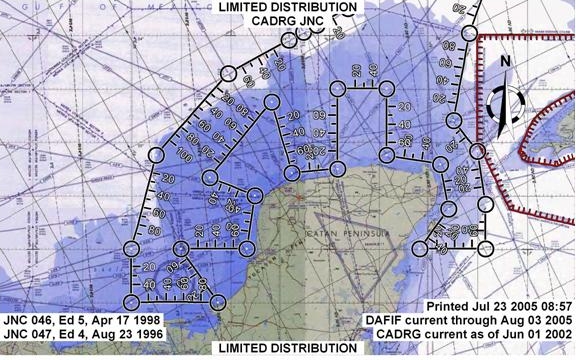
pattern called for a similar type of survey pattern (Fig. 24), though with a greater emphasis on the western boundary of the Yucatan peninsula. Because of some problems with the inertial navigation system on the aircraft, there was a ~2 hour delay in taking off, meaning N42RF did not take off until 1630 UTC. By the time the IP was reached, 
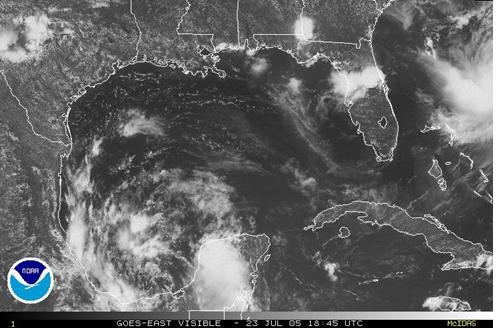
the system was evident from satellite imagery to be centered in the Bay of Campeche as a broad circulation center (Fig. 25). The center of the circulation appeared to be in the central Bay of Campeche. There was a burst of convection in the eastern periphery of the circulation over the Yucatan peninsula, but this did not appear to be the dominant feature in the system. Scattered convection was also evident on the northern and western side of the circulation center.

Because of this new position, the pattern was altered. N42RF did not travel as far down the eastern side of the Yucatan; rather it was extended further to the west along the southern Bay of Campeche in an attempt to capture the circulation seen in the satellite 
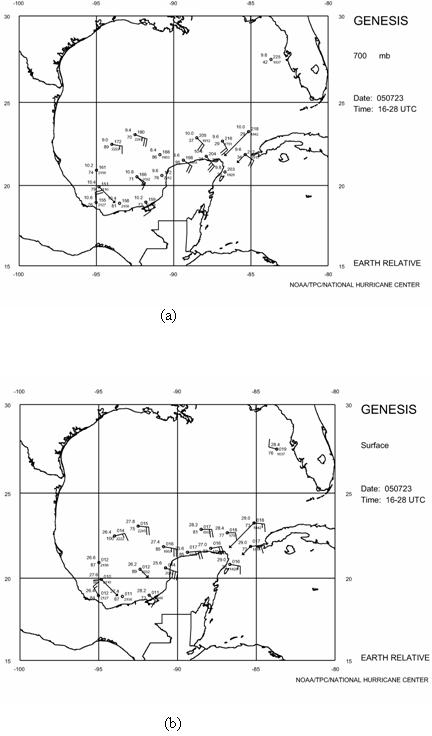
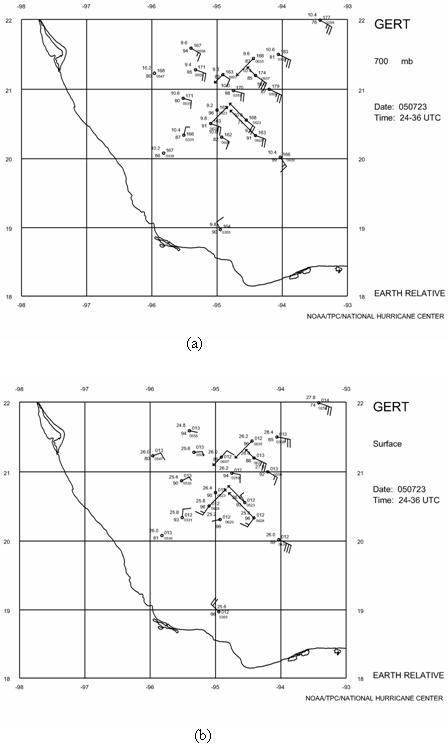
imagery. GPS drop data from this flight (Fig. 26) showed northwesterly winds near the Mexican coast at 95 W, indicative of a center of circulation just north of the coast at around 19 N 93 W. The similarity in location in the 700 mb and surface circulations indicates that the vortex at this time was reasonably vertically coherent, and its location is consistent with that estimated from the visible satellite imagery (cf. Fig. 25). As a result of the data collected on this flight, NHC declared this system a tropical depression, T.D. #7. The upgrade was made during the flight, which marks the first time that a system was declared a depression while a NOAA P-3 was still investigating it. By the end of the flight, deep convection was initiating on the north side of the circulation and consolidating near the center of circulation (Fig. 27). A follow-on P-3 mission occurred with a takeoff time of 00 UTC 24 July. This mission was to be coordinated with the NASA ER-2. During the mission the convection indicated in Fig. 27 concentrated to an area of deep convection in the center of the depression. The flight pattern for the P-3 originally called for figure-4 type pattern, but this was modified somewhat to allow for a targeting of the deep convection with the ER-2. The drops from the mission (Fig. 28) showed the possibility of the development of a new center further north, co-located with the deepest convection.

Rob Rogers
HRD Field Program director


Return to IFEX calendar page

[Horizontal Rule]

[OAR/DOC/NOAA Logos] Atlantic Oceanographic and Meteorological Laboratory Logo [United States Department of Commerce] [Atlantic Oceanographic and Meteorological Laboratory] Atlantic Oceanographic and Meteorological Laboratory Logo [National Oceanic and Atmospheric Administration] [Office of Oceanic and Atmospheric Research] Department of Commerce Logo National Oceanic and Atmospheric Administration Logo Ocean and Atmospheric Research Logo

  Disclaimer | Privacy Policy
  DOC/NOAA/AOML/
HRD

aoml.hrdwebmaster@noaa.gov