Atlantic Oceanographic and Meteorological Laboratory
Miami, Florida
December 1996
Delayed Mode and real-time XBT data collected in the Atlantic Ocean during 1990 and 1991 were scientifically quality controlled at NOAA's Atlantic Oceanographic and Meteorological Laboratory (AOML) and the results of the quality control are presented in detail as tables and figures.
Temperature profiles obtained by Expendable Bathythermographs (XBT's) are collected globally by both research vessels and voluntary observing ships to satisfy requirements of operational agencies as well as research groups. For example, the data are used to initialize experimental climate forecast models. In addition, international research programs such as the World Ocean Circulation Experiment (WOCE) and the Tropical Ocean Global Atmosphere (TOGA) effort use XBT data to increase understanding of clima tically important ocean processes, to validate models, and to monitor the ocean.
The Global Temperature-Salinity Pilot Project (GTSPP) was initiated to develop a protocol for providing the highest quality temperature data to forecasters and researchers. Three Data Assembly Centers (DAC's) were created to quality control (QC) temperat ure profiles from the global XBT network. AOML focused on the Atlantic Ocean; Scripps Institution of Oceanography (SIO), on the Pacific Ocean; and CSIRO, Hobart, Australia, on the Indian Ocean. Initially, the DAC's performed QC on both real-time (i.e., data transmitted from ship-to-shore via satellite) and delayed mode (i.e., data provided by hard copy after completion of a cruise) data. However, the QC of the real-time data gradually was taken over by MEDS, Canada and the DAC's now concentrate on the delayed mode data.
Herein, we describe AOL's QC of XBT data collected in the Atlantic ocean during 1990 and 1991. For various reasons both real-time and delayed mode data are reviewed, in particular, to provide the largest possible data base to future users. The QC proced ures are given in Daneshzadeh et. al., (1994) where additional details on the various QC flags are discussed.
We begin with a description of the available 1990 and 1991 data. This is followed by the results of the QC. Finally, a measure of the representativeness of 1990 and 1991 in terms of a long-term climatology is offered.
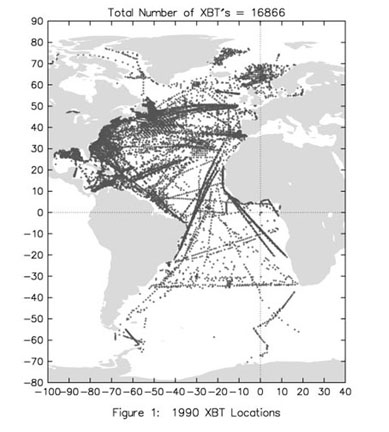
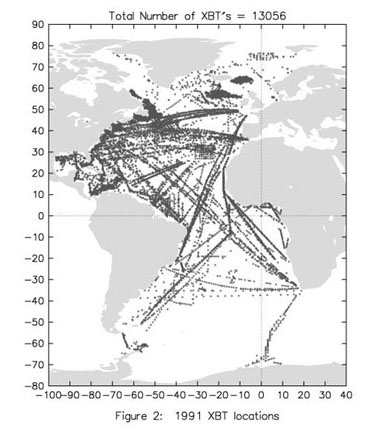
Plots of 1990 and 1991 data distribution are given in Figure 1 and Figure 2. Both real-time and delayed mode data are shown. Data distribution by month is given in Figure 3 for 1990 and Figure 4 for 1991. Ideally, all real-time data, and its low-resolution of the temperature profile, would be replaced by delayed mode data and its higher resolution of the identical profile. However, only a portion of the total replacement occurs. Table 1 lists the relative proportions of delayed mode and real-time data available for 1990 (i.e., the real-time data yet to be replaced by delayed mode data). Table 2 lists the same information for 1991. A Concentrated effort is underway by GTSPP to increase the amount of delayed mode data submitted in a timely fashion. Table 3 provides a partial list of participating ships and the number of XBT's deployed by each.
Table 4 lists the flags applied to the XBT data and their meanings. Flags are applied at each temperature-depth (T-D) pair, thus profiles can include valid as well as bad data. As used at AOML, pairs with flag values of 1 or 2 are considered good and used in analysis, those with values of 3 or 4 are not. In addition to these flags, qualifiers giving the reason for a 3 or 4 flag are listed for each T-D pair. The meaning of these qualifiers are given in Table 5; more details are provided in Daneshzadeh et. al., (1994) and Bailey et, al., (1994).
A summary of 1990 flags is given in Table 6 and flag reasons in Table 7. Similar information for 1991 is given in Tables 8 and 9. In general, about 7% of the 1990 profiles and 11% of the 1991 profiles have data that are considered unusable. The most numerous reason for a 3 or 4 flag is wire stretch which usually occurs at the lower end of the profile, providing some useable data in the upper portion of the cast.
A monthly mean climatology was generated from all available XBT data collected in the Atlantic Ocean between 1966 and 1991. The climatology was constructed from quality controlled data on a 2 degree of latitude by 2 degree of longitude grid. As data are not available at every grid point and some smoothing of the raw data fields is desirable, an interpolation package was used to construct filled fields of temperature at 150m, 400m, and 600m. In addition, monthly standard deviation fields were also constructed.
Temperature anomalies relative to the appropriate long-term monthly mean value were determined at each XBT location through interpolation of surrounding average values. Those anomalies more than or less than two standard deviations from the mean are noted on Appendix 1. The long-term monthly mean temperature distributions are also shown to provide a context for reviewing the anomalies. Related discussion of the anomaly patterns will appear in later reports and publications. The monthly standard deviation fields and quadrangles with data, used in generating the climatology, are given in Appendix 2.
Baily, R., A. Gronel, H. Phillips, G. Meyers, and E. Tanner. 1994. CSIRO Cookbook for quality control of expendable bathythermograph (XBT) data. Rep. No. 220. CSIRO Marine Laboratories, Hobart, Australia. 75 pp.
Daneshzadeh, Y-H. C., J.F. Festa, and S.M. Minton. 1994. Procedures used at NOAA-AOML to quality control real time XBT data collected in the Atlantic Ocean. NOAA Tech. Memo. ERL AOML-78, NOAA Atlantic Oceanographic and Meteorological Laboratory. 44pp.