TSG observations for the latest 3 months (from 02/10/2026 to 05/11/2026)
The figure below show the location of all TSG observations for the latest 3 months, obtained from ships of the NOAA fleet and the SOOP.

                 TSG observations collected trough SEAS during the latest 90 days (Feb 10, 2026 to May 11, 2026).
                 Last update: 05/11/2026 04:20.
TSG observations since 2000
The figure below show the global distribution of TSG observations obtained from ships of the NOAA fleet, SOOP, SeaKeepers and other non-US SOOP and research vessels since 2000.
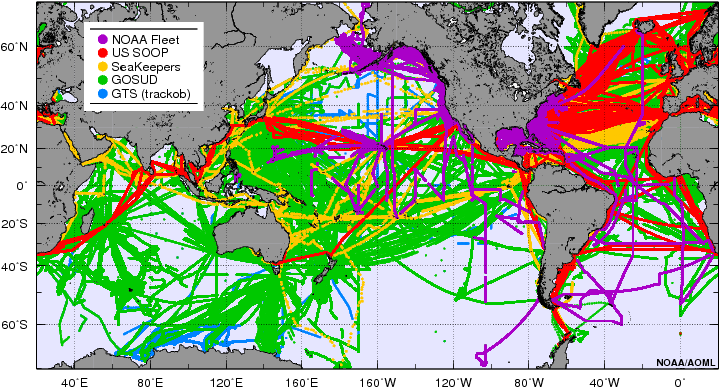
Please refer to this link for data, products and results acknowledgment and distribution.