 About the M/V Skogafoss
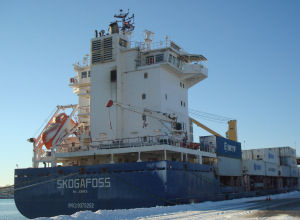
In March 2014, the Ocean Carbon Group (OCC) at NOAA’s Atlantic Oceanographic
and Meteorological Laboratory (AOML) installed an automated system to measure
surface pCO2 on the Volunteer Observing Ship M/V Skogafoss. The M/V
Skogafoss affords AOML's OCC scientists an opportunity to gather data
in the North Atlantic Ocean. In addition, the ship regularly repeats the
same cruise track thus allowing the instruments to monitor small changes
in the ocean and atmosphere. Eventually, a long series of high quality
observations will be available that will provide new insights on weekly,
monthly, seasonal, and longer time cycles.
Every 4 hours, the instrument takes at least 5 air measurements and 100 water
measurements while the ship is underway. Each 4-week cruise track begins and
ends in Portland, Maine. Every day via Iridium satellite communications,
the data is sent to AOML where it is processed, and the final data is posted
to the Skogafoss web site. Files are arranged by year using the cruise
designation skoYYYYMMDD.csv where YYYY is the year, MM the month and DD the
date.
About this Web Site
This web site provides access to this data. The data are organized
by year and by cruise. For each cruise, a graph showing the pCO2
values plotted on the cruise track is shown. Next to each graph are
links to the comma-delimited data file and associated Readme xml file.
To download a particular file, select the year from the drop-down
list box and click on GO. Select a cruise, right-click on the
link to its data file and select the download option. The same
procedure can be applied to download the Readme files. The Realtime
Display link consists of plots of the data as they are received and is
mainly used for troubleshooting. The realtime data has not been quality
controlled and should not be used for scientific purposes. The Realtime
Display plots represent raw (unprocessed) xCO2 data as a function of
time and location. Other links in the menu bar on the left provide
contact information and return access to the AOML GCC homepage.