 |
|
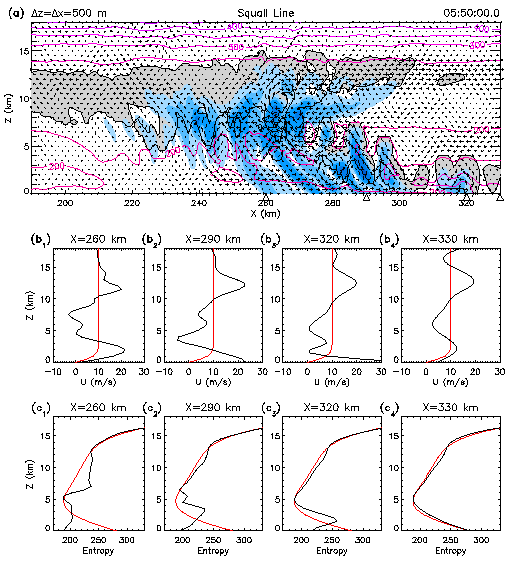
Fig. 4. A snap shot of the well-organized squall line from a 500-m
resolution run. Shown in (a) are the cloud areas (gray), precipitation
(shaded blue) and specific entropy (solid lines, with an emphasis on the
lowest-level contour), and the winds (arrows) relative to the constant
wind aloft. The vertical profiles of u-velocity and entropy are shown in
the rows (b) and (c), respectively, at the four points of x, each marked
by a triangle in (a). For reference, the initial profile of either u or
entropy is also shown by a red line.
Back |