 |
|
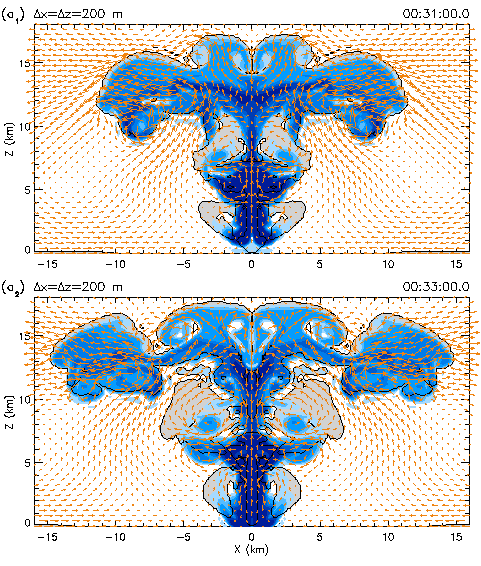
Fig. 2. The turbulent winds (arrows) in and out of a cloud at 31 (top)
and 33 min (bottom) after its initiation as a warm rising bubble in a
200-m resolution run. The cloud areas are shown in gray, and the
precipitation water content in shaded blue.
Back |