 |
|
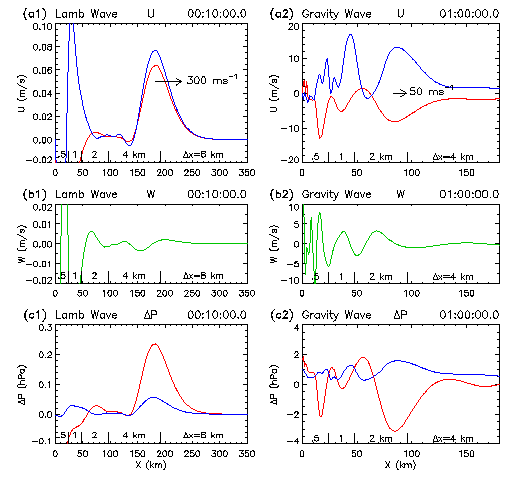
Fig. 1. A fast-propagating Lamb wave in the left column, (a1)-(c1), and
the leading gravity wave in the right column, (a2)-(c2). In either
column, the top panel is for u at z=0 (red) and 15 km (blue); the middle
panel for w at z=9 km (green); and the bottom panel for pressure
deviations at z=0 (red) and 15 km (blue). The long tick marks on the
x-axis indicate the position of domain interfaces, and the resolution of
each domain is noted between the marks.
Back |