Development of a TRMM-based Tropical Cyclone Precipitation
Climatology
Principal Investigator: Frank Marks
Collaborating scientist(s):
Shuyi Chen
(UM/RSMAS)
Chris Kummerow
(NASA/GSFC)
Joanne Simpson
(NASA/GSFC)
Objective:
This proposal is a collaborative effort between NOAA/HRD,
UM/RSMAS, and NASA to analyze the
Tropical Rainfall Measuring Mission (TRMM) Microwave Imager
(TMI) and Precipitation Radar (PR) surface rain estimates in all
tropical cyclones (TC) encountered by the spacecraft to develop
a climatology of TC precipitation fields.
Rationale:
One of the major shortfalls in prediction of TC precipitation
is the lack of climatological distributions of rain in both
space and time. Current forecast techniques rely on a simple
rule of thumb linking the maximum storm total rain to a peak
storm total (1310 mm) divided by the storm's motion (m s-1). While this rule of thumb
provides a reasonable estimate of the peak storm total rain, it
provides no information about the distribution of rain in space
or time, the first step to producing a statistical TC rainfall
model for validating quantitative precipitation forecasts. The
global coverage of the TRMM rain estimates provide an excellent
opportunity to develop a climatology of TC rain distributions
from a large number of storms. In the first 13 months of
operation TRMM sampled 84 TCs with 1050 orbits passing within
750 km of a TC center (16% of 6227 total orbits). This sample
represents over an order of magnitude more data than we can
obtain from any other platform.
Method:
Use the TRMM TMI and PR to estimate the spatial distribution of
surface rain in TCs. The TRMM satellite was launched November
27, 1997 into a near circular orbit of approximately 350 km in
altitude with an inclination of 35° to the equator and a period
of 91.5 minutes (Figure1). The TMI is
a 9 channel, 5 frequency, linearly polarized, passive microwave
radiometric system. The instrument measures atmospheric and
surface brightness temperatures at 10.7, 19.4, 21.3, 37.0, and 85.5
GHz. Each frequency has one vertically and one horizontally
polarized channel, except for the 21.3 GHz frequency, which has
only vertical polarization. TMI has a conical scanning
geometry, rotating continuously about a vertical axis, receiving up
welling radiation from 49° off nadir. Upwelling radiation
is recorded over a 758.5 km swath, covered by 208 ~3.65 km
resolution pixels (Figure 2). TMI
is similar to the Special Sensor Microwave/Imager (SSM/I) instrument
flown on the Defense Meteorological Satellite Program (DMSP)
satellites with the addition of polarized 10 GHz channels,
common scan geometry for every scan, and roughly twice as many
pixels per scan. PR is an active 13.8 GHz radar, recording
energy reflected from atmospheric and surface targets. The PR
electronically scans every 0.6 s with a swath width of 215 km
(Figure 3). Each scan contains 49
rays sampled at ~4.5 km resolution across track. For a given
ray, the samples are recorded at 125 m intervals starting a
fixed distance from the satellite to below the surface. PR
products are referenced to the level of the earth ellipsoid at
250 m resolution.
Once the data is retrieved for the appropriate orbits, the
TMI and/or PR rain estimates will be navigated to a
storm-centered coordinate system, mapping the estimates into 10
km range intervals and quadrants from the storm center. The
rain estimates (R) will be partitioned into 1 dBR (10log10R) intensity classes within each
range interval and quadrant to produce a probability
distribution function (PDF) of R. Characteristics of each PDF
will be tabulated (e.g., mean, standard deviation, median, 90%,
99%, etc.). Stratifications by storm intensity and storm motion
will be attempted to test the simple rule of thumb. We also
plan to compare the TRMM-derived PDFs to those from SSM/I,
WSR-88D, and gage observations. The PDF s of rain will be made
available via the Internet for use by the TRMM PIs.
Accomplishment:
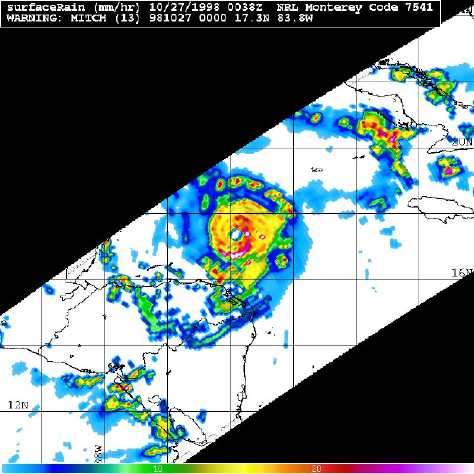
The TMI data was ordered (1050 orbits containing 9 Gbytes of
data on 7 8-mm tapes). Software is being developed to scan the
TMI orbits for each storm and to extract a 10° latitude X
10° longitude window of data around each TC as in
Figure 2. During the scan we will
also extract the total rain distribution from all 1050 orbits
for comparison with the TC distributions. This subset of data
will be stratified to produce the rain distributions by
azimuthal quadrant and range from the storm center.
Key references:
Kummerow, C., W. Barnes, T. Kozu, J. Shiue, and J. Simpson, 1998: The Tropical Rainfall Measuring Mission (TRMM) Sensor Package. J. Atmos. Ocean. Tech., 15, 809–81
Simpson, J., C. Kummerow, W.-K. Tao and R. F. Adler, 1996: On the Tropical Rainfall Measuring Mission (TRMM). Meteor. Atmos. Phys., 60, 19-36.
Project page scientist index
Project page subject index
Main HRD home page
Last modified: 11/3/2000