
About the M/V Skogafoss (V2EF3)
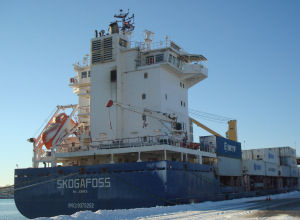
In March 2014, the Ocean Carbon Cycle (OCC) group at NOAA's Atlantic Oceanographic and Meteorological Laboratory (AOML) installed an automated system to measure surface pCO2 on the M/V Skogafoss (V2EF3). The M/V Skogafoss is the third Volunteer Observing Ship from Eimskip's shipping fleet that AOML's OCC scientists have used to gather data in the North Atlantic Ocean. Every month the M/V Skogafoss repeats its cruise track between North America and Iceland with occasional extensions to Norway. Combining data from this ship with data from the previous two ships, M/V Reykjafoss and M/V Skogafoss (V2XM), will provide insights on monthly, seasonal, and longer time scale patterns. The installations were greatly facilitated by the cooperation of the ship's officers and crew, especially the engineers. The data are organized with each 4-week cruise beginning and ending in Portland, Maine. When the ship is underway, the pCO2 instrument takes 5 air and 100 water measurements every 4.5 hours. Data files are sent to AOML via Iridium satellite every day so that the system operation can be monitored. The final data are processed after a cruise is completed and then posted to international databases and to this web site.
About this Website
This web site provides access to the data collected on this ship. The processed data are organized by year and by cruise. For each cruise, the color coded fCO2 values are plotted along the ship's cruise track on a chart. Next to each chart are links to the comma-delimited data file and the associated Readme file. To download a data file, select the year from the drop-down list box and click on GO. Choose a chart and cruise, right-click on the link to its data file or Readme file, and select the download option.
The Master Readme link in the menu bar on the left provides meta data that is applicable for all data gathered from this ship. The individual Readme files next to the charts provide meta data specific to the associated cruise. The Realtime Display link displays plots of the raw xCO2 data as a function of time and location. These plots are suitable for monitoring but are not suitable for environmental interpretation since the Realtime data has not been processed nor quality controlled