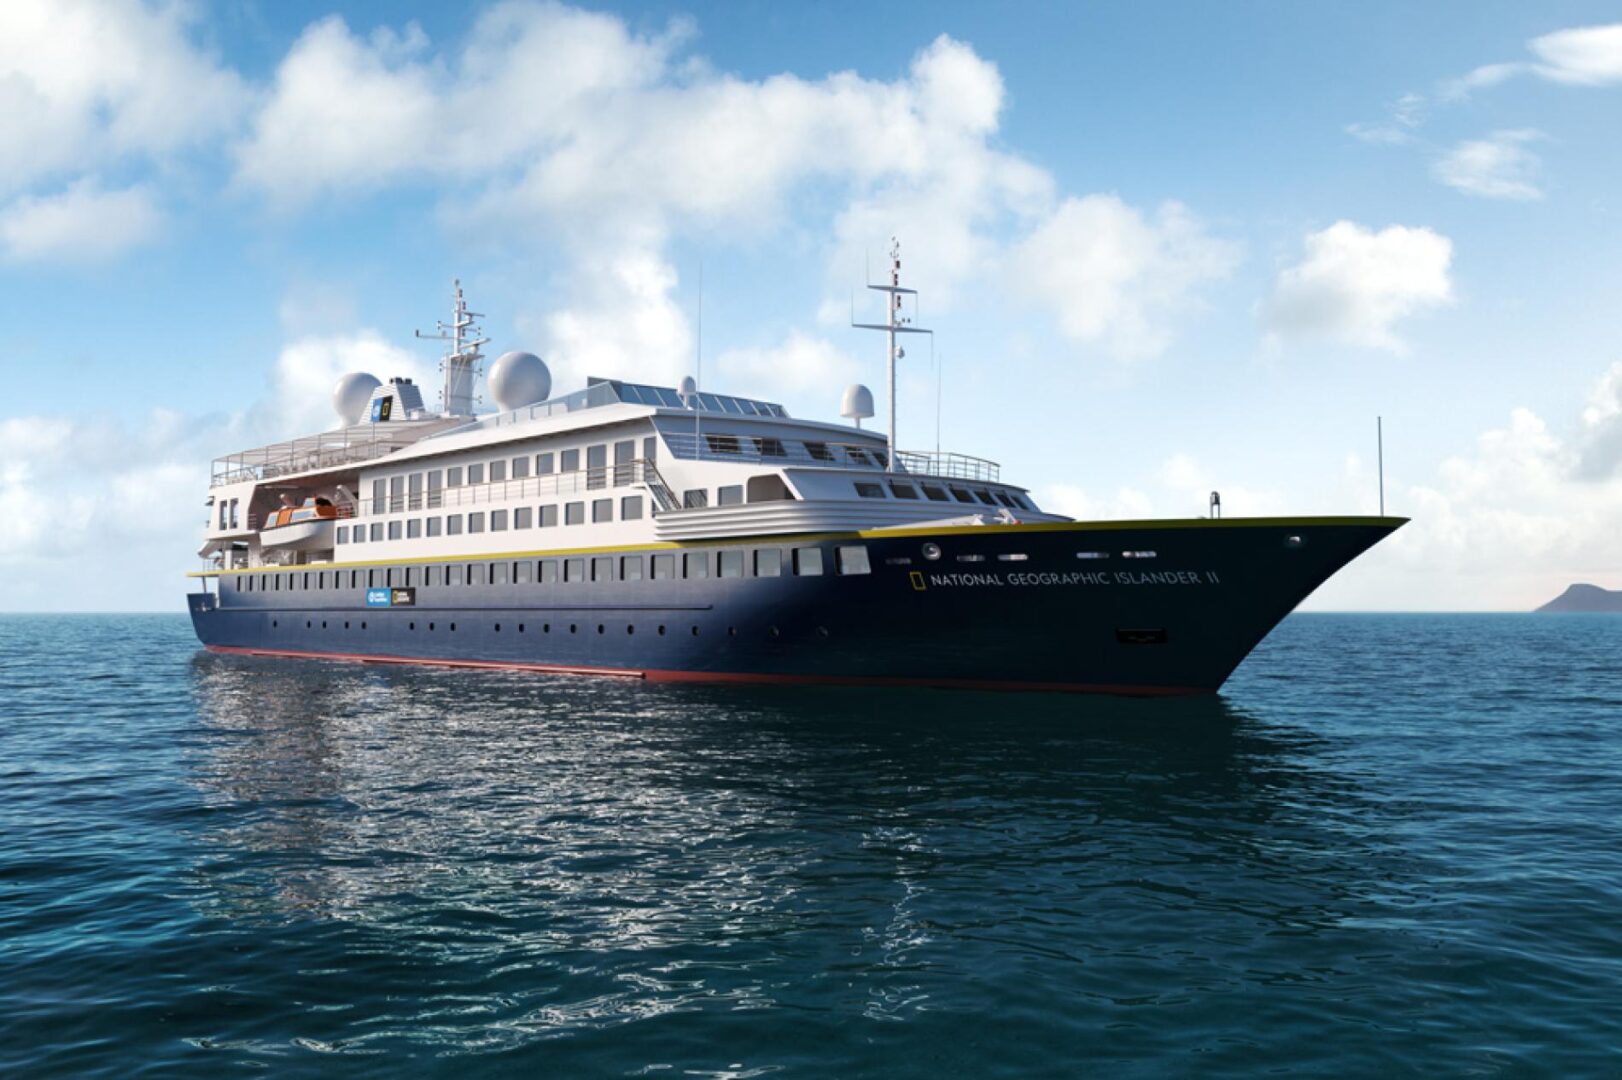
National Geographic Islander II Underway pCO2 Data
SCROLL TO LEARN MORE
Who We Are
| Rik Wanninkhof, Ph.D.
Senior Technical Scientist
| Denis Pierrot, Ph.D.
Oceanographer
About the National Geographic Islander II
The National Geographic Islander II is one of the latest additions to the Lindblad Expeditions fleet of 17 ships. It is a 48-passenger ship which sails in the Galapagos year-round. The vessel features an impressive observation deck and a high-tech science hub, thus bringing the passengers a unique experience where they get to see science being done in real-time in addition to observing the environment
In August of 2023, in collaboration with Dr. Nicolas Cassar of Duke University, our group installed one of our autonomous instruments on this vessel to measure CO2 in the surface water. An air line was also installed to measure the overlaying atmosphere above it. In addition, the system incorporates an Aaderaa Optode which measures dissolved oxygen. The region is extremely biologically active and we expect our data to reflect that. With additional carbonate parameters measurements, it will also give us an indication of the vulnerability of the region to ocean acidification.
About the Website
This web site provides access to the fugacity of CO2 (fCO2) data collected on this ship. Note, fCO2 is the partial pressure pCO2 corrected for non-ideality of the CO2 gas; they are numerically similar (fCO2 ≃ 0.995 pCO2). The processed data are organized by year and by cruise. For each cruise, the color coded fCO2 values are plotted along the ship’s cruise track on a chart. Next to each chart are links to the comma-delimited data file and the associated Readme file. To download a data file, select the year from the drop-down list box and click on GO. Choose a chart and cruise, right-click on the link to its data file or Readme file, and select the download option. Please consult with and acknowledge the AOML Ocean Carbon Cycle group if data is used for publication or presentation (contacts: Rik Wanninkhof@noaa.gov, Denis.Pierrot@noaa.gov).
The Master Readme provides meta data that is applicable for all data gathered from this ship. The individual Readme files next to the charts provide meta data specific to the associated cruise. The Realtime Display link displays plots of the raw xCO2 data as a function of time and location. These plots are suitable for monitoring but are not suitable for environmental interpretation since the Realtime data has not been processed nor quality controlled.


