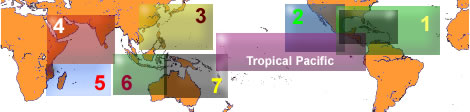
There are seven tropical cyclone "basins" where storms occur on a regular basis:
1. Atlantic basin, including the North Atlantic Ocean, the Gulf of Mexico, and the Caribbean Sea
2. Northeast Pacific basin.from Mexico to about the dateline
3. Northwest Pacific basin.from the dateline to Asia including the South China Sea
4. North Indian basin, including the Bay of Bengal and the Arabian Sea
5. Southwest Indian basin.from Africa to about 100E
6. Southeast Indian/Australian basin (100E to 142E)
7. Australian/Southwest Pacific basin (142E to about 120W)
According to NOAA's National Hurricane Center, approximately 69 percent of the tropical cyclones occur in the Northern Hemisphere, while only 31 percent can be found in the Southern Hemisphere. Approximately 12 percent occur in the Atlantic Ocean, 57 percent occur in the Pacific and the remaining 31 percent occur in the Indian Ocean.
In June 2003 we started providing global near-real time estimates of tropical cyclone heat potential in the seven basins during all year.
Methodology
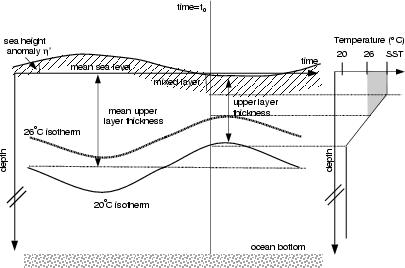
The close relationship that exists between the dynamic height and the mass field of the ocean allows these two parameters to be used within a two-layer reduced gravity ocean model to monitor the upper layer thickness (Goni et al., 1996), which is defined in this study to go from the sea surface to the depth of the 20°C isotherm. This isotherm is chosen because it lies within the center of the main thermocline and is often used as an indicator of the upper layer flow in the western tropical Atlantic and Gulf of Mexico waters. Although there are other factors controlling the sea height anomaly, it is assumed here that most of its variability is due to changes in the depth of the main thermocline and of barotropic origin. The tropical cyclone heat potential, is defined here as a measure of the integrated vertical temperature from the sea surface to the depth of the 26°C isotherm. This parameter is computed from the altimeter-derived vertical temperature profiles estimates in the upper ocean. The temperature profiles are estimated using four points: (a) the sea surface temperature obtained from the Tropical Rainfall Measuring Mission's (TRMM) Microwave Imager (TMI) fields, (b) the altimeter-estimates of the 20°C isotherm within a two-layer reduced gravity scheme (Goni et al, 1996), (c) the depth of the 26°C isotherm from a climatological relationship between the depths of the 20°C and 26°C isotherm.
In this page, we present five daily maps: sea height anomalies, sea surface temperature, altimeter-estimate of the depth of the 26°C and 20°C isotherms and tropical cyclone heat potential.
The sea height anomaly represents the deviation of the sea height with respect to its mean. Sea height anomaly fields from three altimeters, JASON-1, ERS-2 and GFO, are used in this analysis. For analysis and corrections of altimeter data, please refer to: Cheney et al, TOPEX/POSEIDON:
The 2-cm Solution, J. Geophys. Res., 99, 24555-24564, 1994. The tropical cyclone heat potential, is a measure of the integrated vertical temperature between the sea surface temperature and the estimate of the depth of the 26°C isotherm (Shay et al., 2000).
These maps can be used to identify warm anticyclonic features, usually characterized by sea height anomalies and a depth of the 26°C isotherm larger than their surrounding waters; and to monitor regions of very high (usually larger than 90 kJ cm
-2) tropical cyclone heat potential.
These regions have been associated with the sudden intensification of tropical cyclones.
TCHP and tropical cyclone intensification
We show here examples of intensification of three Atlantic
hurricanes and one Pacific typhoon that passed over areas with very high values of TCHP:
Hurricanes Opal, Mitch and Bret, and typhoon Imbudo.
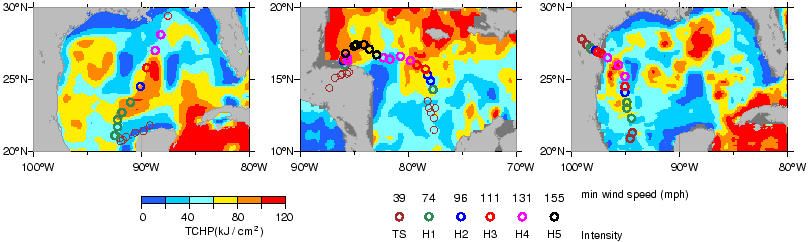
Hurricane Opal in the Gulf of Mexico, August-September 1995 (left):
This TC intensified from hurricane-1 (74-95 mph winds) to hurricane 4
(131-155 mph winds) while traveling over a number of warm features in the
Gulf of Mexico. In particular, this TC suddenly intensified from
hurricane-2 (96-110 mph winds) to hurricane-4 in a period of 10 hours
when its track went over a very well defined ring with a mean radius of
150 km that had been shed by the Loop Current. Altimeter-derived
fields indicate that the increase in TCHP associated with this warm
ring was approximately 30 kJ/cm2. The most striking information of the
ocean conditions during the life span of this hurricane over the Gulf
of Mexico was that this warm ring was not detected using the
AVHRR-derived sea surface temperature fields.
Hurricane Mitch in the Caribbean Sea, October 1998 (center):
This cyclone intensified from hurricane 2 to hurricane 5 (winds
above 155 mph) when its track traveled over a region of warm surface
waters, experiencing an intensification from hurricane 3 (111-130 mph
winds) to 5 with an increase in values of TCHP approximately 80 kJ/cm2
under the track of the TC in 22 hours.
Hurricane Bret in the Gulf of Mexico, August 1999 (right):
This hurricane intensified several times in the SW Gulf of Mexico in
a period of approximately 36 hours while traveling over two warm features
remnants of one warm ring that had been shed by the Loop Current several
months earlier. The increase in TCHP under the track of the TC
during this period was approximately 80 kJ/cm2.
In these cases an association was observed between the increase in TC
intensity and a raise in the value of TCHP under the track of each of
the TCs. Preliminary evaluation of the upper ocean thermal conditions
during the intensification of 32 of the 36 strongest TCs in the
tropical Atlantic from 1993 to 2000 indicates that their intensification
can be associated with the passage of their tracks over regions,
with increased TCHP of at least 20 kJ/cm2.
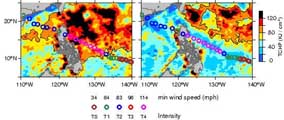
Typhoon Imbudo in the northwestern Pacific Ocean, July 2003 :
The maps below show de ocean conditions in the northwestern Pacific Ocean, east of the Philipines for July 19 and July 23, 2003.
A tropical depression was located at 143E 7.4N on July 16, which became a tropical storm on July 17 at 140.6E 8.5N. On July 18th this tropical storm became a Typhoon-1 (IMBUDO) at 136.2E 10.30N, and suddenly intensified as a typhoon-4 on July 20th with winds over 130 knots, almost reaching the intensity of a super-typhoon (storm data from Unisys Weather).
Near-real time estimates of the upper ocean conditions derived from synthetic temperature profiles obtained from satellite-derived sea height anomalies, sea surface temperatures and climatological fields, revealed that under the storm track, in a region around 131E 12N, and before intensification (July 19th):
1. There are higher sea heigh anomalies, with values of up to 5 cm, due to the warming of the water column below, and associated with a deepening of the depth of the 26°C isotherms of approximately 20m with respect to the surrounding waters.
2. Very high sea surface temperatures, above 29°C.
3. Very high tropical cyclone heat potential, with values above 90 kJ/cm2
The maps from July 23rd show that under the track of this typhoon, a cooling of the sea surface of up to 4°C, due to the mixing of the surface waters, a decrease of tropical cyclone heat potential values of 60 to 100 kJ/cm2, and a rise of the depth of the 26°C isotherm by 25 to 100 m.

 Upper ocean conditions during hurricane Frances & Ivan