Evaulation of the Three-Dimensional Structure of Velocity in the Central and Eastern Equatorial Atlantic
PIs: Renellys Perez, Rick Lumpkin, Claudia Schmid, Greg Foltz, and Chris Meinen
Collaborators: Verena Hormann, William Johns, Peter Brandt, Fabrice Hernandez, Bernard Bourles
Several major field programs have been initiated to monitor the circulation, hydrography, and air-sea fluxes in the central and eastern equatorial Atlantic with moored arrays. Concurrent with these programs, a large number of cross-equatorial cruises have been conducted primarily along 23W and 10W to survey currents with shipboard and lowered acoustic Doppler current profilers. With these data, much has been learned about the mean cross-equatorial structure and seasonal-to-interannual variability of zonal currents in the upper water column, but much less is known about the meridional and vertical currents. The mean cross-equatorial structure of the meridional and vertical currents is governed by shallow overturning circulation cells which are confined to the upper 100 m of the water column, and are characterized by wind-driven equatorial upwelling, poleward wind-driven flow in the surface limb, off-equatorial downwelling at about 3-5 degrees latitude, and equatorward geostrophic flow in the subsurface limb. However, this simple depiction of the flow is complicated by seasonal variations and the presence of strong fronts bounding the equatorial Atlantic cold tongue, which exhibit large undulations due to tropical instability waves (TIWs). In this project, we study the three-dimensional structure of upper-ocean currents and associated heat and salt fluxes in the central and eastern equatorial Atlantic from observations and models. A pilot deployment of fixed depth current meters at the 4N, 23W PIRATA Northeast Extension mooring will provide new insight into how the upper-ocean currents are modified by TIWs.
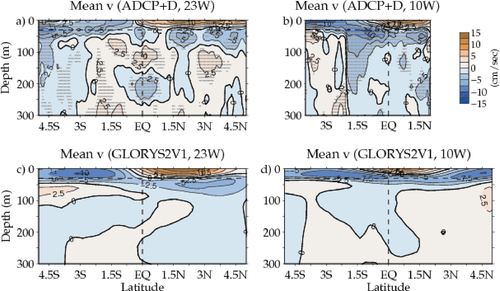
Distribution of long-term mean (a)-(b) observed and (c)-(d) simulated meridional velocity along 23W and 10W. Gray dots in (a)-(b) indicate statistically significant values. Contour interval is 2.5 cm s-1. Figure reproduced from Perez et al. (2013).
Publications
Perez, R. C., R. Lumpkin, W. E. Johns, G. R. Foltz, and V. Hormann, 2012: Interannual variations of Atlantic tropical instability waves. J. Geophys. Res., 117, C03011, doi:10.1029/2011JC007584.
Hormann, V., R. Lumpkin, and R. C. Perez, 2013: A generalized method for estimating the structure of the equatorial Atlantic cold tongue: Application to drifter observations. Journal of Atmos. Oceanic Technol., 30, 1884-1895, doi:10.1175/JTECH-D-12-00173.1.
Perez, R. C., V. Hormann, R. Lumpkin, P. Brandt, W. E. Johns, F. Hernandez, C. Schmid, and B. Bourles, 2013: Mean meridional currents in the central and eastern equatorial Atlantic. Clim. Dyn., doi:10.1007/s00382-013-1968-5.