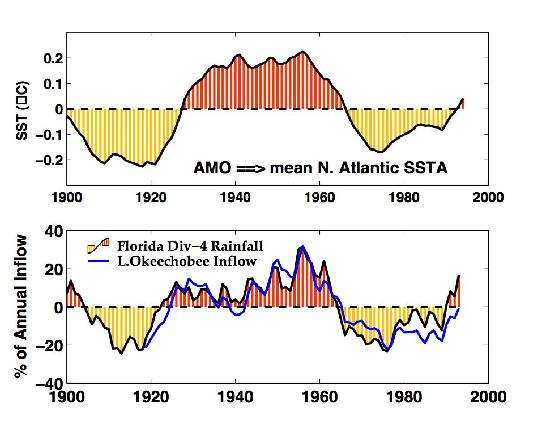
The upper panel shows the AMO index since 1860 (°°C). The lower panel
shows the smoothed anomaly of central Florida rainfall (shaded curve) and
the amount of water flowing into Florida Lake Okeechobee. Both are
expressed as a percentage of their long-term average
|