LOCATION ACCURACY OF GLOBAL LAGRANGIAN DRIFTERS
Mark Bushnell, NOAA/AOML-Global Drifter Center
To determine the accuracy of Argos locations for drifting buoys, test data prior to deployment has been examined. Drifters of the SVP type described by Sybrandy and Niiler (1991) and the SVPB type (Sybrandy et al, 1995) were activated for several days in order to test the transmitters. In many cases, assistance from Argos and Telonics personnel confirmed that the transmitters were satisfactorily operational, and their help is gratefully acknowledged. In fact, all tested transmitters passed the test.
Initially, the tests were conducted by providing the drifter's transmitter with the clearest possible transmission path. They were removed from the shipping containers and shrink wrap, and moved to a clear open field. However, it soon became apparent that the drifters easily transmitted from within the storage warehouse, and by the end of the test drifters were left in the cardboard boxes. A small incision in the shrink wrap allowed removal of the starting magnet while retaining the packaging integrity. Drifters were left inside the warehouse, which has a wooden roof. While far from replicating a drifter deployed in the open ocean, the impediments to these drifter transmissions were offset by several advantages they had over a deployed drifter, such as; a) an entirely dry surface float, never submerging during a satellite pass, b) by holding the drifter motionless, there are no motion induced errors from currents and waves to degrade the determination of the Doppler shift, and c) fresh batteries. To their disadvantage, transmissions from the tested drifters not only experienced impediments from the packing and the warehouse, but the background RF levels in the city of Miami are considerably higher than would be seen in the open ocean. It is a testimony to the sensitivity of the Argos receiver that the test transmissions were received so well.
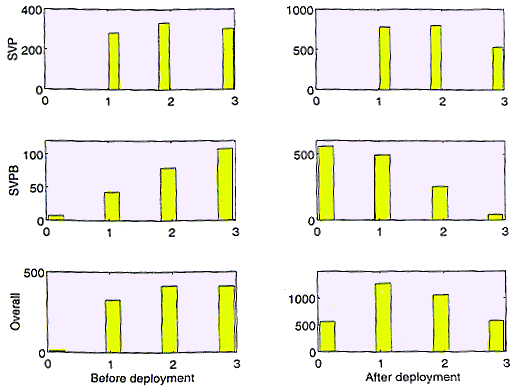
To examine the impact of these advantages and disadvantage, the distribution of location classes was examined during the test and again after deployment. If the drifters experienced hindered transmissions during the test, it should be seen as a shift towards a lower position class. Figure 1. shows histograms of the Argos classes 0, 1, 2, and 3 before deployment (left panel) and after deployment (right panel), for standard drifters (top), drifters fitted with barometers (middle), and the combination of the two (lower). In all cases, positions prior to deployment had higher location classes (more accurate positions) than after deployment. Consequently there is no valid reason to expect higher accuracies after deployment, and the values given below should be interpreted as the best case expectations.

Additional historical tests from the period 1982-1989 were also examined for comparison to these recent results. These tests were conducted using an earlier drifter design described by Bitterman et al (1990) and built at NOAA/AOML, again using Telonics transmitters. Over 14,000 positions from more than 400 drifters were used to compute the standard deviations.
The results are summarized in Table 1. For the recent tests, class 2 and 3 positions show standard deviations slightly higher than the Argos estimates. Class 1 positions have standard deviations slightly lower than the estimated Argos values, and the standard deviations of class 0 positions do in fact exceed 1000 meters. Curiously, the SVPB drifters appear to provide more slightly accurate positions than the SVP drifters prior to deployment, but after deployment the performance of these SVPB drifters is considerably degraded, seen as a large shift towards lower classes after deployment in Figure 1. Combining the classes to compute an overall standard deviation yields about a 500 meter error. Since few investigators can afford to further reduce data holdings by selecting only the highest location classes, this overall value should be used when making generalized statements regarding the accuracy of the drifting buoy positions. When comparing this overall value to the overall standard deviations of the positions from the older drifters, no significant change is noted.
      Argos                    Observed Standard    Argos Estimated
     Location                  Deviation (meters)   Accuracy (meters)
      Class      n               lat        lon
__________________________________________________________________________

        3       411              233        244           150
        2       413              377        400           350
        1       326              755        978          1000
        0         9             1645       6589         >1000
     SVPB       237 (41 PTTs)    275        462            na
      SVP       920 (89 PTTs)    528        616            na
  Overall      1157              500        594            na
  Overall*    14362              367        656            na

*Historical
Bitterman, D. S., P. P. Niiler, Y. Aoustin, and A. du Chaffaut, 1990. Drift Buoy Intercomparison
Test Results. NOAA Data Report ERL AOML-17. Miami, FL, USA.
Sybrandy, A. L. and P. Niiler, 1991. WOCE/TOGA Lagrangian Drifter Construction Manual.
WOCE Report No. 63; SIO Report No. 91/6. Scripps Institution of Oceanography, La Jolla, CA, USA.
Sybrandy, A. L., C. Martin, P. P. Niiler, E. Charpentier, and D. T. Meldrum, 1991. WOCE Surface Velocity Programme Barometer Drifter Construction Manual. World Meteorological Organization, Data Buoy Cooperation Panel, Technical Document No. 4. Geneva, Switzerland.