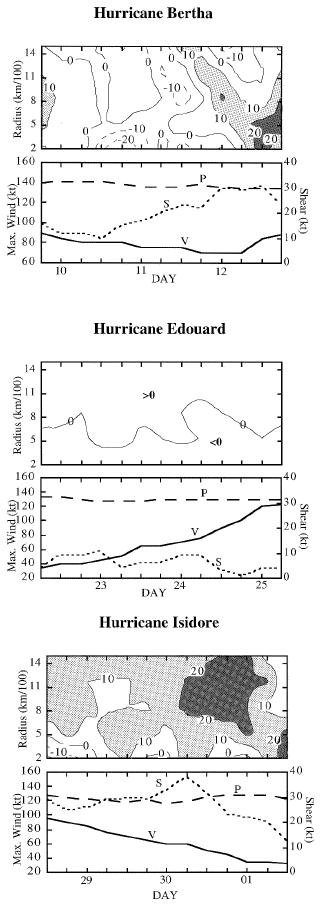
Figure 1.
Temporal changes in the 200 mb REAM fluxes (top panel) and the maximum
potential intensity (P), vertical shear (S), and maximum wind (V)
(bottom panel) for hurricanes Bertha, Edouard, and Isidore. The potential
intensity is an empirical estimate of the maximum wind speed that a
storm could attain based on the underlying SST. The contour interval for
REAM is 10 m/s/day and values exceeding 10 and 20 m/s/day are stippled.