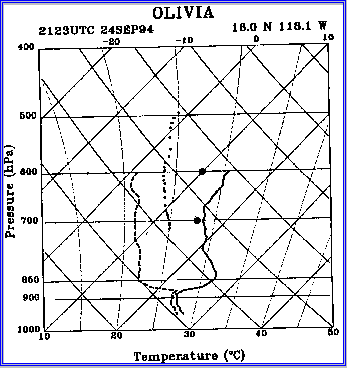
 Fig. 1. Skew T- Log P diagram of the
eye sounding in Eastern Pacific
Hurricane Olivia at 2123 UTC on 24
September 1994. Isotherms slope
upward to the right; dry adiabats slope
upward to the left; moist adiabats are
nearly vertical curving to the left. Solid
and dashed curves denote temperature
and dewpoint respectively. The smaller
dots denote saturation points computed
for the dry air above the inversion, and
the two larger dots temperature
observed at the innermost saturated
point as the aircraft passed through the
eyewall.