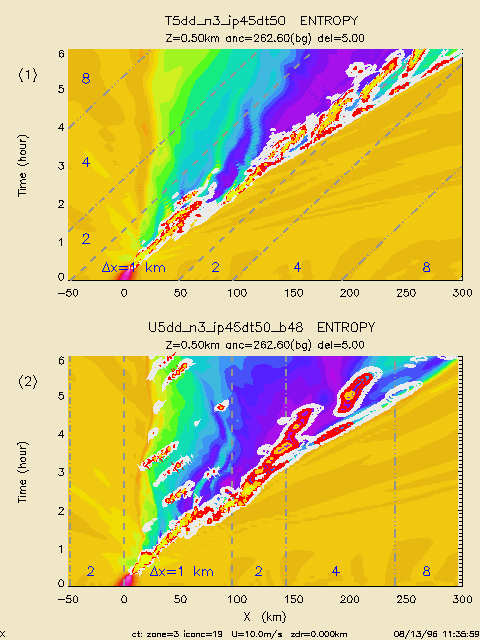
The x-field of the entropy (similar to equivalent potential
temperature) at z=500 m and that of the precipitation rate are traced
with time for 6 hours. The green, blue and purple areas indicate
successively drier (thus, heavier) air from convective downdrafts,
spreading above the ground. The precipitation rates are shown in white
(> 2 mm/hr), red (> 1 cm/hr), orange (> 2 cm/hr), and yellow (> 4
cm/hr). In the experiment shown in (1), the x-coordinate is moved at 10
m/s, and the squall line which propagates at a slightly faster speed
remains mostly in the moving domain of the finest resolution. The
precipitation occurs from the succession of small, but intense
convective cells. In the experiment shown in (2), the x-coordinate is
fixed, and the squall line propagates crossing the interfaces toward the
successive domains of lesser resolution. The cells become broader and
less intense in the 2-km domain, and more so in the 4-km domain.

