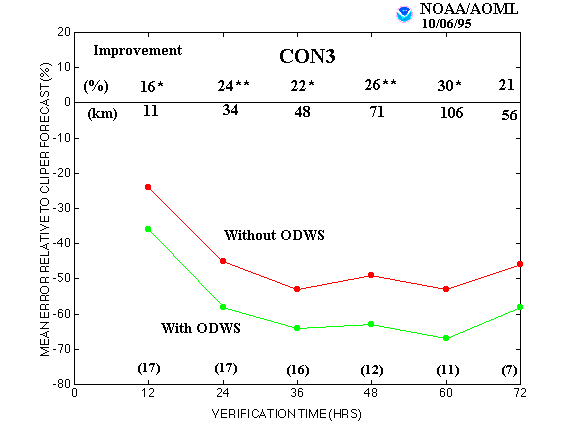
Figure 1.
The average errors of the CON3 forecasts with and without the ODWs,
relative to forecast errors from a climatology and persistence model
(CLIPER). (Smaller relative errors indicate better foreasts.) The numbers
just above the zero line are the percent improvement of the forecast
tracks with ODWs relative to those without. Single and double asterisk
superscripts indicate statistical significance at the 95% and 99% levels,
respectively. Numbers just below the zero skill line are the average
track improvements in kilometers and those in parentheses at the bottom
are the number of cases for each forecast interval.