FIFTH INTERNATIONAL WORKSHOP on tropical cyclones
Topic 0.2e Imminent uses and data assimilation
Title: Tropical Cyclone Forecasts Using high resolution satellite Data and
4D-VAR
Presenter: J. F. Le Marshall
Bureau of Meteorology
Melbourne, Australia, 3000
E-mail: jlm@bom.gov.au
Fax: 61.3.9669.4660
Abstract
The availability of high spatial, temporal and spectral resolution satellite observations and recent advances in numerical weather prediction and data assimilation, combined with burgeoning computer power, are leading to significant improvements in our ability to predict weather phenomena at higher and more appropriate resolutions. Some studies illustrating such improvements are summarised here. High spatial and temporal resolution (hourly and sometimes half hourly) Atmospheric Motion Vectors (AMVs) have been generated from geostationary satellite observations and have been used to initialise a high resolution (15 km) 4-D variational assimilation (4-D Var.) system to improve tropical cyclone (TC) track prediction. The same wind data have also been used at higher resolution (5 km) to estimate TC intensity demonstrates the importance of very high-resolution modeling and data for this activity. It was found that generation and use of high-resolution AMVs in conjunction with continuous data assimilation methods resulted in considerable improvement in TC track prediction and contributed to limited improvement in intensity prediction.
Improvements have been made in TC track prediction, by the use of high spatial and temporal resolution data, high resolution forecast models, and modern continuous data assimilation techniques. Limited improvements in forecasting TC intensity have also been demonstrated. We summarise experiments in which high spatial and temporal resolution satellite-derived wind data, very high resolution numerical modeling (as small as 1 km) and a 4-D Var. assimilation procedure have been used to provide more accurate initial analyses and subsequent forecasts out to 48 hours and beyond, of TC track and intensity.
Thirteen cases regarded as difficult TC forecasts for operations have been reviewed here. For TC track forecasting, high-resolution modeling and continuous data assimilation (of at least 15 km resolution), combined with continuous wind data, led to significant improvements in track prediction. For TC intensity prediction, increasing model resolution to around 5 km was a key and provided a far more realistic depiction of storm intensity and structure, including the development of a clearly defined eye. Use of cloud and water vapour motion vectors, particularly in the upper outflow levels of the storms, contributed to improved intensity forecasts. Finally, continuous data assimilation procedures were necessary for the ingestion of the several thousand asynoptic observations over the 24-hour period leading up to the forecast start time.
|
Wind Type
|
Image res. sub-satellite
|
Frequency
|
Time (UTC)
|
Image triplet (_T)
|
|
IR
|
5 km
|
6 hourly
|
05, 11, 17, 23
|
30 minutes
|
|
Low res. Vis.
|
5 km
|
6 hourly
|
05, 11, 17, 23
|
30 minutes
|
|
High res. Vis.
|
1.25 km
|
6 hourly
|
05, 11, 17, 23
|
30 minutes
|
|
Water vapour
|
5 km
|
6 hourly
|
05, 11, 17, 23
|
30 minutes
|
|
IR NH hrly
|
5 km
|
Hourly
|
23. 00, 01, ……
|
1 hour
|
|
LR Vis. NH hrly
|
5 km
|
Hourly
|
23. 00, 01, ……
|
1 hour
|
|
HR Vis. NH hrly
|
1.25 km
|
Hourly
|
23. 00, 01, ……
|
1 hour
|
|
WV NH hrly
|
5 km
|
Hourly
|
23. 00, 01, ……
|
1 hour
|
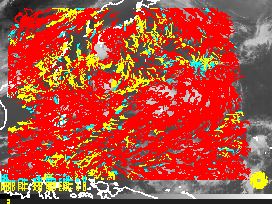
Fig. 1: AMVs around tropical cyclones Feng Shen and Fung Wong in the NW Pacific around 0500 UTC 25 July 2002
|
Type
|
IR1
|
VIS.
|
HR VIS.
|
WV
|
|
|
Low (950 – 700 hPa)
|
No. of obs.
|
3084
|
707
|
2493
|
---
|
|
MMVD (ms-1)
|
3.33
|
3.32
|
3.27
|
---
|
|
|
Middle (699 - 400 hPa)
|
No. of obs.
|
26
|
3
|
7
|
464
|
|
MMVD (ms-1)
|
5.26
|
3.31
|
5.20
|
4.21
|
|
|
Low (399 – 150 hPa)
|
No. of obs.
|
1644
|
3.27
|
879
|
6182
|
|
MMVD (ms-1)
|
5.59
|
5.57
|
5.47
|
5.36
|
Early discussions of variational analysis are found in Thompson (1969), Sasaki (1969), Rodgers (1976), and Talagrand and Courtier (1987). Generally, in Variational Analysis, a model state vector x is derived that minimises a (penalty) functional J,
J(x) = 1/2 (x - xb)TB-1(x - xb) + 1/2 (y - y0)T(C + D)-1 (y - y0), (1)
where xb is a background estimate of x with error covariance B; y is the vector of observed variables with instrumental error covariance C, y0 is the predicted observed values given by
y = H(x), (2)
and D is the error covariance in the "generalised interpolation", H can be the radiative transfer equation to predict satellite radiances, or in 4-D Var. a numerical weather prediction (NWP) model. Typically, the x vector that minimises (1) is found by gradient descent, using calculation of J and _J/_ x to find the minimum of J. The approach here (Le Marshall and Leslie 1996) is based on that of Bennett et al. (1996, 1997). Bennett et al. constructed the generalised inverse of a global numerical weather prediction (NWP) model to prepare initial conditions for the model. Their inverse found a weighted least squares best fit to the dynamics for -24h < t < 0h, the previous initial conditions and to data between t = -24h and t = 0h. That is, the inverse is a weak constraint, four-dimensional variational assimilation scheme. The best fit is found by solving the non-linear Euler-Lagrange equations that determine the local extrema of the penalty function. It uses 6-hourly analyses from t = -24h to T = 0h. Forecast boundary conditions were derived from the Global Assimilation and Prediction System (GASP) in all but five cases. Twenty-four hours of hourly visible and infrared winds were incorporated asynoptically during the 4-D Var. model initialization. The model configuration generally used was 15 km resolution (180 x 180 grid points) and 29 levels. For the intensity studies, the configurations were 25 levels, 25 km resolution (180 x 180 grid points), 15 km resolution (301 x 301 grid points), and 5 km resolution (601 x 601 grid points).
b) Tropical Cyclone Track Prediction
The continuous assimilation methods of Bennett et al. (1996, 1997) have been extended to higher spatial resolution (over a smaller domain) and to allow use of data such as scatterometer winds. Use of this system with an enhanced data base (Le Marshall et al. 1996, Leslie et al. 1998, and Le Marshall and Leslie 1998) has shown that high-resolution (15 km) modeling and use of high spatial and temporal resolution observations with continuous assimilation methods (in particular the 4-D Var. assimilation methods of Bennett et al.) has the ability to significantly improve TC track forecasting. The accuracy of such track forecasts using high-resolution data and continuous assimilation techniques is shown in Table 3 where the forecast errors of thirteen 4-D Var. assimilation forecasts are summarised.
Table 1: Tropical cyclone position errors (km) using 4-D Var. with high resolution visible, IR and water vapour winds at 15 km resolution for each cyclone
|
CYCLONE |
FORECAST START | 12Hrs | 24Hrs | 36Hrs | 48Hrs |
| Beti | 00 UTC 03/26/96 | 167 | 110 | 144 | 57 |
| Olivia | 00 UTC 04/09/96 | 159 | 124 | 62 | 81 |
| Ethel | 00 UTC 03/12/97 | 103 | 136 | 176 | 161 |
| Justin 1 | 00 UTC 03/08/97 | 66 | 85 | 109 | 107 |
| Justin 2 | 00 UTC 03/10/97 | 109 | 148 | 127 | 151 |
| Justin 3 | 12 UTC 03/16/97 | 66 | 167 | 73 | 120 |
| Katrina | 00 UTC 01/03/98 | 68 | 103 | 147 | 189 |
| Olivia | 00 UTC 04/06/96 | 46 | 88 | 135 | 167 |
| Opal 1 | 00 UTC 10/02/95 | 20 | 97 | 168 | 261 |
| Opal 2 | 12 UTC 10/02/95 | 131 | 120 | 135 | 104 |
| Gwenda | 12 UTC 04/05/99 | 46 | 67 | 105 | 131 |
| Saomai | 12 UTC 04/09/00 | 63 | 88 | 112 | 51 |
| Yutu | 00 UTC 24/07/01 | 44 | 100 | 121 | 136 |
| Mean | 83.7 | 110.2 | 124.2 | 132.0 |
This approach to the forecasting problem has allowed the benefits of high-resolution modeling to be realised both in the assimilation and forecast processes. Continuous assimilation with the new high spatial and temporal resolution data source has also incorporated additional data at non-synoptic times and assured an initial state that is in dynamic balance and is consistent with the observations taken during the previous 24 hours. It can be seen that high-resolution satellite wind data, used with 4-D Var. assimilation, have produced 48-hour track forecast errors considerably below those now associated with operational forecasts (Gordon et al. 1998).
Using the methods described above, we have used high-resolution satellite data with very high resolution continuous assimilation and modeling (Le Marshall and Leslie 1999) The wind-field associated with the tropical cyclone has been depicted by several thousand hourly wind observations over a

Fig. 2: Cyclone central pressure for TC Olivia from 12UTC 6 April 1996. CN denotes control, 4D denotes wind data assimilation, resolution (km) is also given.
24-hour period prior to forecast start. These winds describe both the cyclone and the environment into which it moves. They also help define the upper-level divergence associated with these storms. We have used 4-D variational assimilation to ensure that these data are incorporated correctly at non-synoptic times and have assimilated both the data and modeled the cyclone at 5 km resolution to allow an adequate depiction of both cyclone structure and intensity. Five-kilometer resolution appears to be within the range required to resolve adequately the area of maximum wind speed and provide a realistic depiction of storm dynamic and thermodynamic structure.
Results from one of the tropical cyclones studied are shown. Tropical Cyclone Olivia developed explosively off the NW coast of Western Australia during the forecast period. High spatial and temporal resolution cloud and water vapour motion vectors were assimilated for 24 hours between 12 UTC 5 April and 12 UTC 6 April 1996. The resolution of the 4-D Var. assimilation and forecast system was varied from 25 km to 15 km and to 5 km. The variation of storm central pressure with time from 12 UTC 6 April 1996 for the control and 4-D variational forecasts to 72 hours is given in Fig. 2 for each resolution.
The clear benefit of increasing resolution is evident in these results, with the move from 25 km resolution through 15 km to 5 km resolution showing significant improvement in the modeling of intensity. This result is not unexpected given that resolution around 5 km or lower are required to be able to appropriately model both the dynamic and thermodynamic structure of these mesoscale tropical storms. The beneficial impact of the high-resolution wind data during initialization is also evident.
4. Summary and Conclusions
We have examined the use of high spatial, temporal, and spectral resolution data to initialise a 4-D Var. assimilation scheme. In particular, we have shown high-resolution wind data generated from sequential satellite imagery and used with a high-resolution, continuous assimilation scheme have improved tropical cyclone track forecasts. We have also used these high spatial and temporal resolution wind data with a very high-resolution, continuous assimilation scheme to study intensity prediction. Forecasts for a developing TC were presented. In these cases, horizontal resolution was revealed to be a key element in predicting storm intensity. In addition, the accuracy of the modeled intensity was improved through use of high-resolution winds via 4-D Var. assimilation. While these studies are not exhaustive, they point to the importance of including upper tropospheric wind fields in the initialisation, which provide an indication of divergence in the outflow layer of the (incipient) tropical cyclone.
Overall the results have shown that modeling at an appropriately high resolution, with use of high-resolution wind data and initialisation by use of modern continuous assimilation techniques, provides improved TC track and intensity forecasts.
Acknowledgments: Thanks to I. Mouzouri for work in the preparation of this manuscript.
Bibliography
Bennett, A.F., B.S. Chua and L.M. Leslie, 1996: Generalized inversion of a global numerical weather prediction model. Meteor. Atmos. Phys., 60, 165 –178.
Bennett, A.F., B.S. Chua, and L.M. Leslie, 1997 Generalised inversion of a global numerical weather prediction model II Analysis and Implementation. Meteor. Atmos. Phys., 62, 129 – 140.
Gordon, A., W. Gude, R. Schwerdtfeger, R. Byron-Scott, 1998 : Dynamic Meteorology: A Basic Course, Arnold, London, 325 pp.
Le Marshall, J., N. Pescod, R. Seaman, G. Mills, and P. Stewart, 1994: An operational system for generating cloud drift winds in the Australian region and their impact on numerical weather prediction. Weather and Forecasting, 9, 361 – 370.
Le Marshall, J.F., L.M. Leslie, and A, F. Bennett, 1996: Tropical Cyclone Beti - an example of the benefits of assimilating hourly satellite wind data. Aust. Meteor. Mag. 46, 275 - 279.
Le Marshall, J.F., and L.M. Leslie, 1998: Tropical cyclone track prediction - using high resolution satellite data with a new methodology. Aust. Meteor. Mag., 47, 261 – 266.
Le Marshall, J., N. Pescod, R. Seecamp, and C. Spinoso, 1998: Improved weather forecasts from continuous assimilation of high resolution satellite data. Proceedings of the Fourth International Winds Workshop in Saanenmoser, Switzerland, October 20-23
Le Marshall, J. F., and L.M. Leslie, 1999: Modelling tropical cyclone intensity. Aust. Meteor. Mag. 48, 147-152.
Leslie, L.M., J.F. Le Marshall, R.P. Morison, C. Spinoso, R.J. Purser, N. Pescod, and R. Seecamp, 1998: Improved hurricane track forecasting from the continuous assimilation of high-quality satellite wind data. Mon. Wea. Rev., 126, 1248 – 1257.