WMO/CAS/WWW

FIFTH INTERNATIONAL WORKSHOP on TROPICAL CYCLONES


Topic 0.2.b: Imminent uses and data assimilation

Title: Applications of scatterometer data in tropical cyclone research, forecasting, and analysis

Presenter: Roger T. Edson
Anteon Corporation
Water and Environmental Research Institute (WERI)
University of Guam
University of Guam Station
Mangilao, Guam 96924, USA

E-mail: rogeredson@yahoo.com or redson@uog.edu

Fax: 671.734.8890


0.2.b.1 Introduction

Global coverage of scatterometer data over tropical cyclones has been routinely available to the tropical cyclone (TC) forecasters and researchers since 1991. However, it has only been since 1999 that the SeaWinds instrument on board the QuikSCAT satellite has offered near-continuous daily coverage of over 90% of the tropical oceans. This enhanced coverage has presented an opportunity for the various TC forecasting centers and other operational weather agencies to adapt these data into near-real time use. The scatterometer provides both surface wind speed and direction which significantly increases the TC forecaster’s knowledge of TC formation and TC surface wind structure. Current research shows that QuikSCAT wind speeds are found to be extremely accurate, especially for the interpretation of the radius of gale-force winds and positioning requirements. However in many cases, the data are difficult to directly analyze without using various interpretation procedures. In extensive rain regions, light winds are often greatly overestimated. In high winds, the current empirical algorithm generally underestimates the speeds above 30 to 40 m/s and is not tuned to the tight gradients and curvatures that are typical in TCs. The greatest interpretation issues are the correct wind direction selection procedure and the effect of rain on the wind retrieval process. However, research is currently underway that will help resolve some of these issues. This report discusses uses of scatterometer data in TC research and forecasting and analysis and makes recommendations for future uses and requirements. A companion paper will describe in more detail the mechanics of scatterometry and the wind retrieval process as well as some suggested methods for using QuikSCAT data in near-real time TC analysis.

0.2.b.2 Operational uses of Scatterometer Data over Tropical Cyclones

a) TC Analysis (Winds)

QuikSCAT data are currently used to gain knowledge of tropical cyclone genesis, position, movement, outer wind structure, and provide a 'minimum’ (at least) estimate of the maximum sustained winds (Liu and Chan 1999; Chu et al. 2000; Magnan et al. 1999; Atlas et al. 2002) . These ingredients have been used to some degree by all the global TC forecasting and research centers since the data became available in the near-real time in the mid 1990s (Quilfen et al. 1998; Edson 1997). In the past, there have been some difficulties when using the QuikSCAT data directly without a great deal of pre-analysis manipulation, including the use and determination of rain-affected wind vector cells (wvc) and the ambiguity selection process. In addition, the various automated ambiguity selection methods have problems when the TC circulation center can not be resolved due to excessive rain-flagged wvc in the inner core, or when the center is not accurately positioned in the comparison Numerical Weather Prediction (NWP) analysis. Therefore, the degree of use, besides from the timeliness and accessibility of the data, is and has been dependent upon how each forecaster, and forecast agency, has formed an understanding and a confidence for the data (Edson et al. 2002). In the case of QuikSCAT, implementation of the data into the NWP assimilation process only began in January 2002 for the NCEP and ECMWF models (other agencies had previously used the ERS scatterometer data). Implementation of formal procedures for the use of the data in the TC warning process still do not exist and the need continues for validation of the data under conditions of high winds and rain. Also, an automated (or user interface) process to properly pick the correct wind solutions near the center of the TC is desired. Examples of current TC
analysis techniques using scatterometer are shown in Figure 0.2.b.1 a,b.
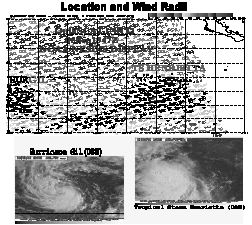

a) b)
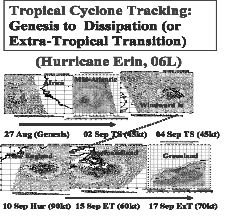
Fig 0.2.b.1: Demonstration of determining location and outer 35 kt wind radii (a) and location and tracking of a TC from genesis to extratropical transition (b).

b) TC Analysis (Normalized Radar Cross-Section, NRCS)

Especially promising are new positioning techniques that take advantage of the variable range processor onboard QuikSCAT that produce an effective 6 km- resolution, gray shade, normalized radar cross-section (NRCS) image (Edson and Chang 2003). These high resolution images show promise not only in pinpointing developing TCs, but also in larger scale analyses as well (Fig 0.2.b.2).
Fig 0.2.b.2: Analysis with the QuikSCAT NRCS. The NRCS shows promise in providing analysis of both the large scale and small scale flow (a), positioning and evidence of eyewall structure (b), and positioning and analysis with QuikSCAT winds and ambiguities for hard-to-find systems (c).

c) Early TC Detection and Genesis

Other research show promise in the ability to identify the incipient disturbance earlier than previously achieved with satellite imagery (Katsaros et al. 2001; Sharp et al. 20002). Although Sharp et al.’s method has been developed as an automated process with mixed results; this author believes that an analyst can manually, with the help of other remote sensing data, more easily determine whether a center exists(Fig.0.2.b.3).


Fig. 0.2.b.3: Early analysis of pre-TD07L. QuikSCAT winds and NRSC image can reinforce an analysis of a suspect area when other imagery and data are inconclusive.

0.2.b.3 Validation of QuikSCAT Data over TCs

a) QuikSCAT Data

Winds are adjusted to simulate a neutral atmosphere at 10 m as compared to 8-10 minute buoy data. Validation studies by Freilich and Dunbar (1993); Wentz and Smith (1999); Jones (2002); and Smith et al. (2000), show that the scatterometer data have met or exceeded the science program requirements (Perry 2000). An example of one such study is shown in Figure 0.2.b.4.


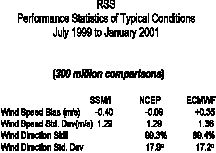
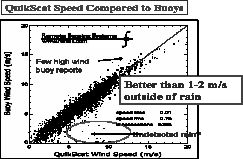
Fig. 0.2.b.4: QuikSCAT verification data from RSS (Smith et al. (2000)).

b) Wind Speed Limitations

There continues to be a debate about the exact range that space-based Ku-band radar can measure wind speeds. Fig 0.2.b.4 and subsequent research, Atlas et al.(2002) and others, clearly show that QuikSCAT winds have met or exceeded the scientific standard for the wind speed range between 3-30 m/s:

+- 2 m/s or 10% (greater of) wind speed uncertainty for 3-30m/s
+- 20 degrees wind direction uncertainty for 3-30 m/s.

Verification of winds in a higher range than this standard have had mixed results because of the difficulty of retrieving a statistically significant sample of buoy or ship data in these regions. In addition, it is difficult to assess how rain extinction typical within the inner core of a TC affects the results. Meteorologically, it is also difficult to determine exactly how extensively any comparison region exceeds 30-50 m/s in the high gradients of the TC with respect to the QuikSCAT 25 km footprint. Some studies are currently looking at redefining the QuikSCAT ‘box’ to more aptly fit the tight gradients and curvatures in the TC (Jones 2002; Long 2000). Studies from aircraft measurements (P. Black, personal communication) using a Ku-band (v-pol) instrument show saturations above 40 m/s. However, Smith et al. (2000) show cases where QuikSCAT winds compared favorably with wind speeds in excess of 50 m/s in extratropical systems. Wentz (personal communication) believes the difference between the Smith et al. results and earlier studies are due to the h-pol sensor onboard QuikSCAT that shows a positive response to winds up to and exceeding 60-70 m/s (but with increasing variance). He also states that the QuikSCAT’s use of a higher frequency and higher incident angle to that of the earlier ERS studies help to obtain these higher measurements. In any case, more verification is required under TC conditions.

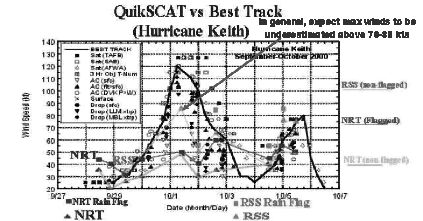
c) Validation of TC structure and intensity with QuikSCAT data

Research by Edson (1997, 2000, and 2002) compares QuikSCAT winds with TC intensity and wind structure. Qualitative agreement such as in the examples in Fig 0.2.b.5 show how well the QuikSCAT wind structure of Hurricane Dennis agrees with the aircraft data; while QuikSCAT maximum wind intensities, although low below 30 m/s, match well with the best track intensities for Hurricane Keith below this value (of course, horizontal gradients may also be the determining factor for resolving the highest winds over a 25 km area).


(a)

(b)
Fig. 0.2.b.5: Comparison of QuikSCAT data with aircraft (a). NHC Best track data show that QuikSCAT can only be expected to provide a minimum (at least) maximum wind within it working range of 3-30 m/s before it begins to underestimate the highest winds. In the example, above, rain-flagged data are also included with the comparisons.


d) Positioning Accuracy

One goal of TC positioning is for the accuracy to be at least as precise as that achieved by the standard techniques utilizing visual and infrared imagery. An example of the feasibility of providing these kinds of accuracies as established in First Weather Wing Pamphlet (1WWP) 105-10 (Table 0.2.b.1) and is shown in Fig. 0.2.b.6 for the 2001 Atlantic hurricane season(positions were only verified if they were within 1 hour of an aircraft mission).

Table 0.2.b.1 PCN Requirements

PCN

CLASS

Mean Dev (nm)

SVD (nm) (63%)

1.52 SVD (nm) (90%)

1-2

Eye

15

16.5

25

3-4

Well-defined

20

26

40

5-6

Poorly-defined

30

36

55

Table 0.2.b.1: Requirements for TC Position Code Number (PCN) Accuracy. The Standard Vector Deviation (SVD) describes a radius about a specific point that contains 63% of the verifying points. The PCN radius is described as a radius that contains 90% of all verifying points. (Adapted from 1 WWP 105-10, Arnold et al. 1974)


Fig. 0.2.b.6: Position accuracy for QuikSCAT data for the Atlantic 2001 season. Accuracy for this study met the requirements for PCN 3 (well-defined circulation).


e) Rain Extinction

Rain extinction due to scattering and absorption affect both the up- and down-signal from the QuikSCAT satellite. In addition, rain on the surface of the ocean can interfere with the backscatter signal (_o), especially when the winds are light. Typically, the winds appear significantly stronger than their actual value. Recent work by Stiles and Yeuh (2001) and Weissman et al. (2002) shows that the over estimation decreases as the wind speed (signal) gets stronger (Fig. 0.2.b.7). This is especially true with the vertically-polarized sensor that is less susceptible to rain. In fact, it is more likely that the wind speeds above 15 m/s are underestimated in heavy rain (due to extinction of the signal).
Fig. 0.2.b.7: Impact of rain upon _o
versus wind (Stiles and Yeuh, 2001)
0.2.b.4 Future Uses and Requirements

a) Potential Uses in Operations and Research

Table 0.2.b.2 provides a summary of suggestions for the present and future uses of scatterometer data in both operations and research. It is also hoped that these data will be integrated into the operationally analysis and best-tracking process with other forms of information such as the microwave imagery. In this manner, these data can reinforce each other and establish a new standard for fix accuracy and early TC detection with remote sensing tools.

Table 0.2.b.2 Research Topics with Scatterometer Data


1) Genesis: Initial position and character of TC disturbance can be more
accurately ascertained in both time and space.
a) Better understanding of origin and mechanisms for formation
b) Character of incipient disturbance can be determined (i.e., wave, trough axis, pre-existing surface circulation)
c) Interaction with the environment such surges and surge location
2) Development and the early-stage intensification process: Outer wind
structure, position, and a ‘minimum’ (at least) estimate for maximum
intensity.
a) Used with other data (such as microwave imagery or vertical profilers) will allow better understanding of mass and wind fields
b) Relationship of wind field with the convection
c) Change in wind structure during life cycle and early-stage
intensification process (also in relationship to other synoptic
scale features)
3) Motion: Scatterometer wind and directions over TC (in combination with
other remote sensing tools) give more accurate positions over data-
sparse regions of the globe.
a) Can obtain complete best track of each TC for a TC data base and provide more thorough motion history, especially good during early stages where positioning and intensity accuracy is currently poor.
b) Short-term motion as related to surrounding environmental wind flow
c) Motion as related to asymmetric wind structure
d) Multi-TC interaction, especially as TCs begin to approach each other
d) Interaction with topography and multi-TC interaction

4) Extratropical transition: Movement of the surface feature and outer wind
structure
a) Examine change in outer wind structure as transition develops
b) Stratify with respect to different size and intensity TCs and their interaction with different extratropical features
c) Understand the dissipation process and understand the differences in situations for when the wind field weakens or strengthens


b) Requirements for Improvements in Scatterometer Wind Retrieval Process for TC Analysis

Requirements to upgrade the current wind retrieval algorithms and ambiguity selection process still exist. This is especially true in the areas where it is necessary to be as precise as possible: TC analysis. In many cases the TC operational and research community can help by providing feedback, scatterometer fix data using some of the methodology shown here, and by providing aircraft and buoy measurements to compare in the high wind/heavy rain regions where there is so little comparative data. Requirements for the scatterometer community include:

- More precise ambiguity selection process in high gradient curvature of the TC(e.g., Jones 2002; Long 2002)
- Better identification and specification of rain-related effects, including use of the AMSR instrument onboard ADEOS-II (e.g., Wentz 2002; Stiles and Yueh 2002)
- Improved automated ambiguity selection process or development of a forecaster-interface procedure
- Validation and understanding of high wind speed and heavy rain characteristics using aircraft and dropwindsonde data
- Establishment of uniform operational procedures in TC warning process
(validation in cooperation with TC centers). A goal should be set to
meet the requirements for a well-defined center (PCN 3/4) as defined
in Table 0.2.2 (Edson et al. 2002)

c) Scatterometer Instruments and a Possible Two-Instrument Suite

The QuikSCAT mission has successfully completed its intended 36 month mission. However, the program managers have agreed to maintain operations until (at least) the next scheduled scatterometer (SeaWinds)is launched and ready for use (ADEOS-II is scheduled for December 2002 with public availability approximately 10 months later). The future SeaWinds instrument will have identical characteristics as the current instrument and is a joint mission between NASA and the National Space Development Agency of Japan (NASDA). The ADEOS-II mission also will carry the Advanced Microwave Scanning
Radiometer(AMSR) that should eventually aid in determining the effect of rain on the scatterometer measurements. The ESA is also planning another scatterometer launch. However, their new Advanced Scatterometer (A-SCAT) C-Band instrument is not scheduled for launch until 2005.

Although originally not envisioned as a key player for TC support, the QuikSCAT scatterometer has quickly gained recognition in this endeavor (T. Liu, JPL, personal communication). It is thus recommended that this workshop present an endorsement to the JPL program office for a TC requirement for either maintaining a two-instrument constellation or to ensure for the future planning of scatterometer missions. See suggested endorsement in Appendix 0.2.b.A.

0.2.b.5: Summary

This report has shown that the scatterometer offers a unique data set. Coverage by the QuikSCAT scatterometer virtually captures the globe’s TCs twice a day. Although the wind retrieval process has difficulties in both light and high winds, the data can be expected to provide the TC forecaster with knowledge of potential tropical cyclone genesis, position, movement, outer wind structure, and provides a 'minimum’ (at least) estimate of maximum sustained winds. This paper has made suggestions for current and future uses. Research still needs to be expanded. Possible avenues of work are provided in Table 0.2.b.2 An effort needs to be made to thoroughly understand the process of how the winds are estimated and to document its weaknesses and strengths. The QuikSCAT data set provides a ‘gold mine’ of opportunity to make great strides in the field of tropical meteorology and it is the author’s hope that people will push past the difficulties and work with the data. Hopefully, the scatterometer instrument will continue to be a mainstay in the suite of meteorological instruments now flying by the world’s space agencies.

Acknowledgments. This research was supported by the Naval Research Laboratory, Monterey through its programs at the Office of Naval Research (PE-060243N), and by the Oceanographer of the Navy through the program office at the Space and Naval Warfare Systems Command PMW-155 (PE-0603207N).


0.2.b.6: Bibliography


Arnold, C.P., C.C. Olsen, F. Wells, and T. Deemer, 1974: Tropical cyclone position and intensity analysis using satellite data, 97pp. First Weather Wing Pamphlet (1WWP) 105-10. [Available from the Air Weather Service Technical Library, Asheville, N.C.]

Atlas, R., R.N. Hoffman, S.M.Leidner, J. Sienkiewicz, T.-W. Yu, S. C. Bloom, E. Brin, J. Ardizzone, J.Terry, D. Bungato, and J. C. Jusem, 2001: The effects of marine winds from scatterometer data on weather analysis and forecasting. Bull. Amer. Meteor. Soc.,82, 1965-1990.

Chu, P., J.M. Veneziano, C. Fan, M.J. Carron, and W.T. Liu, 2000: Response of the South China Sea to tropical cyclone Ernie 1996. J. Geophys. Res.,105, 13,991-14.

Edson, R.T., 1997: Operational use of scatterometer data at the JTWC. Preprints, 22nd Conference on Hurricanes and Tropical Meteorology, Ft Collins, CO, Amer. Meteor. Soc..

___________ and J. D. Hawkins, 2000: A comparison of scatterometer-derived wind data over tropical cyclones as determined from ERS-2 and QuikSCAT data. Preprints, 24th Conference on Hurricanes and Tropical Meteorology, Ft Lauderdale, FL, Amer. Meteor. Soc., 195–196.

___________, M.A. Lander, C.E. Cantrell, J.L. Franklin, J.D. Hawkins, and P.S. Chang, 2002: Operational use of QuikSCAT over tropical cyclones. Preprints, 25th Conference on Hurricanes and Tropical Meteorology, San Diego, CA, Amer. Meteor. Soc., 195–196.

Freilich, M.H. and R.S.Dunbar, 1993: Derivation of satellite wind model functions using operational surface wind analyses: An altimeter example. J. Geophys., Res., 98, 14633-14649.

Jones, W.L., I. Adams, J. D. Park, and S.S.Chen, 2002: Evaluation of seawinds wind speed measurements. Preprints, 25th Conference on Hurricanes and Tropical Meteorology, San Diego, CA, Amer. Meteor. Soc., 555-556.

Katsaros, K. B., E. B. Forde, P. Chang, and W. T. Liu, 2001: QuikSCAT’s SeaWinds facilitates early identification of tropical depressions in 1999 hurricane season. Geophys. Res. Lett., 28, 1043–1046.

Liu, W. T., W. Tang, and R. S. Dunbar, 1997: Scatterometer observes extratropical transition of Pacific typhoons. Trans. Amer. Geophys. Union, 237-240.

Liu, K. S., and J.C.L. Chan, 1999: Size of tropical cyclones as inferred from ERS-1 and ERS-2 data. Monthly Weather Review, 127, 2992–3001.

___________and ___________, 2002: Synoptic flow patterns associated with small and large tropical cyclones over the western North Pacific. Monthly Weather Review, 130, 2134–2142.

Long, D., 2000: Point-wise Wind Retrieval Wind Scatterometry Background. A QuikSCAT/Sigma-0 Browse Product, Ver 2.0. Earth Remote Sensing (MERS), BYU University, Provo, UT., 16 pp.


Magnan, S.G., L. E. Carr III, R. L. Elsberry, and M. A. Booth, 1999: Calculating tropical cyclone critical wind radii and storm size using NSCAT winds. Preprints, 23rd Conference on Hurricanes and Tropical Meteorology. Dallas, TX, Amer. Meteor. Soc..

Naderi, F., M.H. Freilich, and D. G. Long, 1991: Spaceborne radar measurement of wind velocity over the ocean—An overview of the NSCAT scatterometer system. Proc. of the IEEE Trans. on Geoscience and Remote Sensing, pp. 850-866, Vol. 79, No. 6, June 1991.

Perry, K.L.,(Ed.), 2000: QuikSCAT science data product user’s manual, Ver. 2.0. Jet Propulsion Laboratory, California Institute of Technology, Pasadena, CA, 90 pp.

Ritchie, E., J. Simpson, W. T. Liu, C. Velden, K. Brueske, and J. Halvorsen, 2002: A closer look at hurricane formation and intensification using new technology. Coping with Hurricanes, R. Simpson, M. Garstang, and R. Anthes, eds., American Geophysical Society, Washington, DC, Chapter 12.

Sharp, R. J., M. A. Bourassa, and J. J. O’Brien, 2002: Early detection of tropical cyclones using SeaWinds-derived vorticity. Bull. Amer. Meteor. Soc., 83, 879–889.

Smith, D., C. Mears, C. Gentemann, and F.Wentz, 2000: Validation of QuikSCAT tropical cyclone winds. Preprints, 24th Conference on Hurricanes and Tropical Meteorology, Ft Lauderdale, FL, Amer. Meteor. Soc., 193–194.

Stiles, B.W., and S. Yueh, 2001: Impact of rain on QuikSCAT. Proc. of the AGU 2001 Fall Meeting, 10-14 Dec, San Francisco, CA (also submitted to IEEE
Trans. on Geoscience and Remote Sensing
).
Tenerelli, J.E., S.S. Chen, R. Foster, M. Lonfat, W.T. Liu, and R. Rogers, 2000: Surface winds in Hurricane Floyd: A comparison numerical simulations, aircraft, and QuikSCAT satellite data. Preprints, 24th Conference on Hurricanes and Tropical Meteorology, Ft Lauderdale, FL., Amer. Meteor. Soc., 418-419.

Quilfen, Y., B. Chapron, T. Elfouhaily, K. Katsaros, and J. Tournadre, 1998: Observation of tropical cyclones by high-resolution scatterometry. J. Geophys. Res., 103, 7767-7786.

Weissman, D.E., M.A.Bourassa, and J. Tongue, 2002: Effects of rain rate and wind magnitude on Sea Winds scatterometer wind speed errors. J. Atmos. Ocean. Technol., 19,738-746.

Wentz, F.J, and D.K. Smith, 1999: A model function for the ocean normalized radar cross-section at 14 GHz derived from NSCAT observations. J. Geophys., Res., 104, 11499-11524.


Appendix 0.2.b.A. ITWC Future Requirements for Increased Global Scatterometer Coverage
Statement: Current scatterometer daily coverage over the tropical waters is approximately 90%. The addition of another instrument similar to QuikSCAT with a similar swath width and offset by approximately 6 hours will provide a substantial benefit to the tropical cyclone operational and research community. Scatterometer instruments have shown to increase forecasting accuracy by providing extensive surface wind coverage in the assimilation of numerical weather prediction (NWP) models, by providing researchers with the necessary data to establish more precise physical concepts of behavior, and by providing tropical cyclone forecasters with increased knowledge in the data poor regions of the globe of position, outer wind structure, a ‘minimum’ (at least) maximum intensity, genesis and early stage development, and the evolution of the outer winds during extratropical transition.

A) An increase in global scatterometer coverage will:
i) Provide more thorough input to the NWP assimilation process
ii) Fill in the remaining 10% gaps over the tropical oceans
iii) Support the daily METWATCH and warning criteria of most tropical cyclone warning centers
-- Early detection, motion and history
-- Position
-- Outer wind structure of destructive winds (34kt and 50kt)
-- Provide a ‘minimum’ (at least) maximum wind intensity
-- Extratropical transition and dissipation

iv) Increase the data base for the research community

B) An increase in global scatterometer frequency will:

i) Provide input for each 6-hourly NWP analysis cycle

ii) Provide timely input to support the 6-hourly warning interval of most tropical cyclone warning centers

iii) Provide vital data during rapid changes in tropical cyclone motion, structure and character
-- Sudden changes in direction or speed, including rapid
acceleration cases
-- Movements over water from over land and rapid development
-- Synoptic scale interaction with other synoptic-scale features such as fronts or lows or in a multi-TC situation
-- Initial development or change in warning criteria wind radii (35kt, 50kt, or 64kt wind radii)
-- Rapid intensity change and existence or change in tropical storm(34kt) or hurricane (64kt) wind intensity criteria
-- Genesis and development of a closed circulation
-- Extratropical transition and transformation of wind structure