WMO/CAS/WWW
FIFTH INTERNATIONAL WORKSHOP ON TROPICAL CYCLONES
Topic 4.2 TROPICAL CYCLONE FORMATION AND EXTRATROPICAL TRANSITION Observations in addition to satellites.
Rapporteur: Jeff Callaghan
Bureau of Meteorology,
295 Ann Street Brisbane
4001, Australia.
E-mail J.Callaghan@bom.gov.au
Fax: 61 7 32214895
Working Group: Peter Bowyer, Michael Foley.
Abstract: Tropical cyclone formation and extra-tropical transition occur mostly in data sparse oceanic regions and heavy reliance is made on satellite data to locate, analyse and forecast these processes. Nevertheless we show how essential other data is for understanding and accurate forecasting of these events.
4.2.1 Introduction.
During the past four years there has been increasing interest in tropical cyclone formation and extra-tropical transition (ET). Rapidly forming tropical cyclone and strong ET events near populated regions have proved to be a challenge for forecasters and disaster managers. Much emphasis has been made on using satellite remote sensing data to solve all the forecasting problems. However a lack of conventional meteorological data can lead to incorrect tropical cyclone forecasts with disastrous results. We describe recent research into tropical cyclone formation and extra- tropical transition using non-satellite data. We show how conventional observations can be used to diagnose tropical cyclone formation and the evolution of ET. Buoy data is examined to show the extreme wave conditions that can develop with rapidly translating storms of modest intensity.
4.2.2 Aircraft observations-Tropical cyclone formation.
Observations from reconnaissance aircraft contribute to the understanding of tropical cyclone formation and we describe some recent work. A low level jet, which blows through the Isthmus of Tehuantepec in Mexico, has been linked to tropical cyclogenesis. Aircraft dropsonde data (Zehnder and Raymond 2002) diagnosed this low level northeasterly jet over the Gulf of Tehuantepec. This jet along with the southwest monsoon flow resulted in the development of a low level cyclonic circulation, which became tropical storm Lorena. Errors occur in Aircraft thermodynamic instrumentation due to evaporative cooling have been studied using a modified Barnes radiometer (which is more accurate in cloud and precipitation) (Easton et al 2002). Correction methods have been found to be inadequate and the use of more accurate instrumentation will lead to better understanding in the relationship between convection and the evolution of tropical cyclones. Cheung (2002) was able to study the formation of typhoon Robyn (1993) because aircraft data available during the TCM-93 field experiment was able to define the structure of several mesoscale convective systems associated with the formation process. Aircraft dropsonde data from the Jet2000 Experiment (Thorncroft et al 2002) is leading to better understanding of the African easterly jet and African easterly waves.
4.2.3 Aircraft observations - ET.
Hurricane Michael underwent rapid deepening (14hPa in 6h) east of Nova Scotia on 19 October 2000. A dropsonde (Abraham et al 2002) released less than 100km east of the centre showed a deep layer of maximum winds up to 72m/s between elevations of 500m and 2500m.
4.2.4 Lightning- Tropical cyclone formation.
Molinari et al (2002), used lightning data from the National lightning detection network to study the genesis of Hurricane Danny in the Gulf of Mexico. Four localised convective outbreaks occurred starting near the 110km radius from the centre, then shifting progressively inward and intensifying (Figure 1). The final, and also the most intense, outbreak occurred as the depression was named a tropical storm. Thereafter the lightning was mainly confined to the outer band region even during and after the transition to the hurricane stage.
4.2.5 Radar example of tropical cyclone formation.
Rapidly forming small tropical cyclones near populated areas are a major concern to tropical communities. For example tropical cyclone Adel struck an Island in Papua New Guinea with little warning and killed 15 people. When such events occur near the coast and amidst relatively dense observational networks our understanding of this phenomenon improves. The radar and corresponding mean sea level charts during such a genesis event are shown in Figure 2. In 12h a shallow tropical low with scattered showers formed into tropical cyclone Celeste. It reached hurricane force 12h later.
4.2.6 Aerosonde Robotic Aircraft
The Aerosonde Company have established a global aircraft operation, with a central command facility and aircraft operating from a distributed set of launch-recovery sites. This mode was successfully tested during operational trials for the Australian Bureau of Meteorology in early 1998. These aircraft have the potential to collect valuable data over data sparse regions of the tropical and sub-tropical oceans and therefore be of great value to the forecasting of tropical cyclone formation and ET.
4.2.7 Upper wind observations associated with tropical cyclone formation.
Extreme rainfall events in the northeast Australian tropics have been observed to occur where the wind direction backs (turns anti clockwise) with height. The wind directions in these events were mainly confined to the northeast quadrant below 500hPa. In Brisbane, a study by
Figure 1. Radius-time plot of the
number of flashes in each 20km
radial bin for each hour. The
contours begin at 40 flashes/h
and then increase in a
logarithmic fashion (80, 160,
320). Light shading represents
40-160 flashes/h and dark shading
> 160 flashes/h.
Figure 2. Radar observations
at 0500UTC and 1800UTC 26
January 1996 (range rings
are 50km apart). Lower
frames show the MSL charts
close to these times.
Samantha Taylor, related such warm air advection to heavy rain in the Australian northeast tropics using all available data from the national archive of the Australian Bureau of Meteorology. For weaker rainfall Connor and Bonell (1998) found that warm air advection, particularly in the layer between 950 and 800 hPa, contributed significantly to trade wind precipitation amounts along the north Queensland coast. Trenberth (1978) deduced that the thermal advection term dominated the quasi-geostrophic omega equation in the tropics. When intensifying tropical cyclones pass close to upper wind observing stations we have observed warm air advection with accompanying heavy rain on one side of the cyclone with cold air advection with much less rainfall on the opposite side.
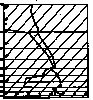
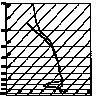
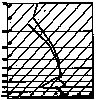
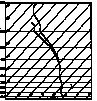
Holland’s (1984) composite tropical cyclones show such a change in the sign of thermal advection either side of the centre. We illustrate this in the left frame of Figure 3, where the 500hPa streamlines are overlaid over the 850hPa streamlines for his AUS09 intensifying tropical storm composite. Regions where the winds veered or backed with height between 850hPa and 500hPa are highlighted. The 500hPa moisture fields for this composite in the right hand frame of Figure 3, indicate that most of the deep convection is located near the warm air advection region, east of the centre. We also constructed the same thermal advection fields for his AUS06 composite (developing oceanic hurricane) and compare it with the 500hPa equivalent potential temperature fields for the AUS06 composite. These are shown in Figure 4 and again the change in sign of thermal advection across the storm is evident with the deep moisture favoring the warm air advection side.
Figure 3. Left -500hPa streamlines (dashed arrows) and 850hPa streamlines (solid lines) for developing SW Pacific tropical storm composite with region where the winds veer (back) with height marked by horizontal (vertical) hatching. Right – 500hPa mixing ratio filed (g/kg) for the same composite.
Figure 4. As in Figure 3 except for AUS06 composite (SW Pacific developing oceanic hurricane) and 500hPa moisture represented by 500hPa equivalent potential temperature (K).
4.2.8 Extra-tropical transition (strong and weak)
In ET, Klein et al (2000) has shown that the distribution of thermal advection contributes significantly to the increase in low-level cyclonic vorticity. When the thermal field is distorted through circular motion, the thermal contribution becomes significant. Harr and Elsberry (2000) compared strong and weak ET cases. The mid-latitude circulation pattern into which their strong ET case moved during ET was such that the cyclone and the amplifying mid-latitude wave became coupled so that they reinforced each other, which lead to development of a significant extra-tropical cyclone. This is similar to the self development process proposed by Sutcliffe and Forsdyke(1950)where cold advection intensifies the cold thermal trough and warm air advection builds the thermal ridge. In a weak non-intensifying example from Harr and Elsberry (2000), there was a cold mid-latitude cyclone poleward of the tropical cyclone. The warm air advection maximum was about 900 km from the cyclone (their Figure 14 (c)) and well removed from the thermal ridge. Whereas, in their strong case the warm air advection maximum was much closer to the cyclone and the axis of the thermal ridge (their Figure 5(c)).
a) Examples of strong and weak ET
In Figure 5, are the mean sea level (MSL) charts showing the results of strong and weak ET near Brisbane. These cases of ET occurred as upper troughs approached tropical cyclones Lance (top frames) and Nancy (lower frames). The Brisbane winds indicated (top right frame) strong warm air advection (backing with height) ahead of the upper trough as Lance rapidly intensified between 0500UTC 7 April 1984 (0705) and 0500UTC 8 April 1984 (0805). In contrast the Brisbane winds indicated
Figure 5. MSL chart
and Brisbane upper
winds for Lance from
2300UTC 6/4/1984
to 2300UTC 8/4/1984
MSL chart for
Nancy at 2300UTC
2 February 1990 and
Brisbane upper winds
For 1600UTC to
1000UTC 2/2/1990
(lower right frame) very little warm air advection ahead of the upper trough as Nancy weakened between 1000UTC 1 February 1990(0110)and 1000UTC 2 February 1990 (0210).
b) Rapid translation associated with strong ET
These events are characterized by heavy precipitation to the right (left) side of the track in the Southern Hemisphere (Northern Hemisphere) and as an example, Figure 6 shows the track and rainfall distribution associated with tropical cyclone Audrey. This storm was rapidly translating and caused widespread severe wind damage across the interior of Australia on the left side (opposite to the rainfall side). It was synoptically a very similar event to the ET of tropical cyclone Herbie (Foley and Hanstrum 1994).
These two storms passed close to and just to the south of two Australian Meteorological offices (Charleville and Carnarvon) and the upper wind time series for both these stations during the two ET events are shown in Figure 6. Both stations were just to the north of the heavy rain areas and had low level northerly winds.
In the heavy rain region the low level winds were from an easterly direction. The upper winds from both stations exhibit a backing with height wind profile (warm air advection) and very strong winds developed over the stations just to the east of the cyclones. When storms moved westward following ET e.g. Bola (Sinclair 1993b), the heavy rain occurs to the left of the track in the Southern Hemisphere.
Figure 6. Track and rainfall distribution (left frame) associated with the ET of tropical cyclone Audrey with the location of Charleville marked by “C”. Charleville upper winds as Audrey approached the station from the northwest (centre frame) are compared with those at Carnarvon as the transitioning Herbie approached that station.
c) Drena-weak ET over Norfolk Island subsequently becomes strong
Tropical cyclone Drena underwent ET near New Caledonia in the southwest Pacific (Buckley and Leslie 1998) and it passed over Norfolk Island. The Meteorological Office on the Island recorded its lowest MSL pressure of 971.3hPa at 0615UTC 9 January 1997. Despite such a low pressure, wind damage was light on Norfolk Island with only minor crop and tree damage. However later the storm caused severe wind damage in New Zealand with winds reaching hurricane force in the Bay of Islands. The destructive cyclonic winds more or less leap-frogged Norfolk Island. The upper wind time series at the Island (Table 1), shows deep warm air advection disrupted by a layer of cold air advection at low levels as Drena approached the Island. The cold air advection appeared to be associated with a southwards slope of the cyclone up to 785hPa. Radiosonde data (Figure 7) showed that this cold air advection corresponded with a dry layer beneath the deep middle level moisture. This dry region can be seen to disappear on the 1600UTC radiosonde when continuous rain commenced. Therefore as the major cloud band to the south of Drena passed over the Island (see Figure 8) little rain was recorded. The heavier rain commenced around 1530UTC 8 January and 115mm fell in the next 12h. Satellite imagery (Figure 8) indicated that the major cloud band was then developing south of the Island. This heavy rain at Norfolk was associated with cloud bands circulating around the eye of Drena. Strong warm air advection then began developing over New Zealand east of a deep-layered trough system, which moved across the Tasman Sea.
| 200hPa | 320/60 | 320/42 | |
| 300hPa | 310/38 | 340/58 | |
| 400hPa | 330/32 | 005/44 | |
| 500hPa | 360/42 | 020/34 | |
| 600hPa | 360/28 | 030/34 | |
| 700hPa | 110/12 | 040/32 | |
| 785hPa | 135/10 | 100/32 | |
| 850hPa | 060/24 | 105/26 | 085/48 |
| 900hPa | 065/30 | 090/36 | 095/62 |
| Date/ Time(Z) | 080400 | 081000 | 081600 |
The limited fetches associated with circular wind fields can at times limit the growth of waves generated by a tropical cyclone. This limitation can be removed for tropical cyclones large in size and for rapidly translating cyclones, which are often found undergoing ET.
Tropical cyclone Justin (Figure 9) was a large system and was named at 2300UTC 6 March 1997 (right frame in Figure 9). By this time, due to its large size, huge seas had developed and that day a yacht foundered southwest of the centre. Over its long lifetime it sunk three other vessels and badly damaged many others.
Dysthe and Harbitz (1987) carried out analytical and observational research on huge waves generated by small Arctic lows. They found fetch enhancement could occur when the speed of movement of the low divided by the component of wind velocity in its direction of motion was between .25 and .5. One example of this phenomenon was associated with hurricane Luis (Bowyer 2000). A much weaker hurricane generated similar large waves in 1998. Figure 10 covers the track of Danielle as it moved towards a buoy at around 13 m/s. The buoy measured a significant wave height of 15.8 metres and peak height of 26.9 metres at 0900 UTC 3 September 1998 as the hurricane passed near the buoy (Abraham personal communication) with peak sustained wind speeds of 29 m/s measured. There was a phenomenal increase in wave height before the maximum height was read. At 0700 UTC the significant wave height was 6.5 metres and at 0800 UTC the significant wave height was 13.4 metres. This clearly showed that the peak waves were moving with the storm.
Figure 9. MSL charts for 2300UTC 5March 1997 (left) and 2300UTC 6 March 1997 (right).
Figure 10. Six hourly positions of hurricane
Danielle from 0000UTC 2 September 1998 to
1200UTC 3 September 1998.
4.2.10 Summary
We described recent research into tropical cyclone formation and extra-tropical transition taking advantage of data other than that obtained from satellites. Radar observations show just how quickly convection becomes organised into bands during tropical cyclone formation. Intensifying tropical cyclone composite charts derived from upper air observations, showed asymmetric thermal and moisture structure consistent with upper air observations obtained in the vicinity of intensifying tropical cyclones. Upper wind observations near tropical cyclones undergoing extra-tropical transition can reveal if the process is a strong or a weak one. We looked at the rainfall patterns, which are associated with extra-tropical transition and the type of tropical cyclone formation and ET events, which generate extremely dangerous sea conditions. Finally, at the workshop we will examine two tropical cyclone events in regions devoid of upper air observations. In both these cases the numerical forecast guidance was poor and both tropical cyclones destroyed ocean going vessels.
Bibliography
Abraham, J., Fogarty, C and Strapp. 2002: Extra-tropical transition of
Hurricanes Michael and Karen: Storm Reconnaissance with the Canadian Convair 580 Aircraft. Preprints, 25th Conference on Hurricanes and Tropical Meteorology, Amer. Meteor. Soc.
Bowyer, P. J. 2000: Phenomenal waves with a translating tropical
cyclone (Luis, the Queen and the buoys). Proceedings of the 24th Conference on Hurricanes and Tropical Meteorology, Ft. Lauderdale, FL, American Met. Soc., 294-195.
Bracken,W.E. and L. F. Bosart. 2000. The Role of Synoptic-Scale Flow
during Tropical Cyclogenesis over the North Atlantic Ocean. Mon. Wea Rev.
128. pp 353–376.
Brown, R. A., and L. Zeng, 2001: Comparison of Planetary Boundary Layer Model Winds with Dropsonde Observations in Tropical Cyclones. J. App. Meteor., 40, 1718-1723.
Buckley, B.W. and Leslie, L.M. 1998, High resolution Numerical Simulation of Tropical Cyclone Drena Undergoing Extra-Tropical Transition. Meteor. Atmos. Phys. 65, 207-222.
Cheung, K.K.W. 2002. Numerical simulation of the formation of Typhoon Robyn (1993). Proceedings of the American Meteorological Society 25th Conference on Hurricanes and Tropical Meteorology, San Diego California April/May 2002.
Connor, G. J. and Bonell, M. 1998. Air mass and dynamic parameters affecting trade wind precipitation on the northeast Queensland tropical coast. Int. J. Climatol., 18, 1357-1372.
Cione J. J., Black P. G., Houston S. H., 2000: Surface observations in the hurricane environment. Mon. Wea. Rev., 128, 1550-1561.
DeMaria, M., J. A. Knaff, and B. H. Connell, 2001: A Tropical
Cyclone Genesis Parameter for the Tropical Atlantic. Wea. Forecasting, 16, 219-233.
DiMego, G. J., and L. F. Bosart, 1982: The transformation of tropical
storm Agnes into an extratropical cyclone. Part I: The observed fields and vertical motion computations. Mon. Wea. Rev., 110, 385–411.
Dysthe,K.B. and Harbitz, A. 1987: Big waves from polar lows. Tellus 39A,500-508.
Foley, G. R., and B. N. Hanstrum, 1994: The capture of tropical cyclones by cold fronts off of the west coast of Australia. Wea. Forecasting, 9, 577–592.
Eastin, M. D., 1999: Instrument wetting errors in hurricanes and a re examination of inner-core thermodynamics. Dept. Atmospheric Science Paper 683, Colorado State University, Fort Collins, CO, 203 pp. [Available from Dept. Atmospheric Science, Colorado State University, Fort Collins, CO 80523.].
Eastin, M. D., P. G. Black, and W. M. Gray, 2002: Flight-level instrument wetting errors in hurricanes. Part I: Observations. Mon. Wea. Rev., 130, 825–841.
Eastin, M. D., P. G. Black, and W. M. Gray, 2002:Flight-Level Thermodynamic Instrument Wetting Errors in Hurricanes. Part I: Observations Monthly Weather Review: Vol. 130, No. 4, pp. 825 841.
Harr, P. A., and R. L. Elsberry, 2000: Extratropical transition of tropical cyclones over the western North Pacific. Part I: Evolution of structural characteristics during the transition process. Mon. Wea. Rev., 128, 2613–2633.
Harr, P. A., and T. F. Hogan, 2000: Extratropical transition of tropical cyclones over the western North Pacific. Part II: The impact of midlatitude circulation characteristics. Mon. Wea. Rev., 128, 2634–2653.
Hart, R. E., and J. L. Evans, 2001: A Climatology of the Extratropical
Transition of Atlantic Tropical Cyclones. J. Climate, 14, 546 564.
Hanley, D., J. Molinari, and D. Keyser, 2001: A Composite Study of the
Interactions between Tropical Cyclones and Upper-Tropospheric Troughs. Mon. Wea. Rev., 129, 2570-2584.
Hall, J. D., A. J. Matthews, and D. J. Karoly, 2001: The Modulation of
Tropical Cyclone Activity in the Australian Region by the Madden Julian Oscillation. Mon. Wea. Rev., 129, 2970-2982.
Heymsfield, G. M., J. B. Halverson, J. Simpson, L. Tian, and T. P. Bui, 2001: ER-2 Doppler Radar Investigations of the Eyewall of Hurricane Bonnie during the Convection and Moisture Experiment-3. J. App. Meteor., 40, 1310-1330.
Holland,G.J.1984. On the climatology and structure of tropical
Cyclones in the Australian/southwest Pacific region. Aust. Met. Mag., 32, 1-46.
Klein, P. M., 2000: Tropical cyclone and midlatitude characteristics and physical mechanisms contributing to extratropical transition in the western North Pacific. Ph.D dissertation, Naval Postgraduate School, Monterey, CA, 250 pp.
Klein, P. M., P. A. Harr, and R. L. Elsberry, 2000: Extratropical transition of western North Pacific tropical cyclones: An overview and conceptual model of the transformation stage. Wea. Forecasting., 15, 373–395.
Lee, W.-C., and F. D. Marks, Jr., 2000: Tropical cyclone kinematic structure retrieved from single Doppler radar observations. Part II: The GBVTD-simplex center finding algorithm. Mon. Wea. Rev., 128, 1925-1936.
Lee, W.-C., J.-D. Jou, P.-L. Chang and F. D. Marks, 2000: Tropical cyclone kinematic structure retrieved from single- Doppler radar observations. Part III: Evolution and structure of Typhoon Alex (1987). Mon. Wea. Rev., 128, 3982-4001.
Molinari, J., D. Vollaro, S. Skubis, and M. Dickinson, 2000: Origins and mechanisms of eastern Pacific tropical cyclogenesis: A case study. Mon. Wea. Rev., 128, 125-139.
Molinari, J., and D. Vollaro, 2000: Planetary and synoptic scale influences on eastern Pacific tropical cyclogenesis. Mon. Wea. Rev., 128, 3296-3307.
Molinari, J., D. Vollaro and K. Corbosiero, 2002. Genesis of a hurricane in a sheared environment. Proceedings of the American Meteorological Society 25th Conference on Hurricanes and Tropical Meteorology, San Diego California April/May 2002.
Nakazawa, T., 2001: Suppressed Tropical Cyclone Formation over the Western North Pacific in 1998. J. Meteor. Soc. Japan, 79, 173 183.
Oreste, R., and R. Atlas, 2001: Tropical Cyclone-Like Vortices in the Extratropics: Observational Evidence and Synoptic Analysis. Wea. Forecasting, 16, 7-34.
Palmén, E., 1958: Vertical circulation and release of kinetic energy during the development of Hurricane Hazel into an extratropical storm. Tellus., 10, 1–21
Pasch,R.J., Lixion A. Avila, and John L. Guiney 1998. Atlantic Hurricane Season of 1998 Monthly Weather Review: Vol. 129, No. 2, pp 3085–3123.
Petterssen, S., 1955: A general survey of factors influencing development at sea level. J. Meteor., 12, 36–42.
Petterssen, S., 1956: Weather Analysis and Forecasting. Vol I. 2d ed. McGraw-Hill, 428 pp.
Petterssen, S., and S. J. Smebye, 1971: On the development of extratropical cyclones. Quart. J. Roy. Meteor. Soc., 97, 457–482.
Ritchie, E.A. and Holland, G.H. 1999: Large-Scale Patterns Associated
with Tropical Cyclogenesis in the Western Pacific. Mon. Wea.
Rev., 127, 2027-2043.
Sinclair, M. R., 1993: Synoptic-scale diagnosis of the extratropical
transition of a southwest Pacific tropical cyclone. Mon. Wea. Rev., 121, 941–960.
Sinclair, M. R., 1993b: A diagnostic study of the extratropical precipitation resulting from tropical cyclone Bola. Mon. Wea. Rev., 121, 2690–2707.
Sinclair, M. R., 2002: Extratropical transition of southwest Pacific tropical cyclones. Part I: Climatology and mean structure changes. Mon. Wea. Rev., 130, 590–609.
Sutcliffe, R. C., and A. G. Forsdyke, 1950: The theory and use of upper air thickness patterns in forecasting. Quart. J. Roy. Meteor. Soc., 76, 189–217.
Thorncroft, C., and S. C. Jones, 2000: The extratropical transitions of Hurricanes Felix and Iris in 1995. Mon. Wea. Rev., 128, 947–972.
Thorncroft, C., and K. Hodges, 2001: African Easterly Wave Variability and Its Relationship to Atlantic Tropical Cyclone Activity. J.
Climate, 14, 1166-1179.
Thorncroft, C., and I. Pytharoulis, 2001: A Dynamical Approach to
Seasonal Prediction of Atlantic Tropical Cyclone Activity. _Wea.
Forecasting, 16, 725-35.
Thorncroft, C.D. et al 2002. The JET2000 experiment; Aircraft observations of the African easterly jet and African easterly
waves. Accepted for publication in the Bulletin of the American
Met. Soc.
Trenberth, K.E. 1978. On the interpretation of the Diagnostic Quasi Geostrophic Omega Equation, . Monthly Weather Review: Vol. 106, p. 131B137.
Zehnder, J.A. and Raymond, D.J. 2002. The genesis of East Pacific tropical storm Lorena. Proceedings of the American Meteorological Society 25th Conference on Hurricanes and Tropical Meteorology, San Diego California April/May 2002.