The SFMR in Hurricane Floyd 1999

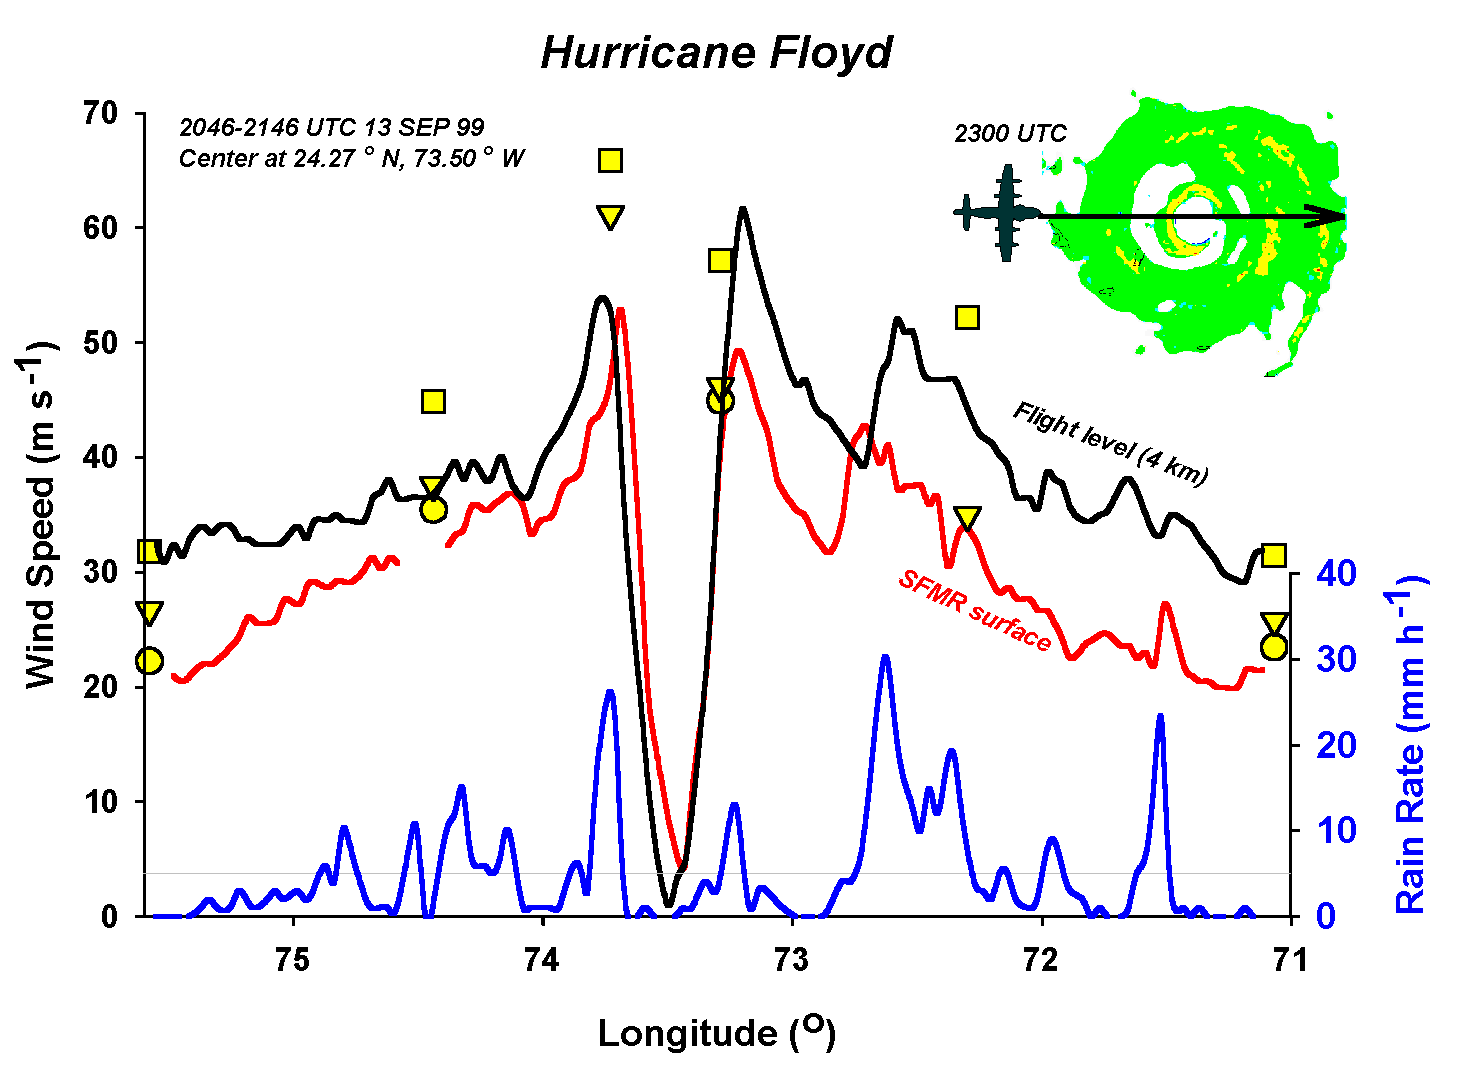
As shown by the green, horizontal radar plot in the upper right
this is data from a west-to-east aircraft pass across Hurricane
Floyd (1999) when it was a Category 4 hurricane due east of Miami.
The graph compares wind measured at 6 km altitude (black curve)
with that sensed remotely at the surface by the SFMR (red curve)
and measured by dropsondes (yellow emblems). The SFMR rain rate
esitmate is shown by the blue curve.
Return to SFMR page.
Return to P3 aircraft page.

