Mission Summary
20101104I1 Aircraft 43RF
TDR Mission Summary
Tropical Storm Tomas
Aircraft Crew (43RF)
| Aircraft Commander | Mark Nelson |
| Co-pilot | Harris Halverson |
| Co-pilot | Mark Sweeny |
| Flight Engineer | Dewie Floyd |
| Flight Engineer | Paul Darby |
| Navigator | Chris Sloan |
| Flight Director | Barry Damiano |
| System Engineer | Dana Naeher |
| Data Technician | Mike Mascaro |
| Dropsonde Operator | Jeff Smith |
| Crew Chief | Kevin Rotteveel |
Scientific Crew (43RF)
| Lead Scientist | Sim Aberson |
| Radar Scientist | John Gamache |
| Dropsonde Scientist | Tomislava Vukicevic |
| Cloud Physics Scientist | Terry Lathem (GeorgiaTech) |
Mission Plan :
N43RF is scheduled to fly an EMC-tasked Tail Doppler Radar mission into
Tropical Storm Tomas in the Central Caribbean Sea. Takeoff at 0800 UTC
04 November from MacDill. The plan is to go around the east side of Cuba and
approach Tomas from the north. A figure-4 with 90-nm legs will be performed,
leaving the aircraft on the west side of the storm. A final pass through the
center from west to east is performed before recovery in St. Croix.
Mission Summary :
| Take off
| Landing
| MacDill AFB, FL
| 04/08:00UTC
| St. Croix, USVI
| 04/15:30 UTC
| |
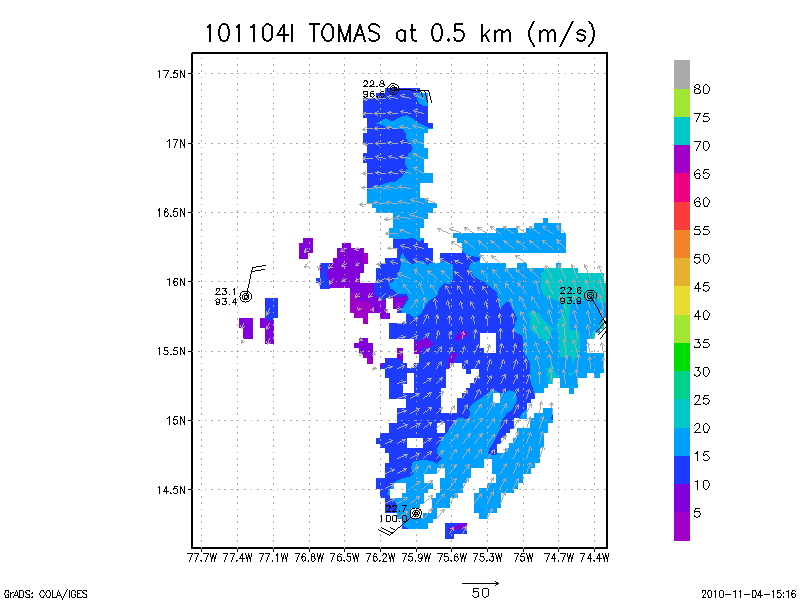
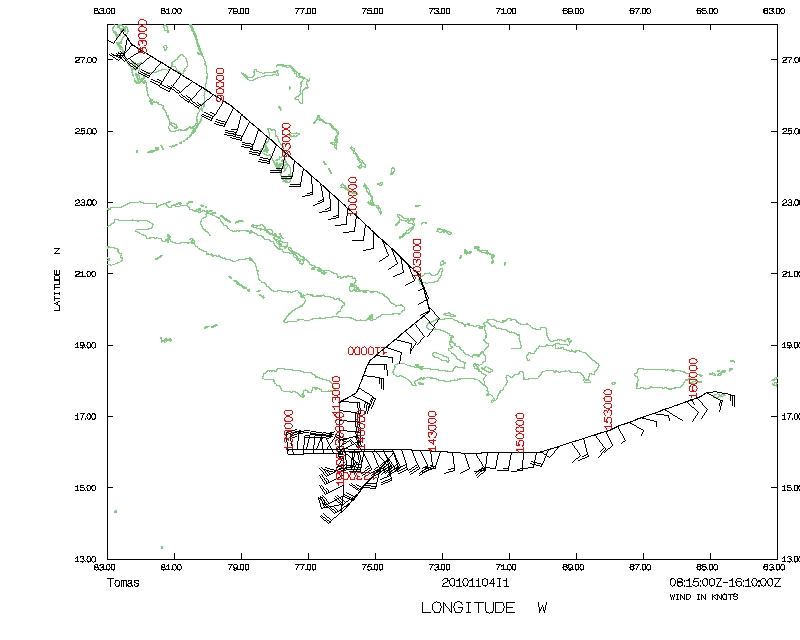
Figure 1. Dropwindsonde/Doppler radar composite at 0.5 km altitude from
20101104I1 flight into Tomas.
The mission was fully successful with 7 dropwindsondes released at the
endpoints and in the center, and three radar analyses sent. Also very
successful was a test of getting the radar data sent directly from the
aircraft to NCEP/NCO. The satellite presentation of Tomas was not
improving, but the pressure was dropping slowly before and during the flight.
Tomas remained a weak tropical storm under low shear, but was not strengthening
as expected. Radar composites showed an interesting structure at low levels
(Fig. 1), with a very small core with a radius of maximum wind speeds of about
20 km, and an outer core with stronger winds extending more than 150 km away
from the center. Strongest winds at the lowest level were in the 40-50-kt
range suggesting that the initial intensity of 45 kt from NHC was a little
high.
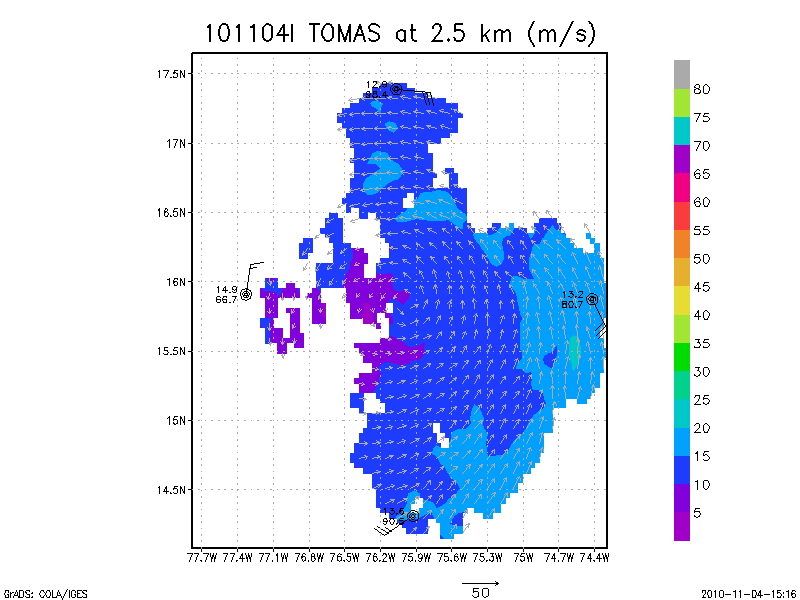
Figure 2: As in Fig. 1, but at 2.5 km altitude.
The inner wind speed maximum disappeared by 2.5 km altitude (Fig. 2),
and the well-defined wind center disappeared by 4 km altitude (Fig. 3). All
levels showed the convective asymmetry of the storm, with nearly all reflectors
on the east side. No large shear was evident in the Doppler.
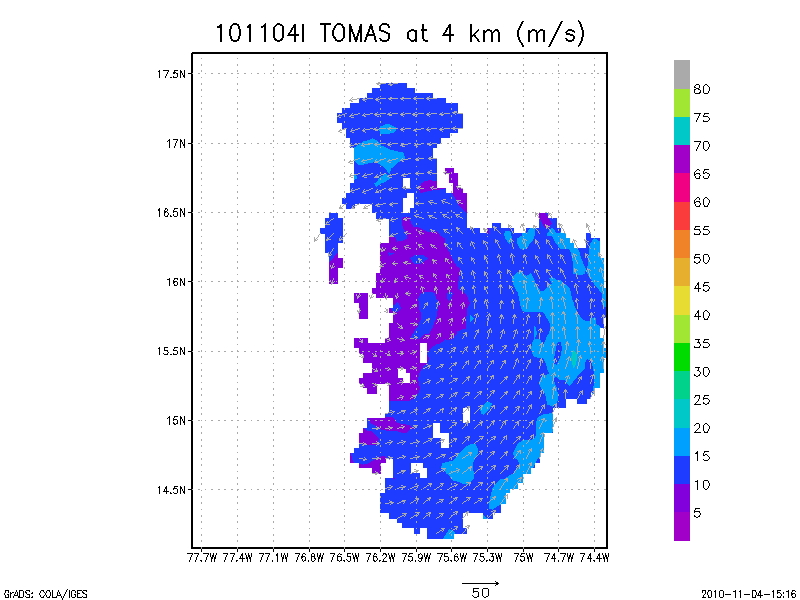
Figure 3: As in Fig. 1, but at 4 km altitude.
Problems :
There were some radar problems early in the flight that the engineers were
able to fix. Otherwise, the flight was uneventful.
Mission Data :
LPS forms |
Radar forms |
Dropsonde forms
Serial data |
1 second data |
NetCDF data |
SFMR
(NetCDF) data |
Page last updated February 22, 2011
Return to Mission page.