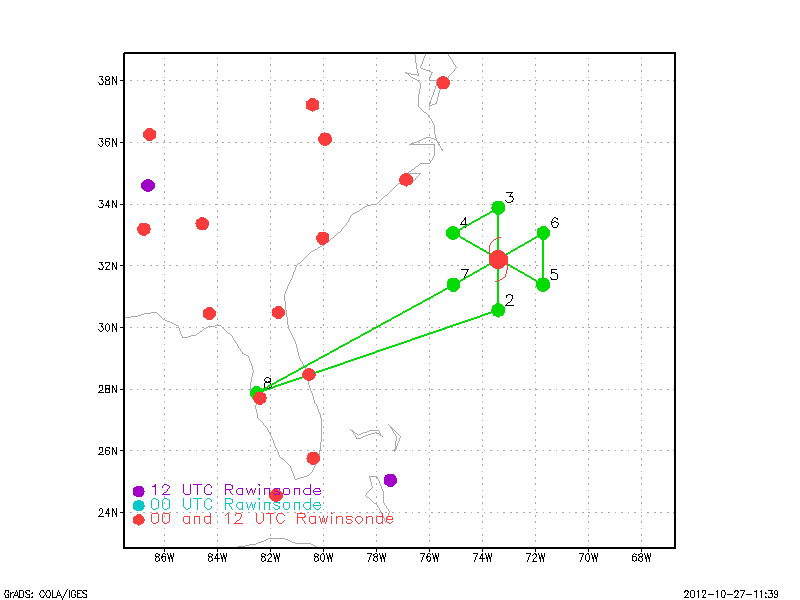
Figure 1.Proposed track 20121028H1
| Aircraft Commander | Harris Halverson |
| Co-pilot | Scott Price |
| Co-pilot | Justin Kibbey |
| Navigator | Devin Brakob |
| Flight Engineer | Ken Heystek |
| Flight Engineer | Paul Darby |
| Flight Director | Barry Damiano |
| Flight Director | Richard Henning |
| Data Technician | Joe Bosko |
| AVAPS | Charles Lynch |
| Electronics Technician | Todd Richards |
| Lead Scientist | Frank Marks (HRD) |
| Dropsonde Scientist | Kathryn Sellwood (HRD) |
| Radar Scientist | Lisa Bucci (HRD) |
| Observer | Craig Mclean (OAR) |
| Observer | Sandy MacDonald (OAR) |
Mission Plan :
NOAA42 will fly a tail Doppler radar (TDR) mission into Hurricane Sandy to gather tail Doppler data. NOAA42 will take off from MacDill AFB at 0800 UTC and will recover at MacDill AFB by 1600 UTC. The flight plan (see Figure 1 above) called for a butterfly pattern with 105 nm legs at 12,000 ft with AXBT/dropsonde combos at the end, middle, and RMW on each leg, and on the first and last penetration. Doppler analyses and quality control, as well as the dropsonde quality control will be done on the aircraft. IWRAP is installed and will be run during the mission forcing the LF to have a wedge of coverage missing right behind the aircraft to avoid interference with IWRAP.
Mission Summary :
| Take off | Landing
| MacDill AFB, FL | 07:58 UTC
| MacDill AFB, FL | 16:04 UTC
| | ||
As Hurricane Sandy continued to move northward up the east coast east of the Carolinas and the Gulf Stream NOAA P-3 missions collected airborne Doppler radar data to use in initializing and evaluating model guidance (see Fig. 6 flight track below plotted over the SST). It was clear from the center drops that the central pressure was around 956 hPa and the SFMR suggested peak surface winds between 64 to 68 kts kts.
In Fig.3 you see images are at three altitudes, 1 km, 3 km, and 6 km, using a composite of winds from three legs from the P-3 oriented south-north, northwest-southeast, and northeast-southwest. Also plotted on the 1-km altitude analysis are the locations of dropsondes deployed by the P-3 (plotted using standard station symbols). These analyses show that Sandy's precipitation is still pretty organized, with the bulk of the precipitation still on the west side of the storm, but much more centered over the inner core of the storm suggesting that Sandy continue to resist dry air getting into the core. However, unlike in the previous mission, the circulation is better organized and more aligned with altitude, with only slight northward tilt of the center from 1- to 6- km altitude, indicative of decreasing southerly shear of the horizontal wind over the storm even though the storm is interacting with the strong trough to the west. There still is a hint of an inner wind maximum at 50 km radius from the center at all altitudes shown, but the strongest winds remain over 150 km from the center. As in the previous analysis, the strongest winds continue to rotate from southwest of the circulation center at 1 -km, to south of the center at 3-km, and south-southeast of the center at 6- km altitude, suggesting that the shear direction remains from the south.
(a) | (b) | (c) |
Satellite imagery (Figs. 4 & 5 below) depicted the cloud and precipitation structure during the missions. The top left image show the IR brightness temperatures that show a very asymmetric high cloud distribution with the coldest cloud tops (or the central dense overcast) to the north and west of the circulation center and very little cold cloud east of the center. There were cold clouds rotating around to the south of the center during the mission, but they appeared to dissipate and a new cold cloud feature we repeatedly try to rotate around the center. The top right image shows the visible cloud filed with a few tall convective turrets in the rainbands south and east of the center. Other than those turrets the vast majority of the high bright clouds are to the north and west of the center. The bottom two images are showing the condensed precipitation, where the lower left image is the 37-GHz color image that shows the emission signal from rain in the blue-green colors and the scattering emission signal from large ice in the pink colors. The lower right image depicts estimates of rain from TRMM (TMI and PR). Both images suggest that the heaviest rain was in the bands to the north and west of the center, with strong ice scattering in convective turrets embedded in the major outer rainband 120 nm to the north of the center. The rain emission signal suggests low-level precipitating bands are wrapping around the center, but there is very little ice scattering evident.
(a) | (b) |
(a) | (b) |
16 GPS dropsondes (1 failed) were deployed, processed and transmitted during the mission. 18 AXBTs were also deployed, 12 of which worked. The AXBTs suggested the storm was well east of the Gulf Stream (see Fig.6 flight track image plotted over the microwave SST product from RSS) with SST in the vicinity of the storm center was 25-25.5°C. We had one AXBT 120 nm NW of the center that likely fell into the Gulf Stream with and SST >26°C.
Mission Evaluation:
This was a very successful mission that met all objectives without any major issues. 3 radar analyses, sets of superobs and radial files were completed and transmitted to the ground. The dropsonde quality control worked wonderfully. The upper-ocean sampling was also very successfully executed with >66% of the ocean probes working.
Problems :
We had one radar system glitches when the power cycled once during the mission. No significant amount of radar data was lost during the power glitch. The IWRAP worked well during the flight.
| Item | Total | Good | Bad |
| GPS sondes | 16 | 15 | 1 |
| AXBTs | 18 | 12 | 6 |
| Radar analyses | 3 | 3 | 0 |
Frank D. Marks
2012-10-28
Mission Data :
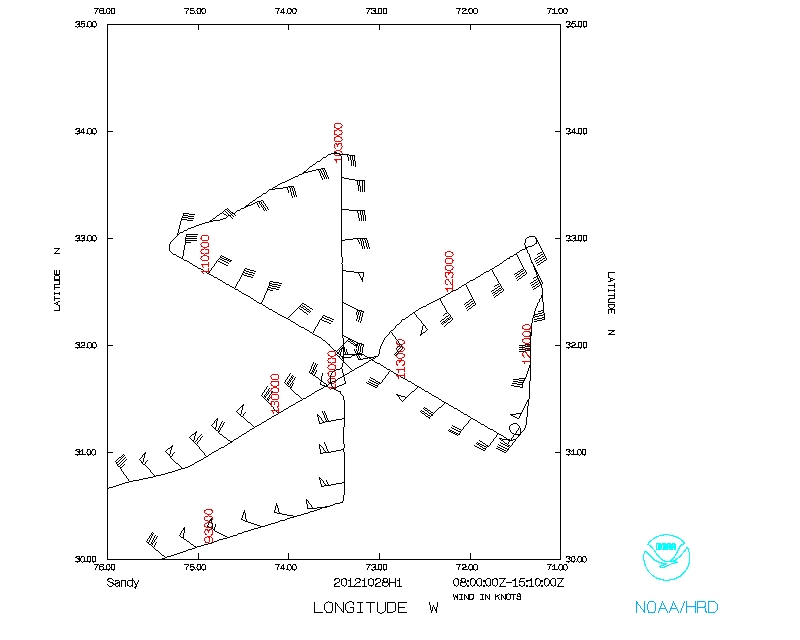 Flight track |
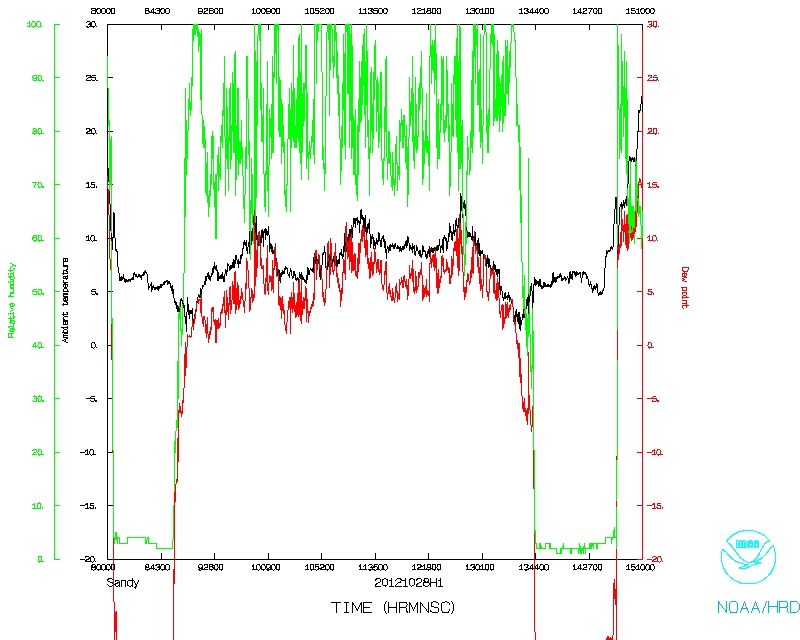 Temperature and Moisture |
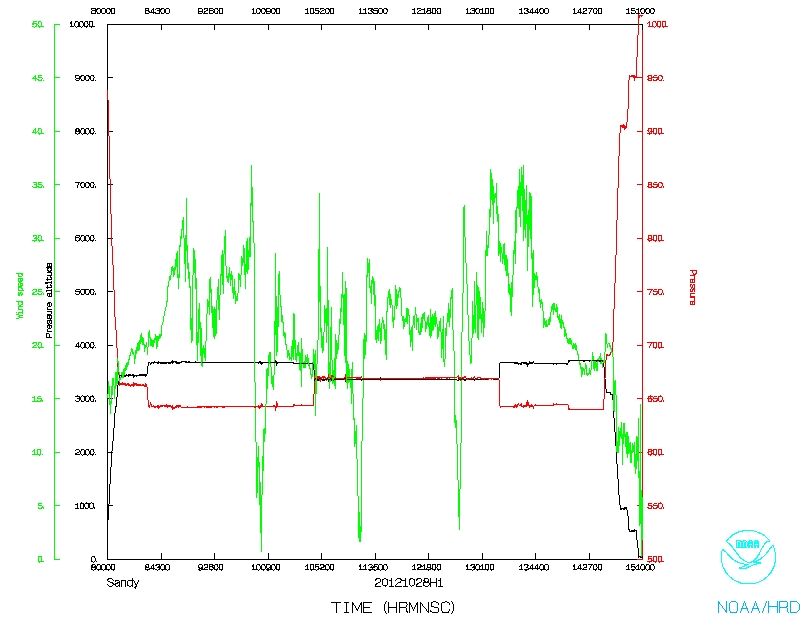 Wind and Atlitude |
Flight Director's manifest |
Flight Director's Log |
LPS forms |
Radar forms |
Dropsonde forms
1 Second data |
NetCDF file |
SFMR data
| Time (GMT) | Event |
| 0758 | take off MacDill AFB - IWRAP on with LF wedge |
| 0903 | entering outer rainbands 120 nm SW of center - nice scatterers on radar |
| 0912 | passing through numerous rainbands SW of center - good Doppler coverage |
| 0943 | approaching initial point 100 nm south of center. LF shows partial eyewall crescent on W side of eye |
| 0946 | IP 100 nm S of center - combo drop #1 - not, not much rain here - bad AXBT |
| 0956 | combo drop #2 - passing to right of major cell in eyewall SSW of center - eye diameter~60 nm |
| 0958 | passing abeam of intense cell in S eyewall with tops >15 km |
| 1003 | center - combo drop #3, dropsonde bad, 31° 46', 73° 27', motion 040° |
| 1005 | back up center dropsonde - 957 mb |
| 1015 | entering N eyewall - combo drop #4, AXBT bad - graupel briefly at 12000 ft, T=+7°C |
| 1029 | punching lines of small cells just reaching our altitude - nice bumps |
| 1030 | point 2, 120 nm N of center, turn TK 240 to point 3 combo drop #5 - just inside major band |
| 1046 | descend to 11000 ft to avoid graupel as we cut through major band with intense cells |
| 1049 | plowing through major rainband with cells 40-45 dBZ |
| 1055 | PT 3, turn TK 120 to center, combo drop #6 - SST 26.3, in heavy rainband 120 nm from center |
| 1059 | passing through big broad updraft (10 m/s) on inside edge of major rainband 100 NM NW of center |
| 1112 | combo #7 in NW eyewall, very heavy precip - big cell S of center rotated to E of center |
| 1123 | center dropsonde #8, 956 mb, 31° 54', 73° 15', tucked up close to big cell in E eyewall, eye open to E except for big cell |
| 1135 | midpoint combo #8 (drop#9) |
| 1144 | shut off LF radar for IWRAP circle |
| 1145 | PT 4, end leg 2 combo#9 (drop #10) |
| 1152 | end IWRAP circle TK 360 to point 5, LF back on, very dry this side |
| 1213 | PT 6 do IWRAP turn, LF off |
| 1219 | turn TK 240 to center combo drop#10 (dropsonde #11) SST 25.0°C, LF on |
| 1233 | midpoint combo#11 (drop #12) SST 25.3°C |
| 1239 | AXBT#12 SST 25.4°C entering open NE eyewall, big cell on E side last pass rotated around to NW of center |
| 1243 | center combo drop#13, SST 25.3,°C 31° 57', 72° 59', 955 mb, rainband associated with big cell trying to wrap around the center inside Eyewall (like hub cloud) |
| 1254 | combo drop#14 AXBT bad, entering SW eyewall |
| 1302 | AXBT #15 SST 25.5°C, just outside eyewall and entering rainband SW of center |
| 1308 | point #7, combo drop#15 (AXBT#16) AXBT bad |
| 1313 | End leg #3, AXBT #17 bad |
| 1320 | AXBT#18 SST 25.4°C |
| 1359 | LF recording stopped |
| 1401 | stopped TA radar recording |
| 1604 | land |