Figure 1. Proposed track
| Aircraft Commander | Mark Nelson |
| Co-pilot | Cathy Martin |
| Co-pilot | Mark Sweeney |
| Navigator | Chris Sloan |
| Flight Engineer | Klippel |
| Flight Director | Jess Williams |
| Data Technician | Terry Lynch |
| Data Technician | Carl Newman |
| AVAPS | Jeff Smith |
| Electronics Technician | Bobby Peek |
| Lead Scientist | Rob Rogers (HRD) |
| Radar Scientist | John Gamache (HRD) |
| Observing Scientist | Ryan Torn (SUNY-Albany) |
| Guest | Kris Van Cleave (WJLA) |
| Guest | Mike Fiol (ABC Tampa) |
Mission Plan :
Fly TDR mission (Fig. 1) into Hurricane Sandy, which had weakened to tropical storm status this morning but has since reintensified to minimal hurricane status due to a burst of convection near the circulation center (Figs. 2-3). Fly a rotating figure-4 pattern, IP on the S side, leg lengths of 105 nm. End up on the NW side, consider extending the outbound leg to ~120-130 nm to better sample precipitation and wind field on the coastal side. Fly at 12,000 ft, drop GPS sondes at all end and mid-points, AXBT's also at all these points. Drop sondes only on the first and last center passes.
Sandy continues to struggle with very dry air around the south and east sides, with the primary precipitation band at a large radius on the NW side (Figs. 2-3). Southwesterly and southerly shear is also still impacting the system (Fig. 4). A cold front is approaching the storm from the W, which is likely going to trigger more significant rain in advance and to the west of the storm.
|
(a) |
(b) |
|
(a) |
(b) |
Mission Summary :
| Take off | Landing
| MacDill AFB, FL | 20:00 UTC
| MacDill AFB, FL | 03:16 UTC
| | ||
Takeoff was at 2000 UTC. The pattern was flown as planned (Fig. 5). The storm is experiencing strong shear from the SW and dry air on that side too. Precipitation was spiraled around the storm, with the head of the spiral at the low-level center, then banded precipitation in the NW side with two convective bands separated by about 20 nm, wrapping around to the NE, E, and SE sides while spiraling outward. The storm seems better organized, at least in terms of the precipitation coverage and vortex alignment (Fig. 6). Vertical cross sections (not shown) showed a clear pattern of a sheared vortex from the W-E; other passes showed the vortex well-aligned up to ~4 km, tilting above 5 km toward the N (third pass), and aligned up to 7 km on the fourth pass. The strongest winds were on the S side, not the NW side.
|
(a) |
(b) |
|
(c) | |
| Figure 6. (a) Composite of Doppler-derived wind speed (shaded, m/s) and vectors (m/s) at 1 km altitude for 121025H2; (b) As in (a), but for 4 km; (c) As in (a), but for 7 km. Dropsonde measurements at same level also indicated. | |
The aircraft completed its mission and landed at MacDill AFB at 0316 UTC.
Mission Evaluation:
The mission was successful. A good dataset was collected, with good Doppler coverage revealing many interesting features, including a vortex in shear and transitions between tilted/displaced centers and realignment. All of the sondes worked; most BT's worked.
Problems :
No major problems. About 20% of BT's did not work. A total of 21 GPS sondes and 18 AXBT's were dropped.
Rob Rogers
Nov.1, 2012
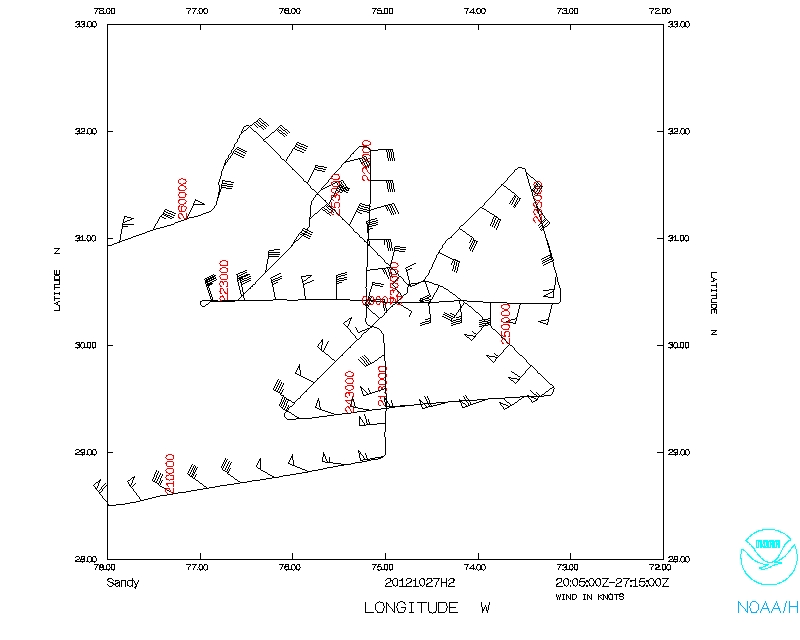 Flight track |
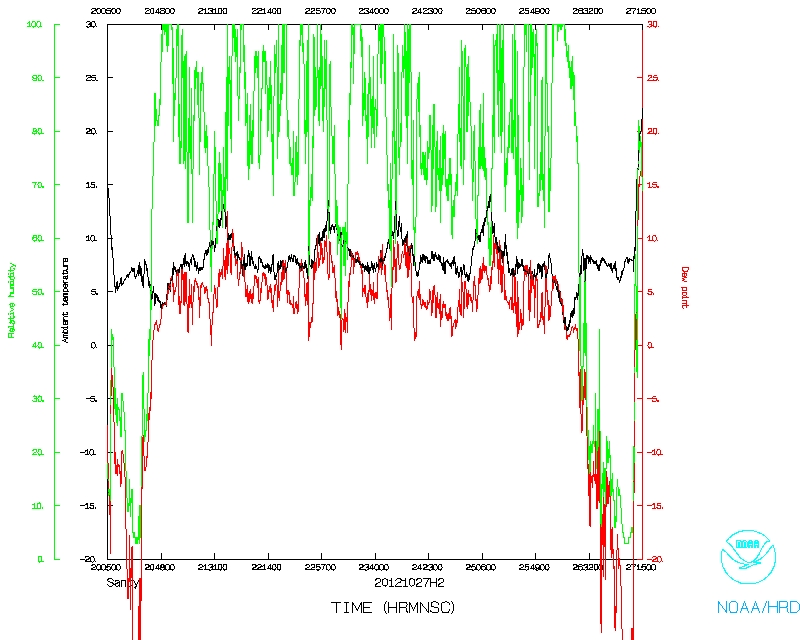 Temperature and Moisture |
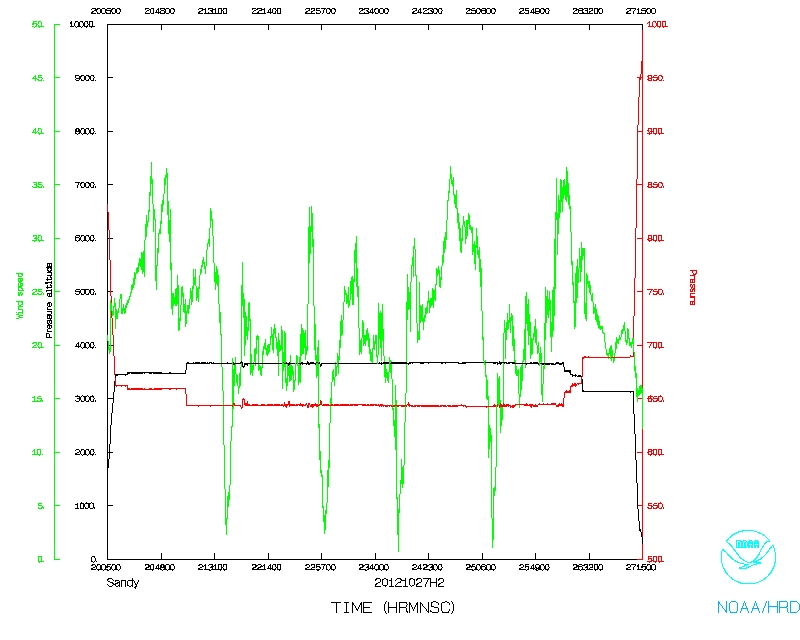 Wind and Atlitude |
Flight Director log | Flight Director's manifest | LPS log | Radar log | Drop log |
Serial data | 1 Second data | NetCDF | Fast data | SFMR data
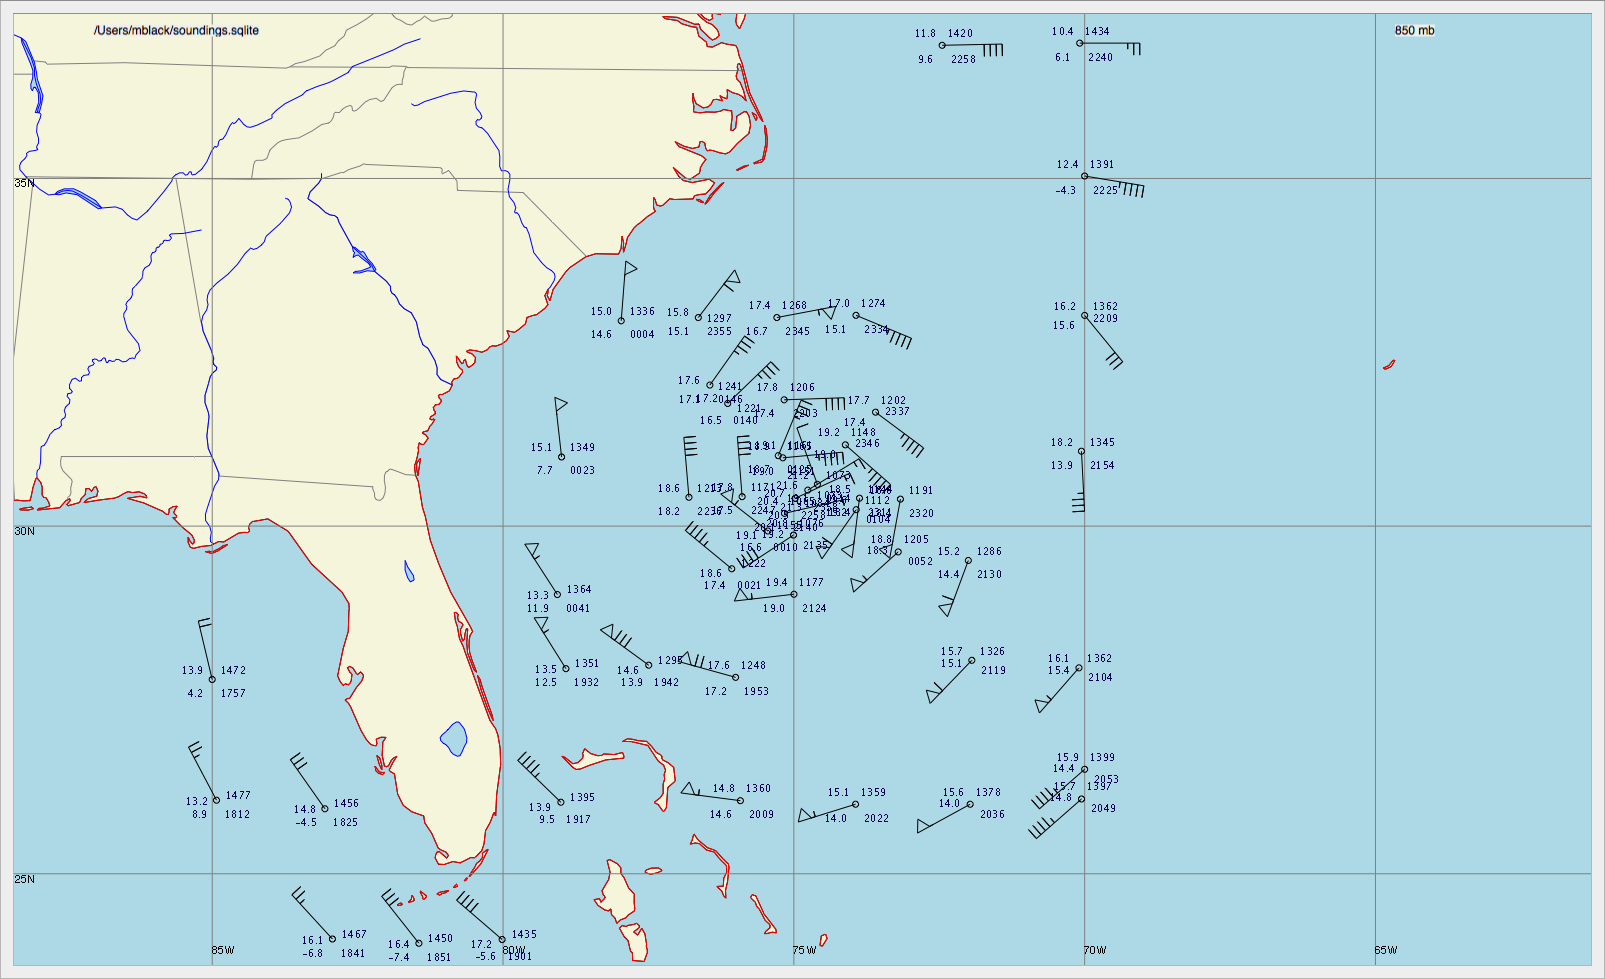
Combined drops from P3 and G-IV missions at 850 mb
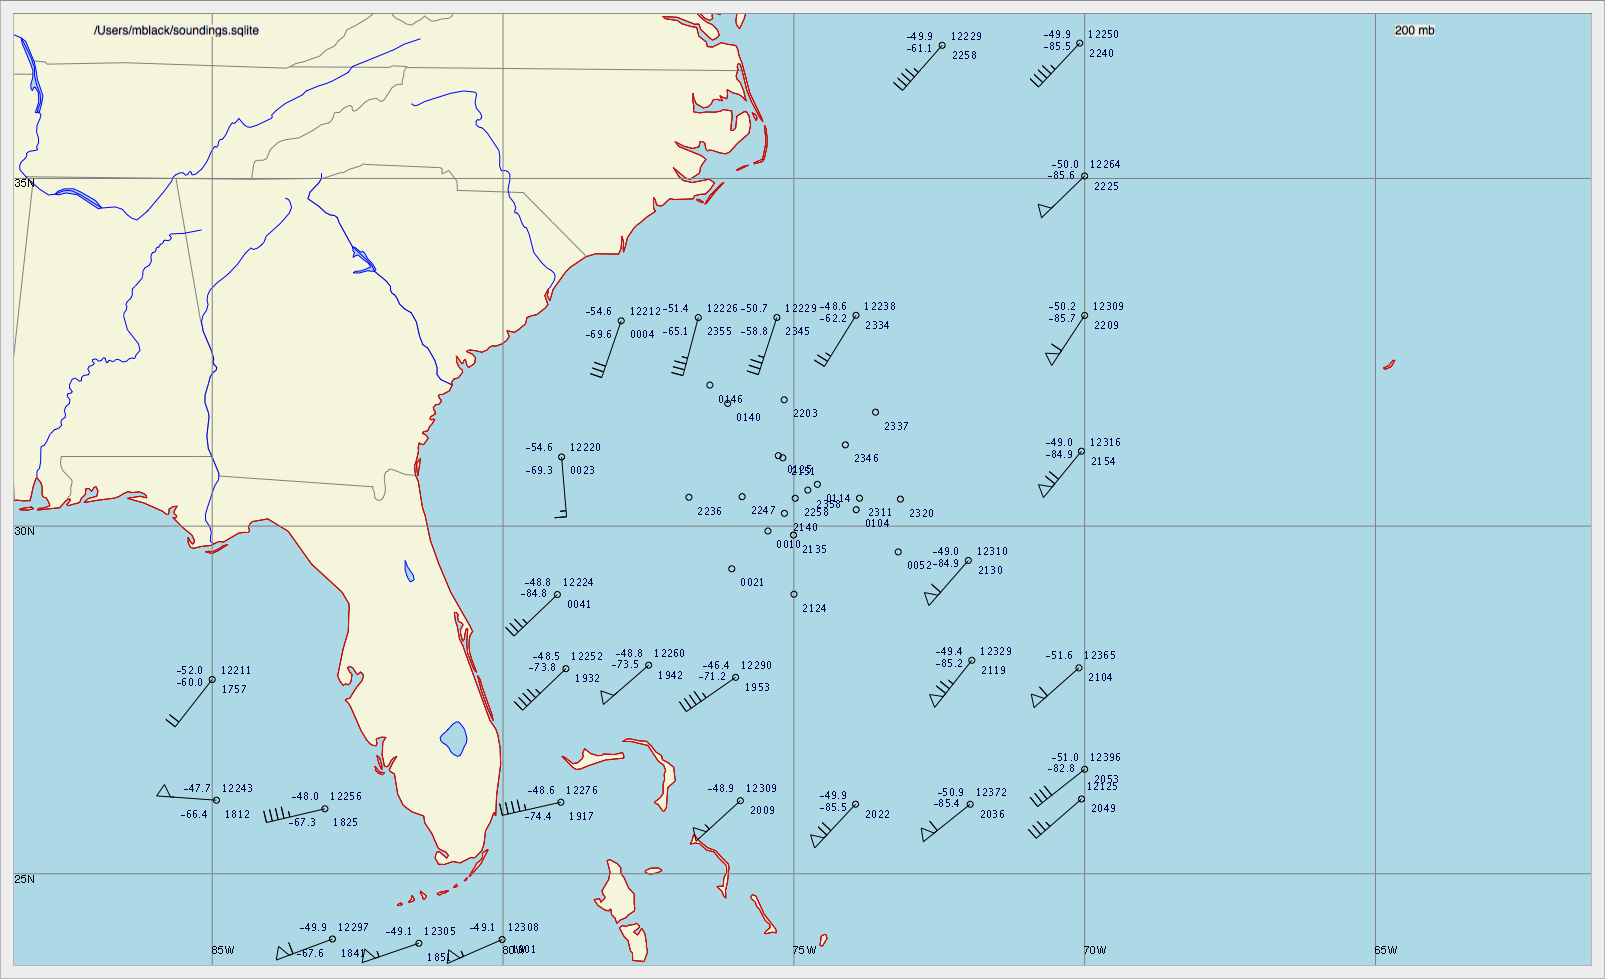
Combined drops from P3 and G-IV missions at 200 mb