Figure 1.Proposed track
| Aircraft Commander | Mark Nelson |
| Co-pilot | Cathy Martin |
| Co-pilot | Mark Sweeney |
| Navigator | Chris Sloan |
| Flight Engineer | Joe Klippel |
| Flight Director | Ian Sears |
| Data Technician | Terry Lynch |
| Data Technician | Jeff Newnam |
| AVAPS | Jeff Smith |
| Electronics Technician | Bobby Peek |
| Lead Scientist | Rob Rogers (HRD) |
| Radar Scientist | John Gamache (HRD) |
| Observing Scientist | David Zelinsky (NHC) |
| Observer | Phil Manougian (AOC) |
| Observer | Brian Smith (USAF) |
| Guest | Charlie Greacen (Media) |
Mission Plan :
Fly TDR mission (Fig. 1) number 3 into Hurricane Sandy. It is a rotating figure-4, with the IP on the W side, final point on the NE side. Once at the FP, fly downwind 45 degrees for a final inbound leg to the S, then exit out the W for a total of five penetrations. Drop combo GPS/BT's at all endpoints and midpoints, sonde only on the first and last center pass. Fly at 12,000 ft altitude. The storm is looking less organized, with strong SW vertical wind shear on the west side of the circulation (Fig. 2) and an exposed low-level circulation with precipitation only on the NW side (Figs. 3-4).
|
(a) |
(b) |
|
(a) |
(b) |
Mission Summary :
| Take off | Landing
| MacDill AFB, FL | 20:17 UTC
| MacDill AFB, FL | 03:55 UTC
| Penetrations
| 5
| | ||||
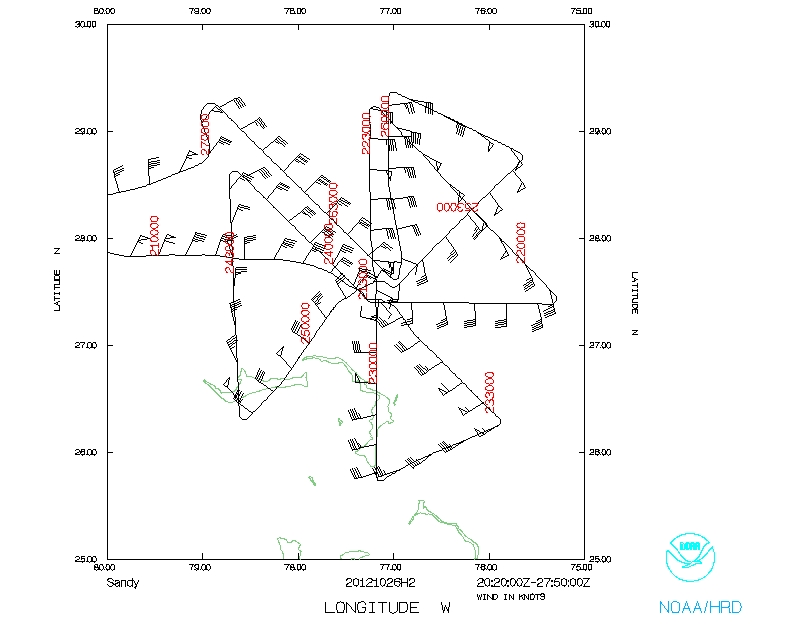
Takeoff was at 2017 UTC. The pattern was flown as planned (Fig. 5) except, on the fifth pass, we descended to 10,000 ft for a fix request by NHC. We also extended the outbound leg to the NW to ~145 nm to better sample the precipitation and wind fields. The storm appears to be transitioning to an extratropical cyclone. It is void of precipitation on the south and east (Fig. 6). The vortex appears tilted from the S to the N. There is an asymmetric wind field, with ~10 m/s variation in the flight-level winds from the W to the E sides. The peak SFMR winds were about 30-35 m/s on the NW side; the central pressure from three drops held steady at 972 hPa.
The aircraft completed its mission and landed at MacDill AFB at 0355 UTC.
|
(a) |
(b) |
|
(c) |
Mission Evaluation:
The mission did meet its objectives. Although the storm was highly asymmetric and convection was limited, we were able to create some analyses, especiall on the NW side. Sondes all worked well, and the AXBT's largely worked, though a few did have suspiciously low SST's. The drops sampled the PBL thermodynamical structure in shear, and the Doppler will provide some context as well.
Problems :
No major problems, other than limited scatterers on the E and S sides. All sondes worked, most AXBT's worked. A total of 21 GPS sondes and 18 AXBT's were dropped.
Rob Rogers
Nov. 1, 2012
Mission Data :
 Flight track |
 Temperature and Moisture |
 Wind and Atlitude |
Flight Director log | Flight Director manifest | LPS log | Radar log | Drop log |
Serial data | 1 Second data | raw NetCDF | Fast data | SFMR data