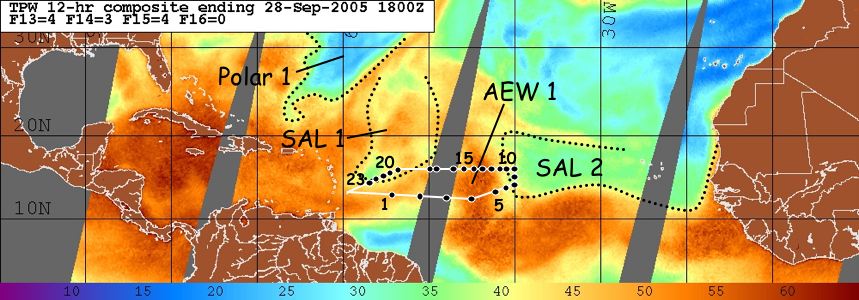
Fig. 1: Flight track (green line) for SALEX mission 20050928N1. The GPS dropsonde points (23 total) are indicated by green circles.
| Aircraft Crew (49RF) | |
| Aircraft Commander | Mark Fink |
| Pilots | Michele Finn Jeff Hagan |
| Project Manager | Jack Parrish |
| Flight Meteorologist | Paul Flaherty |
| Equipment Specialist | Gordon Kitson |
| Electronics Technician | Dave Brogan |
| Electronics Technician | Dale Carpenter |
| Electronics Technician | John Hill |
| Scientific Crew (49RF) | |
| Sonde Scientist | Jason Dunion |
Mission Plan :
NOAA 49RF will fly a Saharan Air Layer Experiment through an African easterly wave (AEW) and two SAL airmasses as part of IFEX. The G-IV will leave Barbados at 1445 UTC and will recover back at Barbados at 2045 UTC. The flight track will take the G-IV east through a recent Saharan Air Layer (SAL) outbreak, westward through an AEW axis (~47°W), and finally southwestward through the remnants of an older SAL outbreak. The flight track and 23 dropwindsonde points are shown in Fig. 1.
Mission Summary :
a) Synoptic Situation A large SAL outbreak moved off the African continent on 20 September and by the next day, had pushed as far west as ~30°W (Fig. 2a, SAL 1). An AEW closely followed this SAL outbreak, emerging from the coast of North Africa on 22 September (Fig. 2b, AEW 1). As AEW 1 moved across the basin over the next several days, its northwest heading brought it into the SAL and it struggled to intensify (Fig. 2c & d). The previous day's mission (20050927n1) sampled two distinct SAL airmasses and the relatively moist environment of an AEW positioned between them. The 20050928n1 mission presented an opportunity to sample changes in these SAL airmasses and the environment of the AEW. It also provided an opportunity to sample a convective area (associated with the AEW) that was likely being enhanced along the leading edge of the more recent SAL 2 outbreak (moist tropical air being lifted by relatively denser, dry SAL air).
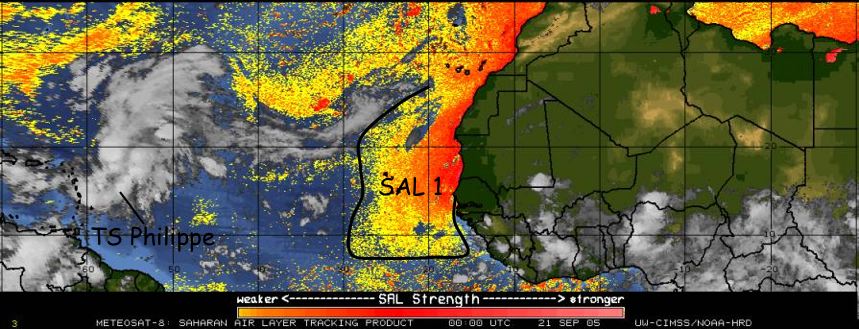
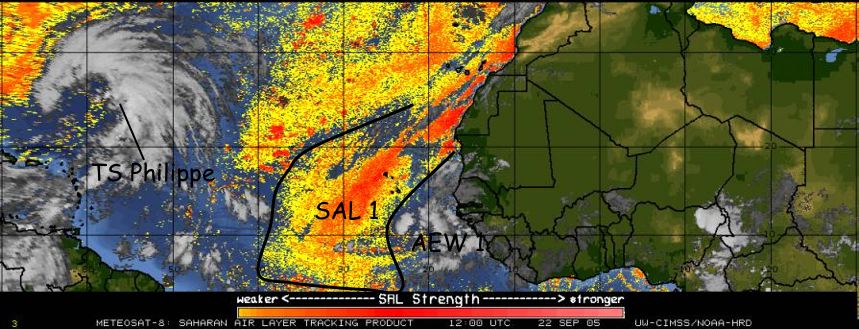
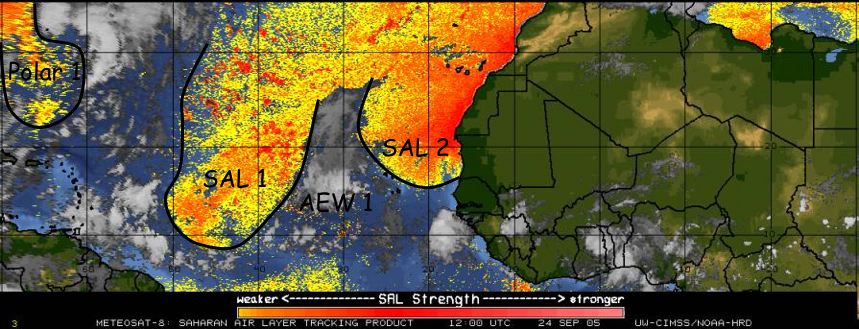
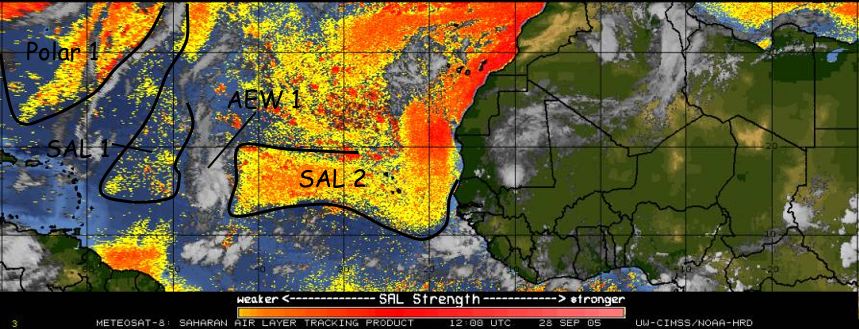
Fig. 2: Meteosat-8 SAL imagery (21-28 September 2005) showing two large
SAL outbreaks (SAL 1 & 2) separated by an AEW (AEW 1). A region of dry
polar air (Polar 1) is also indicted in the bottom two panels. Yellow to
red shading indicates areas of dry (and possibly dusty) air in the lower
to middle troposphere (~600-925 hPa).
On the morning of the 20050928n1 mission, the AEW axis was located at ~47°W and fairly deep convection (-60 to -70°C cloudtops) was oriented north-south along this longitude (Fig. 2d). A 'newer' SAL outbreak (SAL 2) was positioned just east of this convective area and was likely enhancing the local convection. By takeoff time, the cloudtops in this area had warmed significantly (~-50°C), as anticipated with the passing of the diurnal maximum. The flight track was therefore drawn to pass directly over the top of this convective area. b) Mission Specifics The flight pattern was designed to investigate several specific areas (Fig. 3):
Takeoff was at 1445 UTC from Barbados. The flight plan called an optimal flight level of 41,000-45,000 ft and required that all dropwindsondes be transmitted in real-time, so that the humidity data from the sondes could be included in parallel runs of the NOAA GFS model. The initial flight pattern involved a long west-east leg from Barbados across the axis of an AEW (AEW 1). Dropwindsondes across this leg (drops 1-4) showed that the middle to upper troposphere (~200-500 hPa) was quite dry (~5-30% RH). However, the ~500 hPa to surface layer was quite moist. The next few dropsondes (drops 5-7) sampled the transitional environment across the leading edge of a more recent SAL outbreak (SAL 2) and showed that the lower to middle troposphere was becoming quite dry as the G-IV was crossing into the environment of SAL 2. The next several dropsondes (drops 7-11) indicated that:
The final sequence of dropwindsondes (drops 19-23) sampled the environment out ahead (west) of the AEW. Satellite imagery from GOES and TPW imagery from the constellation of SSM/I satellites indicated that this area contained remnants of an 'older' SAL outbreak (SAL 1) that was modifying (moistening) fairly quickly in recent days. However, several dropsondes (e.g. drops 22 & 23) showed that this air still contained dry air in the lower to middle levels (~5-30% RH from 550-750 hPa).
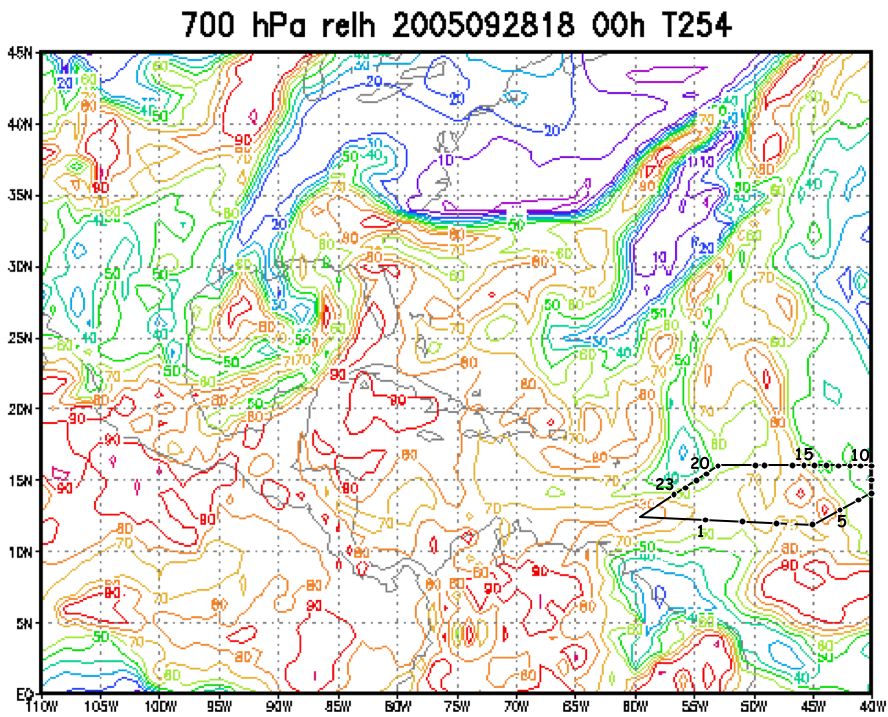
It is interesting to note that the GFS model was analyzing considerably higher 700 hPa RH values than were observed by dropwindsondes launched during this mission (Fig. 4):
Problems :
There were no major problems related to this flight. The vintage 2000 GPS dropsondes that were used did, however, have a moderate failure rate (~18% or 5 failed dropwindsondes out of 28 deployed).
Jason Dunion
Principal Investigator
|
Aircraft: N49RF Altitude: FL410-450 Takeoff: 28/1445Z | |||
| Drop # | Lat (degrees) | Lon (degrees) | UTC time |
| 1 | 12.768 | 54.010 | 1531 |
| 2 | 12.547 | 50.998 | 1555 |
| 3 | 12.291 | 48.004 | 1620 |
| 4 | 12.011 | 45.002 | 1646 |
| 5 | 13.020 | 42.500 | 1709 |
| 6 | 13.609 | 41.003 | 1722 |
| 7 | 14.034 | 40.043 | 1731 |
| 8 | 15.002 | 40.000 | 1740 |
| 9 | 15.987 | 40.127 | 1748 |
| 10 | 16.029 | 41.019 | 1755 |
| 11 | 16.054 | 42.021 | 1803 |
| 12 | 16.075 | 43.028 | 1811 |
| 13 | 16.090 | 44.000 | 1818 |
| 14 | 16.100 | 45.003 | 1826 |
| 15 | 16.104 | 45.997 | 1834 |
| 16 | 16.103 | 47.005 | 1842 |
| 17 | 16.087 | 49.001 | 1858 |
| 18 | 16.072 | 50.003 | 1906 |
| 19 | 16.014 | 53.014 | 1930 |
| 20 | 15.572 | 53.996 | 1939 |
| 21 | 15.005 | 55.297 | 1951 |
| 22 | 14.651 | 56.105 | 1959 |
| 23 | 14.165 | 57.201 | 2009 |