Mission Summary
20081107N1 Aircraft 49RF
Paloma Rapid Intensity flight 2008
Aircraft Crew (49RF)
| Aircraft Commander | Michelle Finn |
| Flight Director | Jackie Almieda |
| LPS/Dropsonde Scientist | John Kaplan |
only G_IV track
|
G_IV and P-3 tracks
|
Mission Plan :
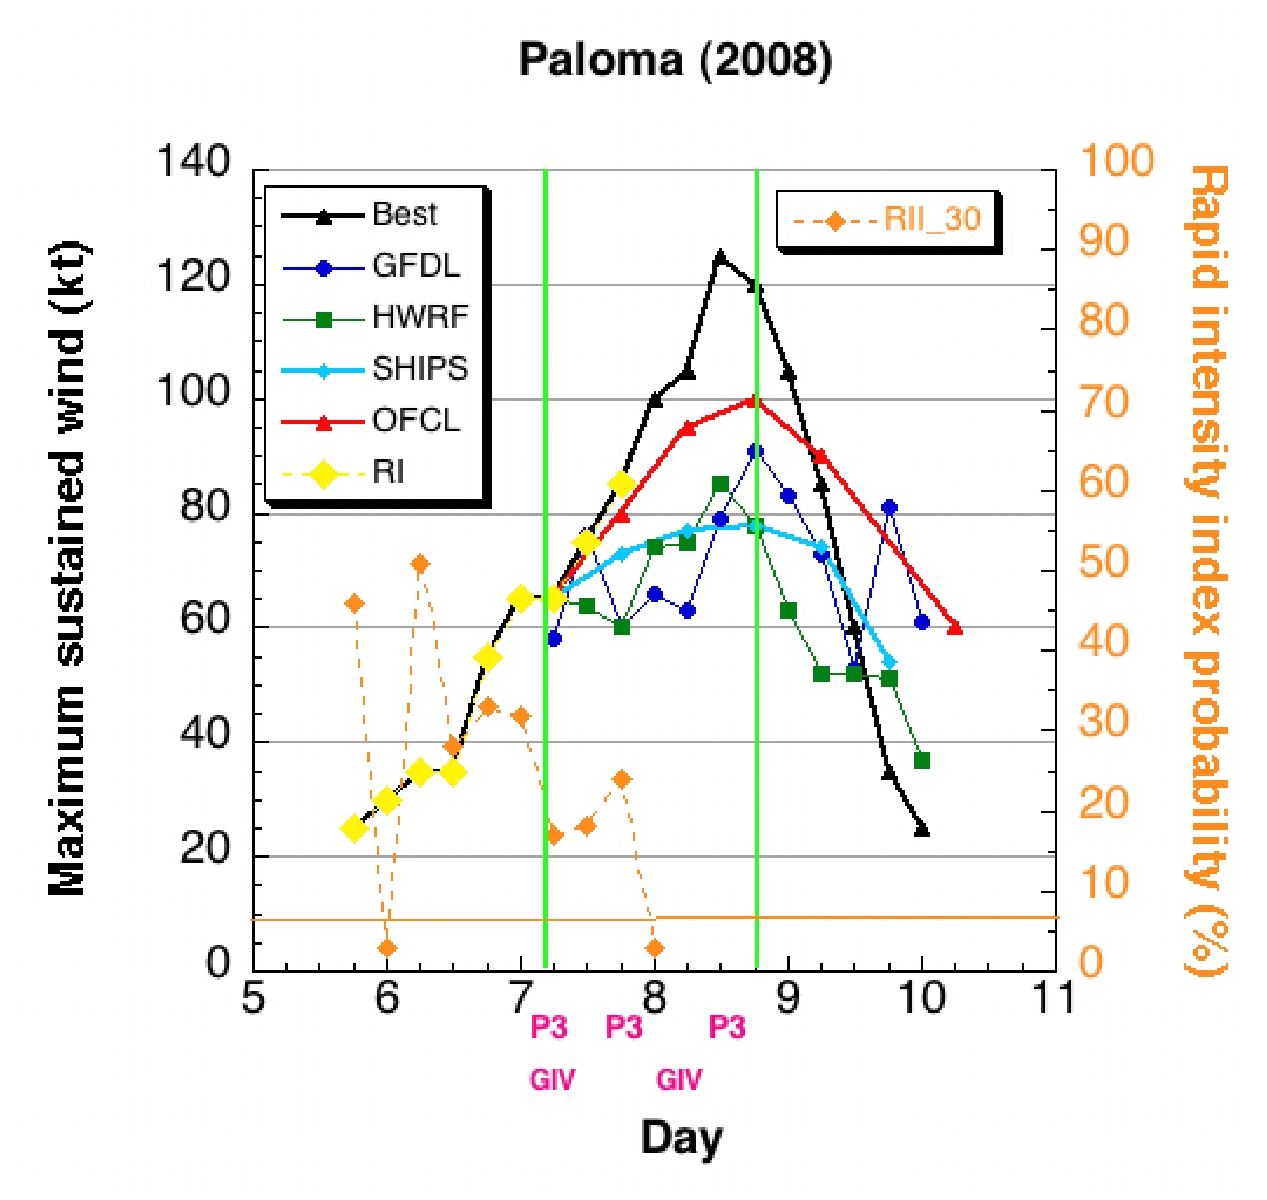
Figure 1. Plot of the intensity forecasts of the operational
intensity models (GFDL,HWRF, and SHIPS) as well as the NHC official
forecast (OFCL) for 0600 UTC 7 November. Also shown are the RI index
probabilites of RI (dashed orange lines) every 6 h and the climatological
probability of RI (solid orange lines.) The NHC operational intensity
estimates are shown in black. The yellow diamonds indicate the time
that each 24-h period of RI commenced. The center times of the P-3
and G-IV missions are designated by the pink letters.
The goal of this experiment was to fly coordinated P-3 and G-IV aircraft
missions to capture the rapid intensification (RI) phase of a mature
tropical cyclone. Figure 1 shows a summary of the relevant information
regarding the Paloma experiment. The NHC best track intensity trace
(black) shows that Paloma intensified most rapidly commencing at around
0600 UTC on 7 November when the first G-IV and P-3 missions were being
flown. It can be seen that none of the operational intensity models
forecasted rapid intensification for the 0600 UTC 7 November forecast
cycle. Also, while the RI index probability of RI (dashed orange line)
was about 3 to 4 times the climatological average of 7% (solid orange
line), it was lower than it had been earlier in the time period, suggesting
that the overall conditions had become somewhat less conductive than they
were earlier. Interestingly, the official NHC forecast (red line) did
call for a 30 knot increase in 24 h, which does qualify as RI using the
Kaplan and DeMaria (2003) definition. However, even this forecast was
too low.
This G-IV research mission flight plan was designed to obtain symmetric
data coverage in Paloma's near storm environment by dropping sondes at
23 locations (see below) between 2-4 ° radius of Paloma's center
while the P-3 was flying in a coordinated pattern within about 1.25 °
of Paloma's center collecting radar data, dropping dropsondes and AXBTs.
Drop Plan
Paloma
Prepared by the Hurricane Research Division
Aircraft: N49RF
Altitude: FL410-450
Proposed takeoff: 07/0200Z
|
DROP
#
| LAT
(d m)
| LON
(d m)
| RAD/AZM
(nm/dg)
| LEG
(nm)
| TOTAL
(nm)
| TIME
(h mm)
|
| MACDILL | | 0. | 0. | 0:00
|
| 1 | 22 00 | 86 30 | | 413. | 413. | 0:57
|
| 2 | 20 00 | 87 00 | | 123. | 537. | 1:15
|
| 3 | 18 00 | 87 30 | | 124. | 660. | 1:33
|
| 4S | 16 36 | 87 04 | 240/270 | 88. | 748. | 1:46
|
| 5S | 17 44 | 85 48 | 180/292 | 99. | 847. | 2:00
|
| 6S | 16 36 | 84 59 | 120/270 | 83. | 930. | 2:12
|
| 7S | 14 36 | 82 54 | 120/180 | 170. | 1100. | 2:36
|
| 8S | 12 46 | 82 54 | 230/180 | 110. | 1210. | 2:52
|
| 9S | 13 51 | 81 41 | 180/157 | 96. | 1306. | 3:06
|
| 10S | 13 47 | 79 58 | 240/135 | 100. | 1406. | 3:21
|
| 11S | 15 11 | 81 26 | 120/135 | 120. | 1526. | 3:38
|
| 12S | 15 29 | 80 01 | 180/112 | 84. | 1610. | 3:51
|
| 13S | 16 36 | 78 44 | 240/090 | 100. | 1710. | 4:05
|
| 14S | 16 36 | 80 49 | 120/090 | 120. | 1830. | 4:22
|
| 15S | 18 01 | 81 26 | 120/045 | 92. | 1922. | 4:36
|
| 16S | 17 47 | 80 01 | 180/067 | 82. | 2004. | 4:48
|
| 17S | 19 27 | 79 57 | 240/045 | 100. | 2104. | 5:03
|
| 18S | 20 36 | 82 54 | 240/000 | 180. | 2285. | 5:28
|
| 19S | 18 36 | 82 54 | 120/000 | 120. | 2404. | 5:45
|
| 20S | 18 01 | 84 22 | 120/315 | 91. | 2495. | 5:59
|
| 21S | 19 22 | 85 09 | 210/322 | 92. | 2588. | 6:12
|
| 22 | 22 00 | 85 06 | | 158. | 2746. | 6:35
|
| MACDILL | | 379. | 3125. | 7:53
|
Mission Summary :
The jet left MacDill AFB, FL at 02:00 UTC. The flight plan was executed as
designed, although the storm was east of the forecast position and thus the
radial coverage on the east side was perhaps a little less than originally
planned.
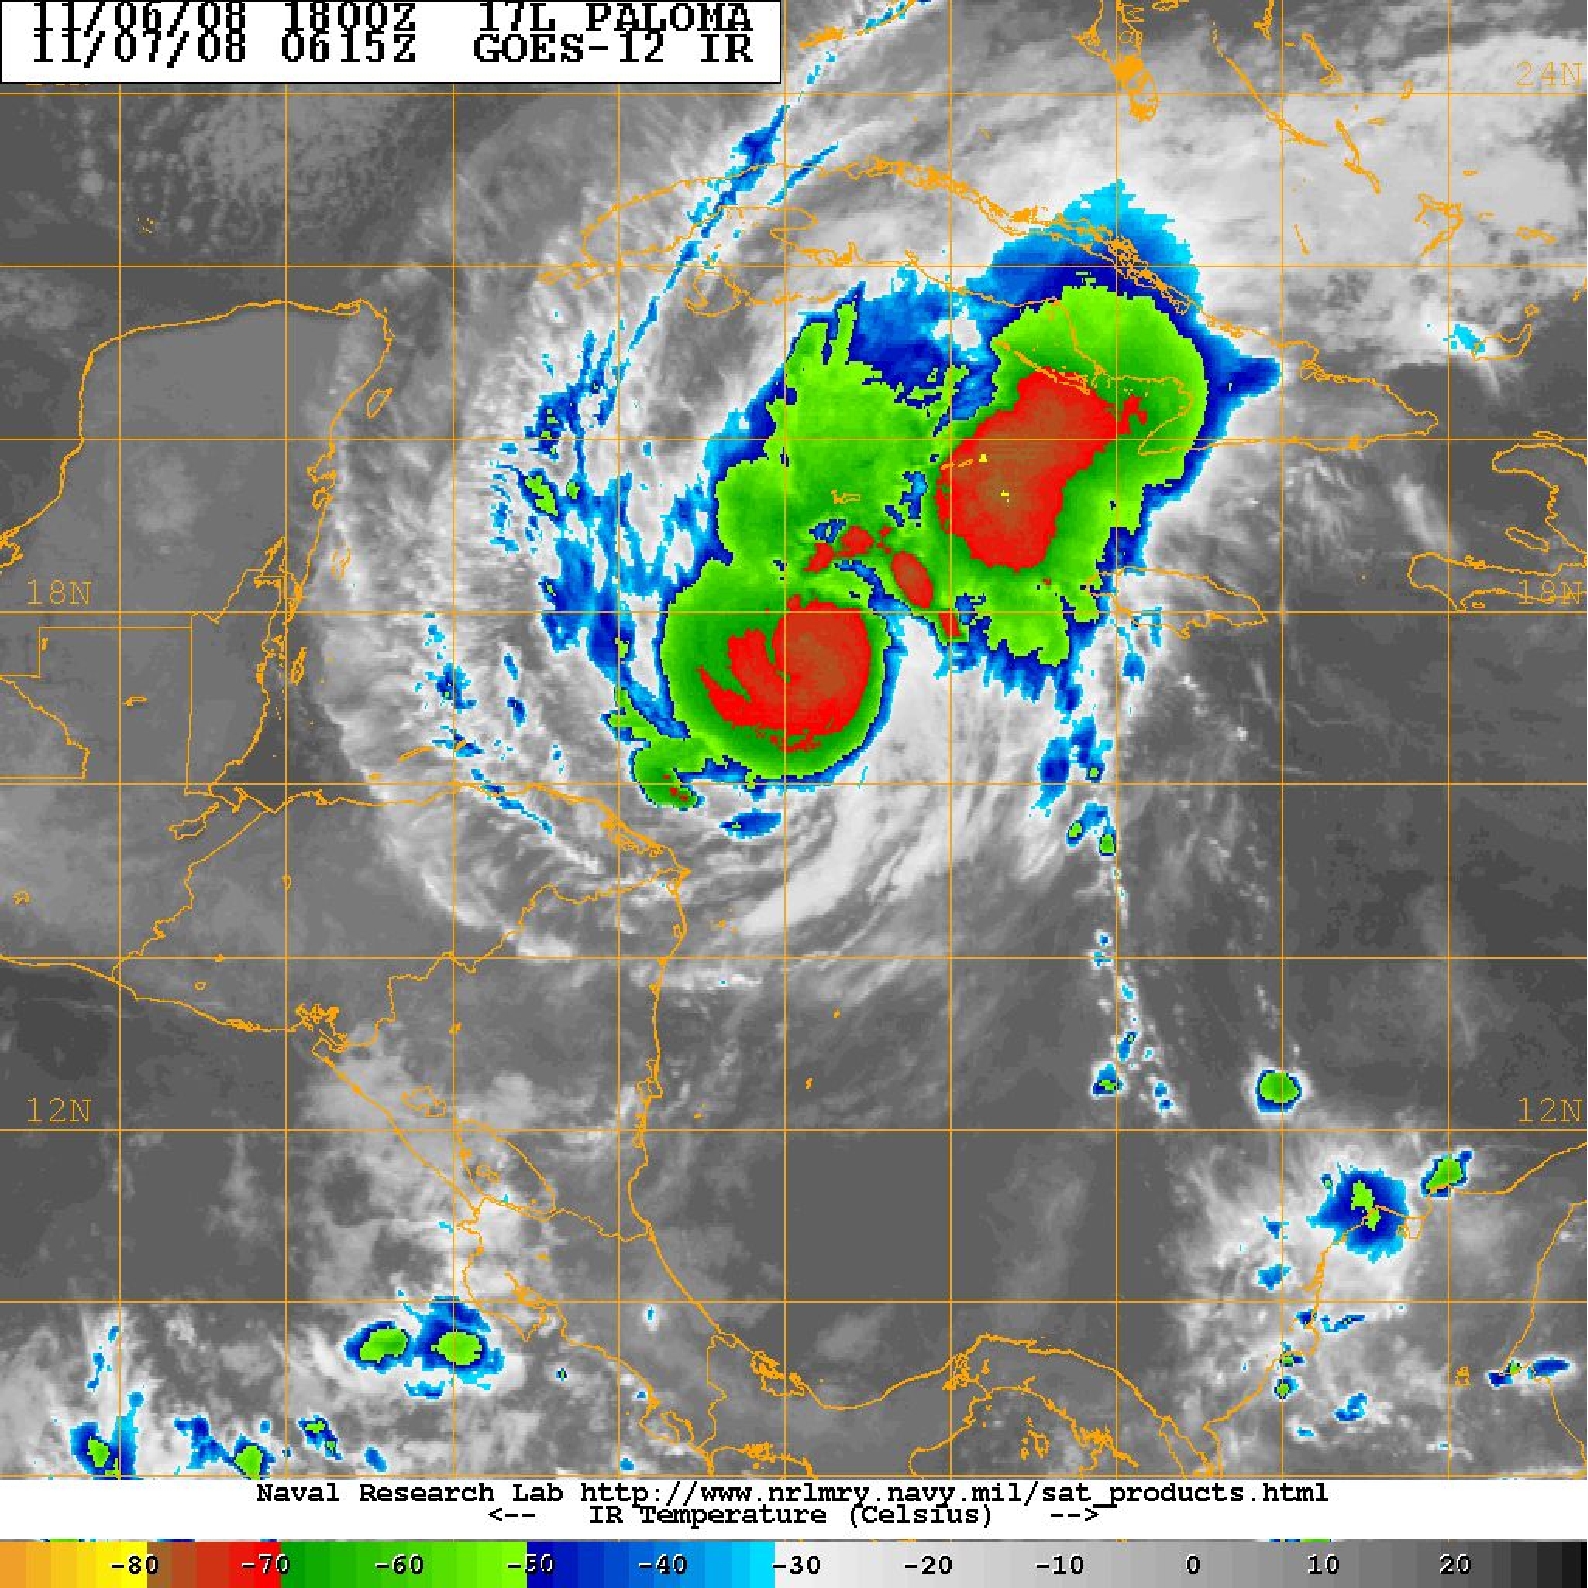
Figure 2. Naval Research Laboratory GOES IR deptiction of Paloma at
0615 UTC 7 November.
Paloma was a minimal hurricane with a central pressure of 985 mb and maximum
sustained winds of 65 kt at the nominal time (0600 7 November) of the G-IV
mission. The 200 mb G-IV data indicate that a fairly good anticyclone had
been established over Paloma and, indeed, the SHIPS data show that the
200-850 mb shear was 9 kt and 200 mb divergence was 73 x 107
s-1 both of which are considered farily conductive for rapid
intesification. Never-the-less, GOES IR imagery from 0615 UTC (Fig. 2)
on the 7th indicates that Paloma was still somewhat asymmetric at this
time.
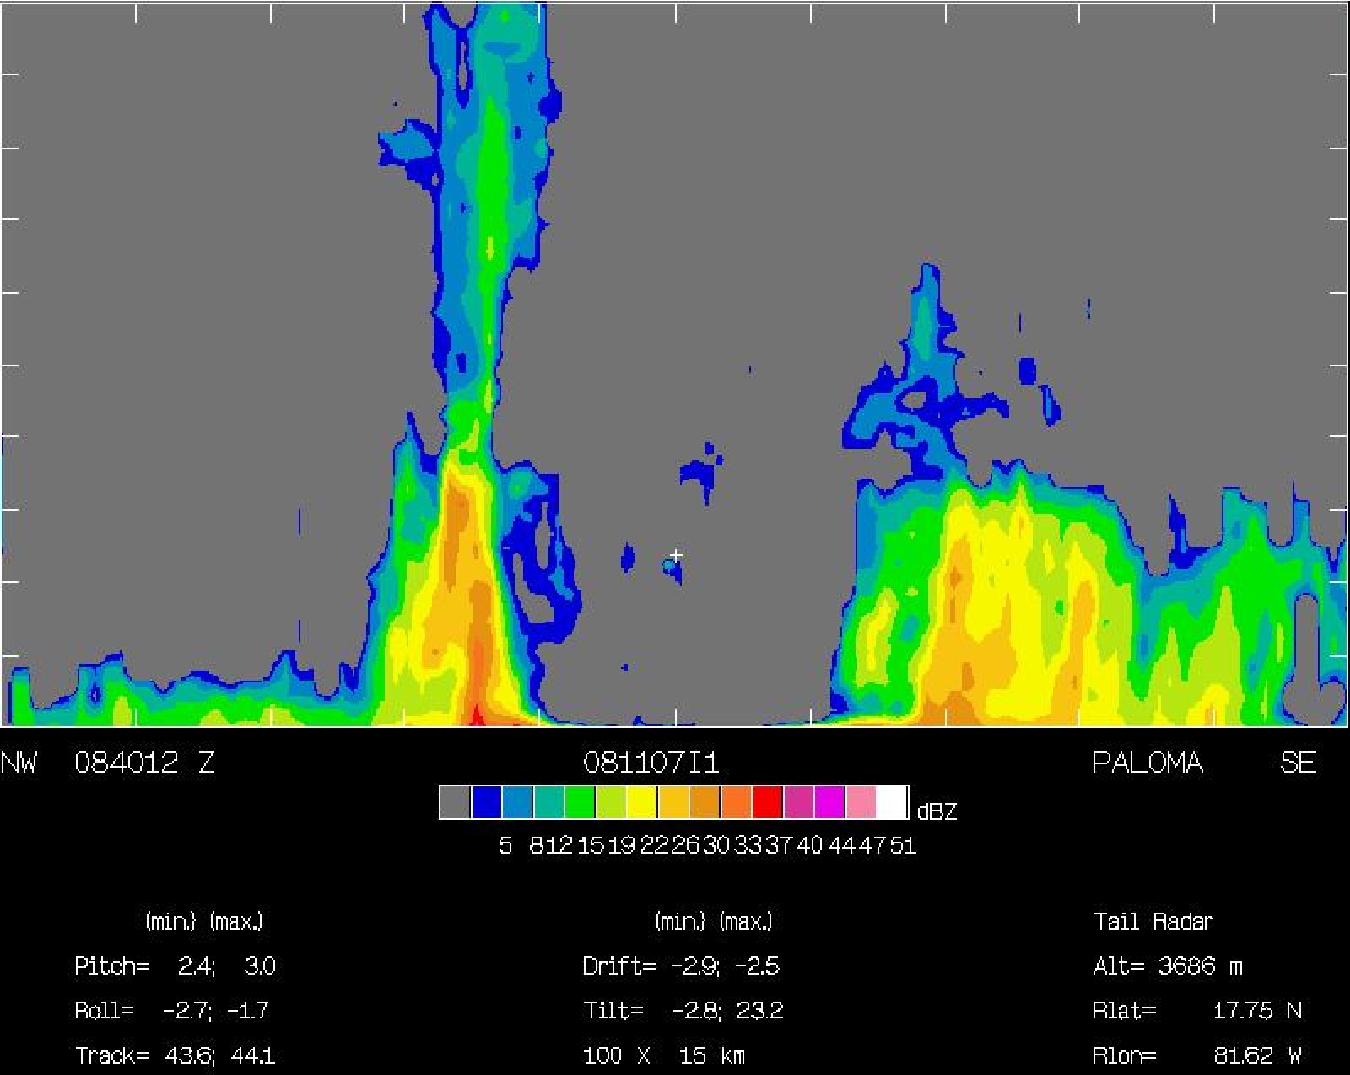
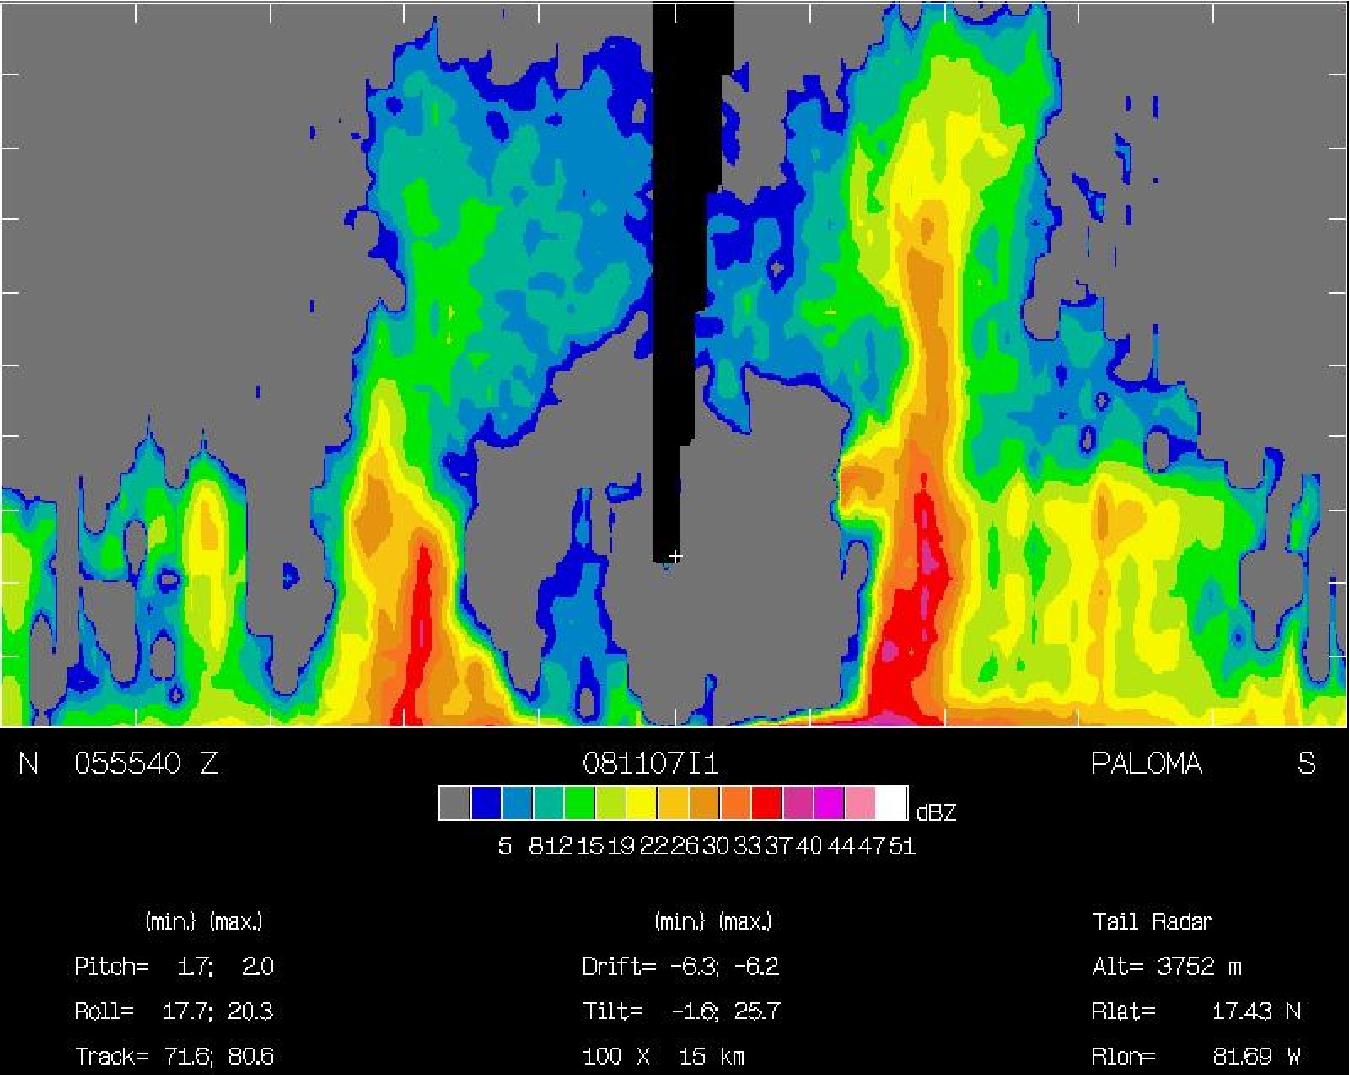
Figure 3. NOAA P-3 tail radar cross-section plots of Paloma at
0554 UTC (top) and 0839 UTC (bottom) on 7 November. The cross-section
at 0554 UTC is from north to south while the 0839 UTC cross-section is
northwest to southeast. (Figure courtesy of Michael Black)
Interestingly, Paloma remained at the same intensity from 00 to 06 UTC on
the 7th, which represents the only 6 h time period up to the time of landfall
when Paloma wasn't intensifying. The G_IV data suggest that the temporary
halt in Paloma's intensification may have been the result of the injection of
some mid-level dry air as indicated by the 500 mb and 700 mb plots shown
below. The potential impact of the dry air on Paloma is consistent with the
P-3 radar imagery (Fig. 3) for this time period which indicate that the
radial and vertical extenet of the convection on the west side of the storm
is less than it is on the east side of the storm. Never-the-less, a comparison
of the 0554 and 0839 UTC P-3 lower fuselage radar plots (Fig. 4) suggest that
Paloma's convective sturcture was becoming better organized toward the later
portion of the flight, which is consistenet with Paloma's increase in
intensity to 75 kt by 1200 UTC on the 7th.
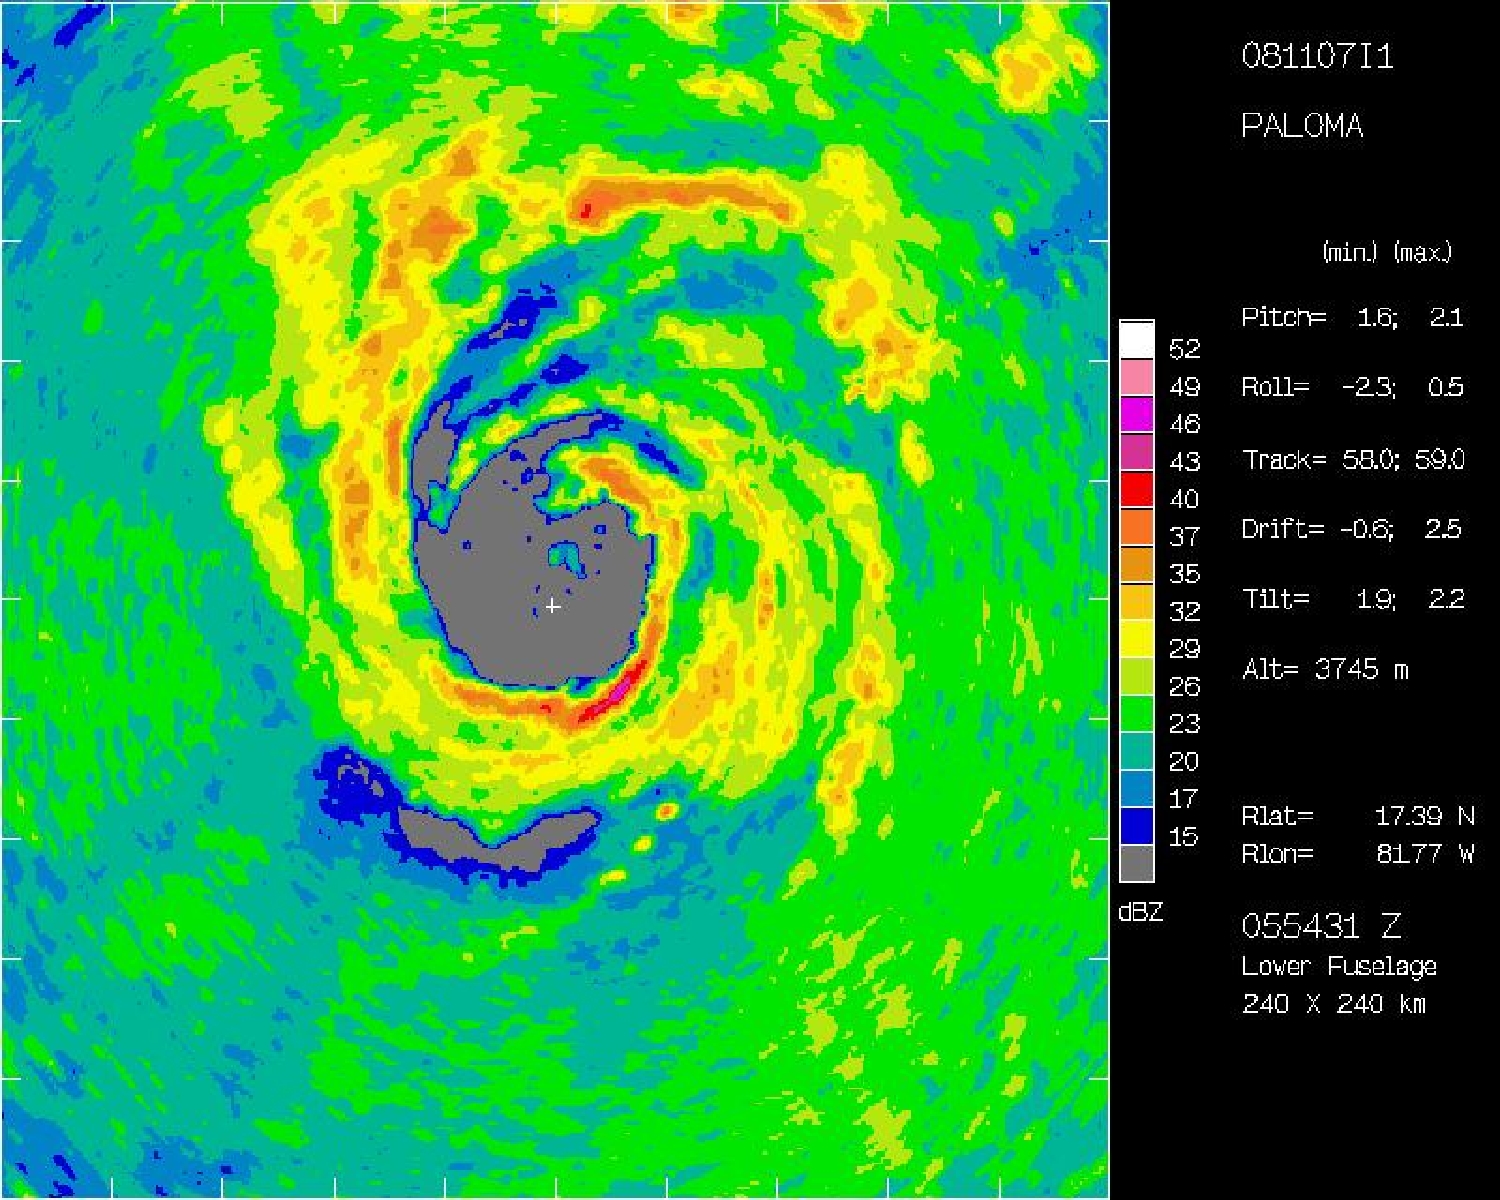
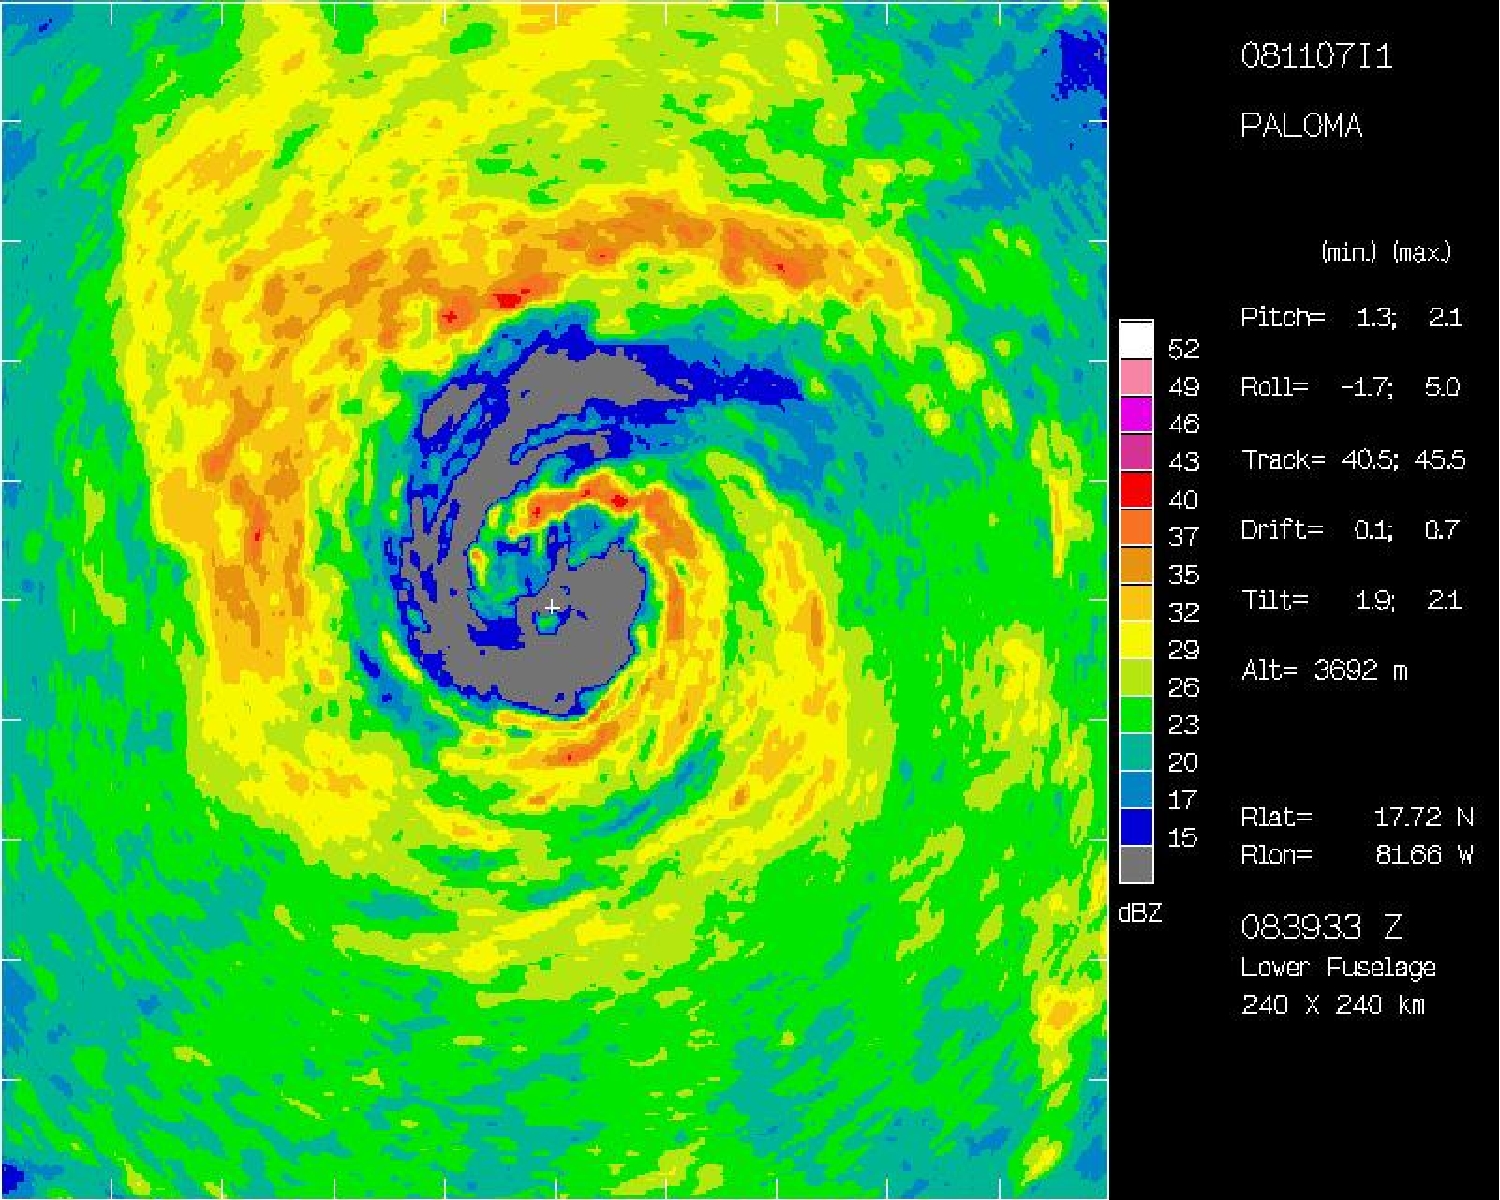
Figure 4. NOAA P-3 lower fuscelage radar depiction of Paloma at
0554 UTC (top) and 0839 UTC (bottom) on 7 November. (Figure courtesy of \
Michael Black)
The G-IV recovered at MacDill AFB, FL by 11:00 UTC.
Problems :
The sondes worked failrly well and all 23 sondes were transmitted with no
back-up sonde launches required. There was one sonde that stopped transmitting
prior to reaching the surface and another that had no data below 500 mb. Also,
another sonde had no wind data from 300-600 mb which AOC crew attributed to
interference caused by lightning.
Mission Data :
Actual Drops in Paloma
Prepared by the Hurricane Research Division
Aircraft: N49RF
Altitude: FL410-450
Takeoff: 07/0200Z
|
DROP
#
| LAT
(d m)
| LON
(d m)
| PROPOSED
TIME
(h mm)
| COMMENTS
|
| 1 | 22 00 | 86 30 | 0:57 |
|
| 2 | 20 00 | 87 00 | 1:15 | Did not hit sfc
|
| 3 | 18 00 | 87 30 | 1:33 |
|
| 4 | 16 06 | 87 54 | 1:50 |
|
| 5 | 16 30 | 84 54 | 2:16 |
|
| 6 | 14 24 | 82 54 | 2:40 |
|
| 7 | 14 00 | 81 41 | 2:52 |
|
| 8 | 15 11 | 81 26 | 3:04 |
|
| 9 | 15 29 | 80 06 | 3:17 | No data below 500 mb
|
| 10 | 16 36 | 80 49 | 3:29 |
|
| 11 | 17 47 | 80 06 | 3:41 |
|
| 12 | 18 01 | 81 26 | 3:53 |
|
| 13 | 18 36 | 82 54 | 4:07 |
|
| 14 | 18 01 | 84 24 | 4:20 |
|
| 15 | 18 06 | 85 54 | 4:34 |
|
| 16 | 19 42 | 85 24 | 4:49 |
|
| 17 | 19 42 | 83 30 | 5:06 |
|
| 18 | 19 42 | 81 30 | 5:22 |
|
| 19 | 19 18 | 79 24 | 5:39 | No winds 300-600 mb lightning
|
| 20 | 21 00 | 79 30 | 5:54 | Dropped early
|
| 21 | 21 18 | 81 36 | 6:11 |
|
| 22 | 21 18 | 83 30 | 6:27 |
|
| 23 | 21 42 | 85 18 | 6:41 |
|
Dropsonde plots
100 mb
200 mb
250 mb
300 mb
400 mb
500 mb
700 mb
850 mb
925 mb
1000 mb
surface
Page last updated November 20, 2008
Return to Mission page.