Mission Summary
20031206I1 Aircraft 43RF
Extratropical Transition Experiment (ET)
into Odette 2003
Scientific Crew
| Lead Scientist | Peter Dodge
|
| Doppler Scientist | Matt Eastin
|
| Dropsonde Scientist | Neal Dorst
|
| AXBT Scientist | Joe Cione
|
| SFMR Engineer | Ivan Popstefanija
|
Aircraft Crew
| Pilots | CDR Phil Kennedy
LT Mike Silah
|
| Navigator | LT Devin Brakob
|
| Flight Director | Barry Damiano
|
| Flight Engineer | Steve Wade
|
| Engineer | Jeff Smith
|
| Technicians | Terry Lynch
Ray Tong
Damon SansSouci
|
Mission Plan :
This was planned as the second in a series of flights to capture the
evolution of Tropical Storm Odette, possibly into an extra-tropical
storm. Odette was forecast to be just making landfall during our
flight so a simple truncated figure 4 was planned to once again
sample the inner core. This pattern was adjusted so that we could
deploy AXBTs in some of the same spots as yesterday, to look at
changes in sea surface temperature and mixed layer depths.
Mission Summary :
NOAA 43 left Tampa at 1528 UTC, 6 October 2003, after a delay for some
engine maintenance. We dropped our first sonde near Great Inagua at
1708. At 1802 we noted a crescent shaped echo ~ 350 km SE of our
position, which was more echo structure than we had seen on Friday.
A rough estimate from the radar display put the center at 17.2 N,
71.9 W, close to the 1500 UTC position in the NHC discussion. At 1910
we dropped a sonde at our southern most point, ~ 100 nm due South of
the center. At 1930 we crossed a rainband as we tracked NE, ~90 nmi
east of the center. After turning and heading back west, we dropped a
sonde in the rain-band, where flight-level winds were 52 kts out of
the SSW. At 1950 we passed just North of the center, which Barry
estimated to be at 17.3 N, 71.8 W. The flight-level winds dropped
twice as we crossed this region. After we finished the east-west
leg we deployed 3 AXBTs in the same locations as on yesterday's flight.
We dropped our last sonde S of Cuba at 2057. NOAA 43 landed at MacDill
at 2318.
Evaluation:
Tropical Storm Odette was better organized on this flight with
circulation apparent at all levels and some weak rain-bands within
100 nmi of the center. We did not travel far enough east to sample
the main line of convection that stretched from the east end of
Hispañola all the way to the Colombian coast - but that would
have required another 2 h of flight time that we did not have.
Never-the-less the sonde and flight level-data should be sufficient
to describe the storm structure before it passed over the Dominican
Republic. The new pod-mounted SFMR winds agreed when compared with
GPS dropsonde surface winds. However, comparing the rainfall rate and
wind speeds between the old and new SFMRs reveal discrepancies that
will have to be addressed before the new SFMR can be considered the
"official" wind speed instrument. Matt Eastin is now fully trained
in radar and GPS sonde processing.
Acknowledgments:
Barry, Devin and the AOC crew once again dealt cheerfully with our
flight modifications, although I imagine they would rather have spent
their Saturday on the ground.
Problems :
- There was a problem getting the tracks again, this time because
the Internet was down on the base. Sim solved this by faxing the
tracks from the hotel to us.
- There were a few minor LF radar freezes, but the tail radar
data looked good, except that the dBZ still seem low.
Peter Dodge
Lead Scientist
Mission Data
One minute listing
Table 1
GPS Sondes
| Launch | # ID
| Time (UTC) | Lat | Lon
| RA | Comments
|
|
1 | 021925180 | 17:08:31.5 | 23.00240 | -76.00930 | 6106.7 m | Bahamas, clear below
|
|
2 | 011378060 | 17:42:53.4 | 21.00020 | -74.00800 | 5948.5 m
|
|
3 | 011378122 | 18:10:09.6 | 19.23060 | -73.70530 | 5941.9 m | Clear Below
|
|
4 | 033415179 | 18:43:06.2 | 17.47120 | -73.43070 | 5951.2 m
|
|
5 | 023418082 | 18:52:39.0 | 16.99000 | -72.74390 | 5940.1 m
|
|
6 | 023318061 | 19:10:19.2 | 16.00040 | -71.90880 | 5948.8 m
|
|
7 | 023318070 | 19:22:43.2 | 16.75000 | -71.11820 | 5940.1 m | No Winds
|
|
8 | 023535087 | 19:24:16.6 | 16.84710 | -71.01540 | 5942.1 m
|
|
9 | 011245434 | 19:36:04.2 | 17.55830 | -70.39410 | 5944.3 m
|
|
10 | 033415178 | 19:37:47.0 | 17.53390 | -70.52170 | 5938.3 m | In Rainband
|
|
11 | 011378116 | 19:47:36.8 | 17.49310 | -71.29000 | 5923.3 m
|
|
12 | 011378194 | 19:53:48.0 | 17.49360 | -71.77550 | 5918.4 m | Center, No Winds
|
|
13 | 003828018 | 19:55:05.1 | 17.49320 | -71.88200 | 5912.4 m
|
|
14 | 023318063 | 20:08:19.6 | 17.75090 | -72.84100 | 5944.4 m
|
|
15 | 003815300 | 20:37:19.9 | 18.48630 | -74.71360 | 5948.6 m
|
|
16 | 003815302 | 20:57:03.2 | 19.50450 | -75.82700 | 6424.3 m
|
Note: Sonde time and location from launch records in raw GPS
files, comments from HRD logs.
Table 2
AXBT
| Launch | (UTC)
| Lat | Lon | SST (°C)
|
| 1 | 185240 | 16.99 | -72.75 | 27.7
|
| 2 | 194820 | 17.49 | -71.28 | 27.3
|
| 3 | 195340 | 17.49 | -71.81 | 27.6
|
| 4 | 200300 | 17.50 | -72.50 | 27.8
|
| 5 | 200815 | 17.75 | -72.84 | 27.7
|
| 6 | 201350 | 18.01 | -73.20 | 27.7
|
Note: Last 3 AXBT were deployed in same location as 021205 flight.
Information from AXBT scientist logs.
Figure 1 Map showing launch positions of GPS sondes and AXBTs.
Numbers correspond to entries in tables above.
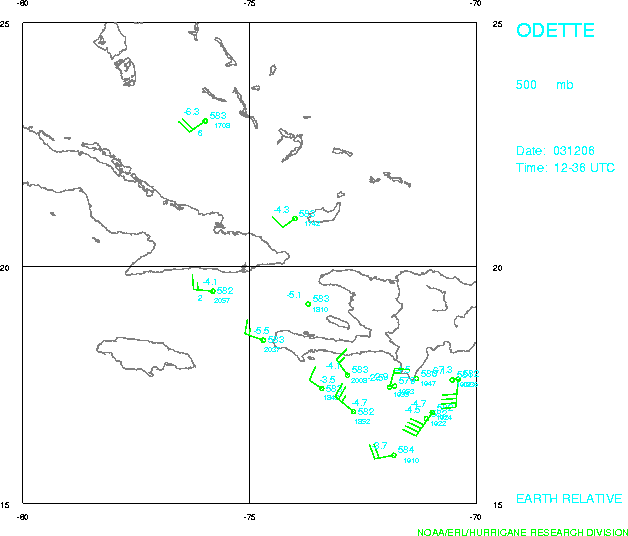
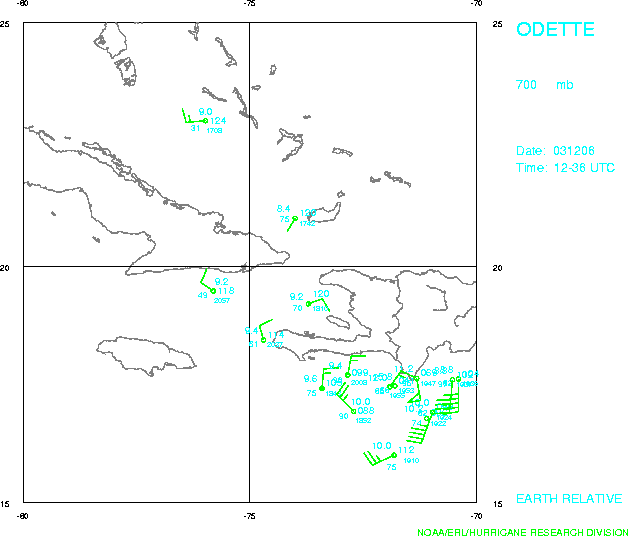
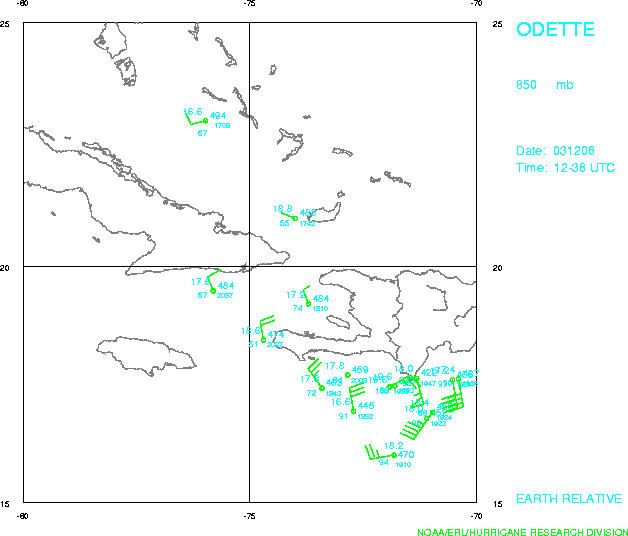
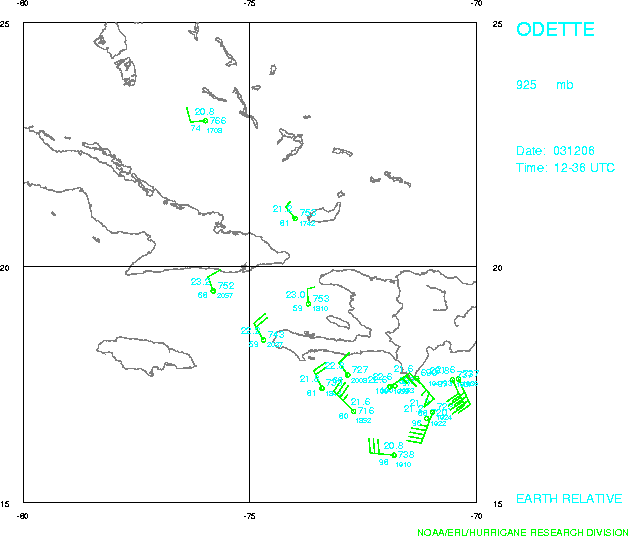
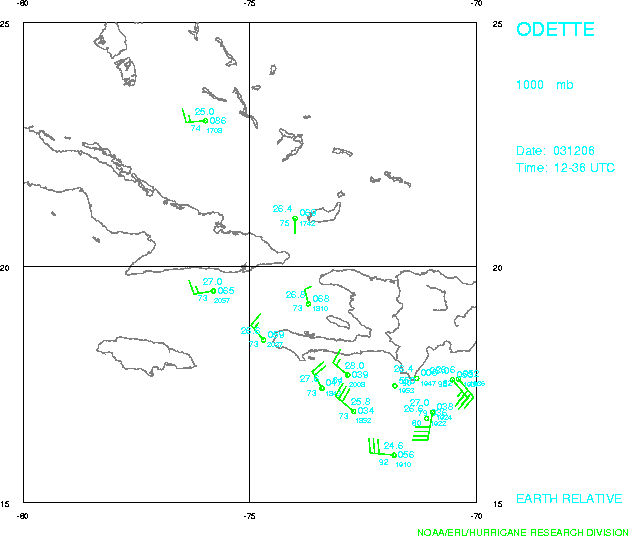
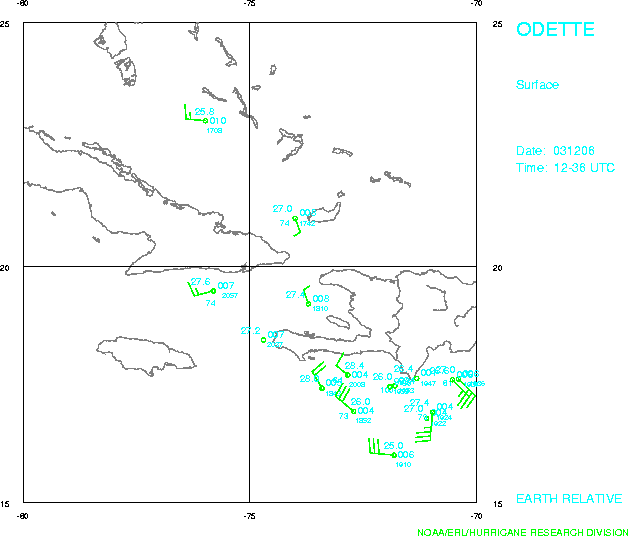
Dropsonde plots at various levels
500 mb
700 mb
850 mb
925 mb
1000 mb
surface
Return to Mission page.

