| Aircraft Commander | Adam Abitol |
| Co-pilot | Robert Mitchell |
| Co-pilot | Kevin Doremus |
| Flight Engineer | Paul Darby |
| Navigator | Brian Richards |
| Flight Director | Mike Holmes |
| Flight Director | Quinn Kalen |
| System Engineer | Mike Mascaro |
| Data Technician | Mac McAlister |
| AVAPS | Todd Richards |
| LPS/Radar | Heather Holbach | HRD |
| Dropsonde | Kathryn Sellwood | HRD |
| Radar | Paul Reasor | HRD |
Mission Plan :
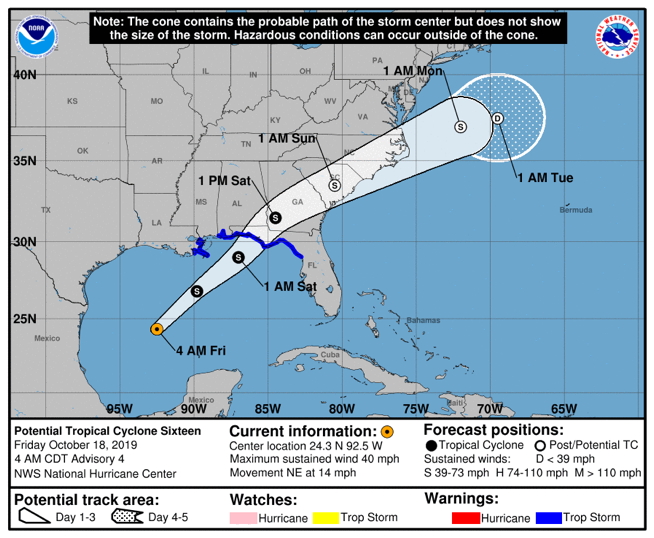
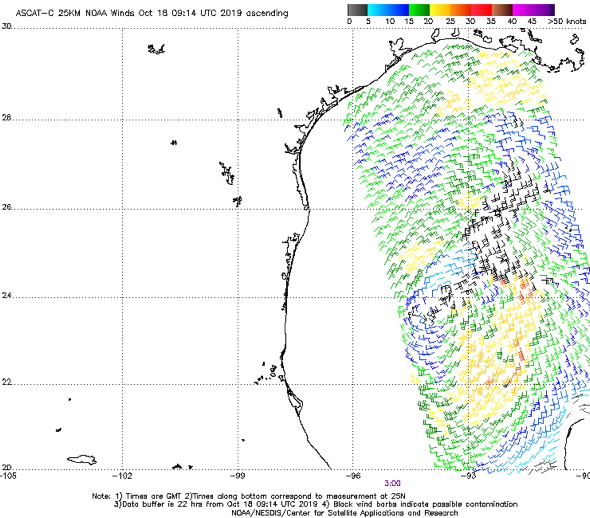
NOAA 42 will fly an EMC-tasked mission into Potential Tropical Cyclone (PTC) 16 in the Atlantic Ocean. As of 5am AST (0900Z), PTC 16 is estimated to have maximum sustained winds of 35kts, minimum central pressure of 1004mb, and moving northeast (45°) at 12 kts (Fig. 1). PTC 16 continues to look better organized in satellite imagery this morning. A 03Z ASCAT-C overpass (Fig. 2) indicated that the “center” is still elongated, but may be trying to close off on the southwest end. The evolution of this system is extremely complicated given the baroclinic influences. There is a large amount of dry air over the western Gulf of Mexico associated with the upper level trough coming off of Texas impinging on the circulation (Fig. 3). There is also a warm eddy that was shed from the loop current earlier this year present in the central Gulf of Mexico that the storm is moving over and a cold eddy in the northeast Gulf of Mexico (Fig. 4). PTC 16 is entering a region of increasing shear (gradient) from 15 to 40 kts.
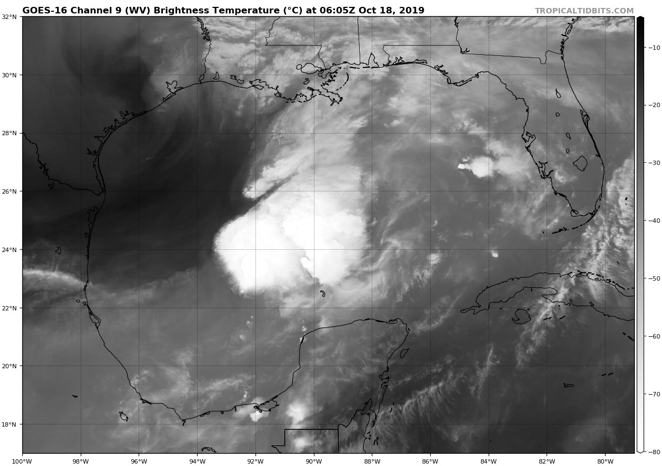
Figure 3: GOES-16 water vapor imagery of PTC 16 at 6Z on October 18, 2019. (source: www.tropicaltidbits.com) |
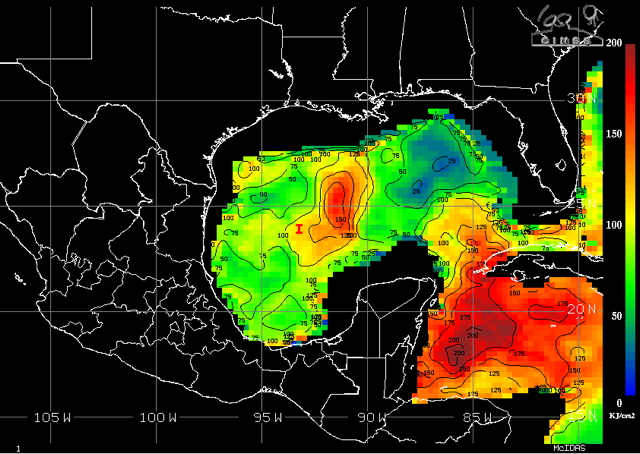
Figure 4: Ocean heat content in the Gulf of Mexico on October 18, 2019 (source: CIMSS) |
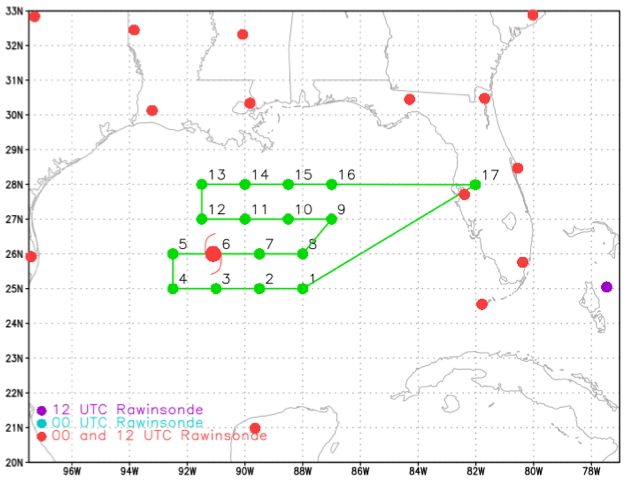
Figure 5: Planned flight track. |
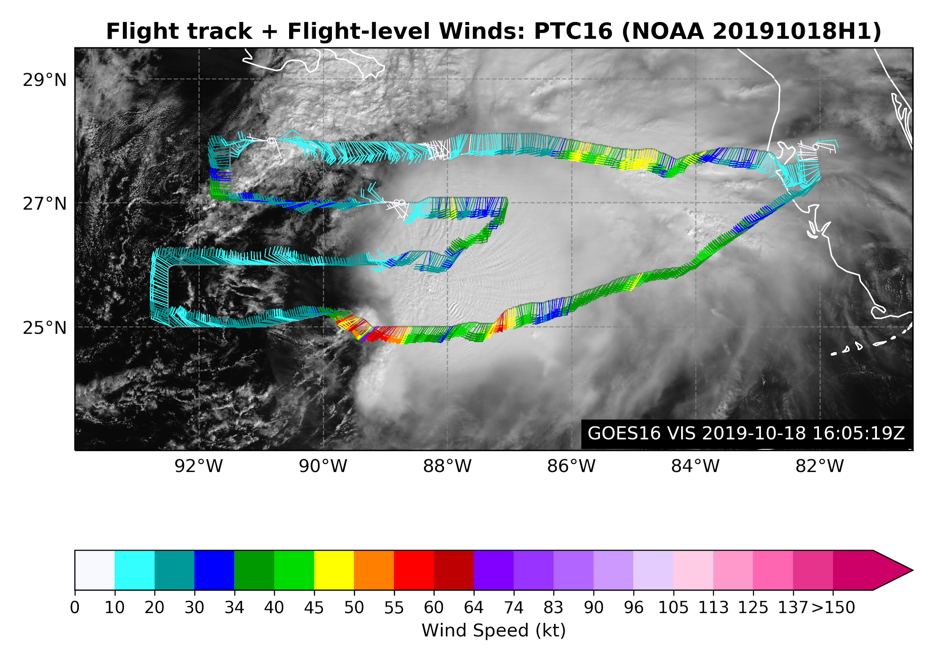
Figure 6: Actual flight track with GOES-16 visible imagery and flight level wind barbs. |
Mission Summary :
| Take off | Landing
| Linder-Lakeland, FL
| 11:54 UTC
| Linder-Lakeland, FL
| 19:02 UTC
| Expendables
| 16 sondes - all good
| 5 AXBT - 3 good | ||||
|
Prepared by the Hurricane Research Division Oct. 17, 2019 5:55 PM EDT Aircraft: N42RF Proposed takeoff: 18/1200Z | |||||||
| DROP LOCATION TABLE | |||||||
| # | LAT | LON | Time | ||||
| deg min | deg min | hr:min | |||||
| 1 | 25 00 | 88 00 | 1:09 | ||||
| 2I | 25 00 | 89 30 | 1:29 | ||||
| 3I | 25 00 | 91 00 | 1:50 | ||||
| 4 | 25 00 | 92 30 | 2:11 | ||||
| 5 | 26 00 | 92 30 | 2:27 | ||||
| 6I | 26 00 | 91 00 | 2:47 | ||||
| 7I | 26 00 | 89 30 | 3:07 | ||||
| 8 | 26 00 | 88 00 | 3:28 | ||||
| 9 | 27 00 | 87 00 | 3:49 | ||||
| 10I | 27 00 | 88 30 | 4:09 | ||||
| 11I | 27 00 | 90 00 | 4:29 | ||||
| 12 | 27 00 | 91 30 | 4:50 | ||||
| 13 | 28 00 | 91 30 | 5:06 | ||||
| 14I | 28 00 | 90 00 | 5:25 | ||||
| 15I | 28 00 | 88 30 | 5:45 | ||||
| 16 | 28 00 | 87 00 | 6:06 | ||||
In total, 17 regular dropsondes and 10 mini dropsondes were deployed. 16 of the 17 dropsondes were good and all of the mini dropsondes were good. The dropsonde at point 15 was launched near a glider that was located at 28.13°N, 88.24°W at 1308Z. 3 of the 4 AXBTs deployed were good. One of the AXBTs was stuck in the CAD and signal was lost with it, but fortunately it was still on the aircraft upon landing. The combo drops sampled the warm and cold eddies. TDR data was successfully sent to EMC. Figure 7 displays the final planview analyses from the TDR.
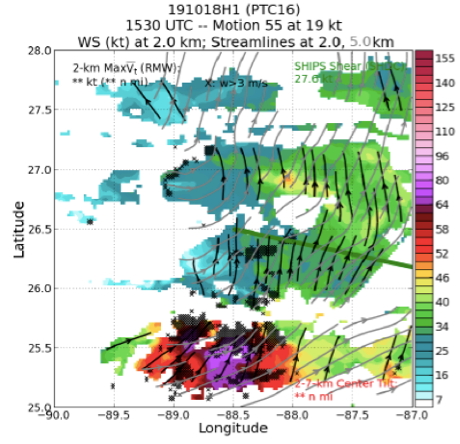
Figure 7: TDR reflectivity (left) and wind speed (right) planview analyses. |
Mission Evaluation :
The mission was a success. We transmitted 16 dropsondes and 5 TDR analyses for ingestion into the models. Additionally, we transmitted SFMR data and had 3 good AXBT drops. We also launched 10 mini dropsondes to help with their validation.
Problems :
Some minor issues with radarsync -a and the radar workstation. Radarsync -u hung, but it was resolved with a computer reboot. The radar workstation monitor stopped working, but it was fixed during the ferry. None of these issues prevented data transmission. ASPEN also seemed to have a bug with correcting the pressure data in the tempdrop (section B) for a dropsonde that did not hit the surface.
Heather Holbach
Dec. 19, 2019
Flight Director's manifest |
Flight Director's log |
NetCDF data
LPS log |
Radar log |
Drop log |
SFMR data