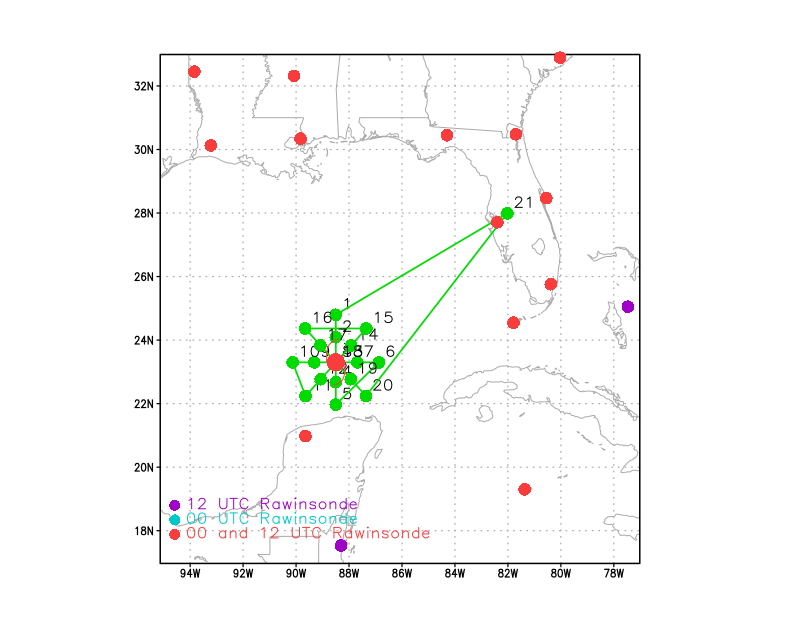
Figure 1. Proposed flight track for mission 20171007H1 |
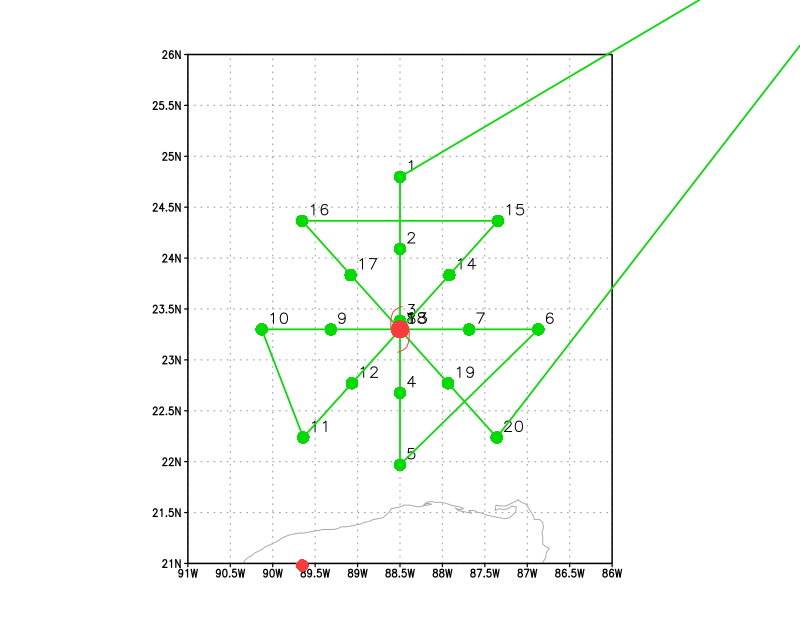
Detail of proposed flight track for 20171007H1 |
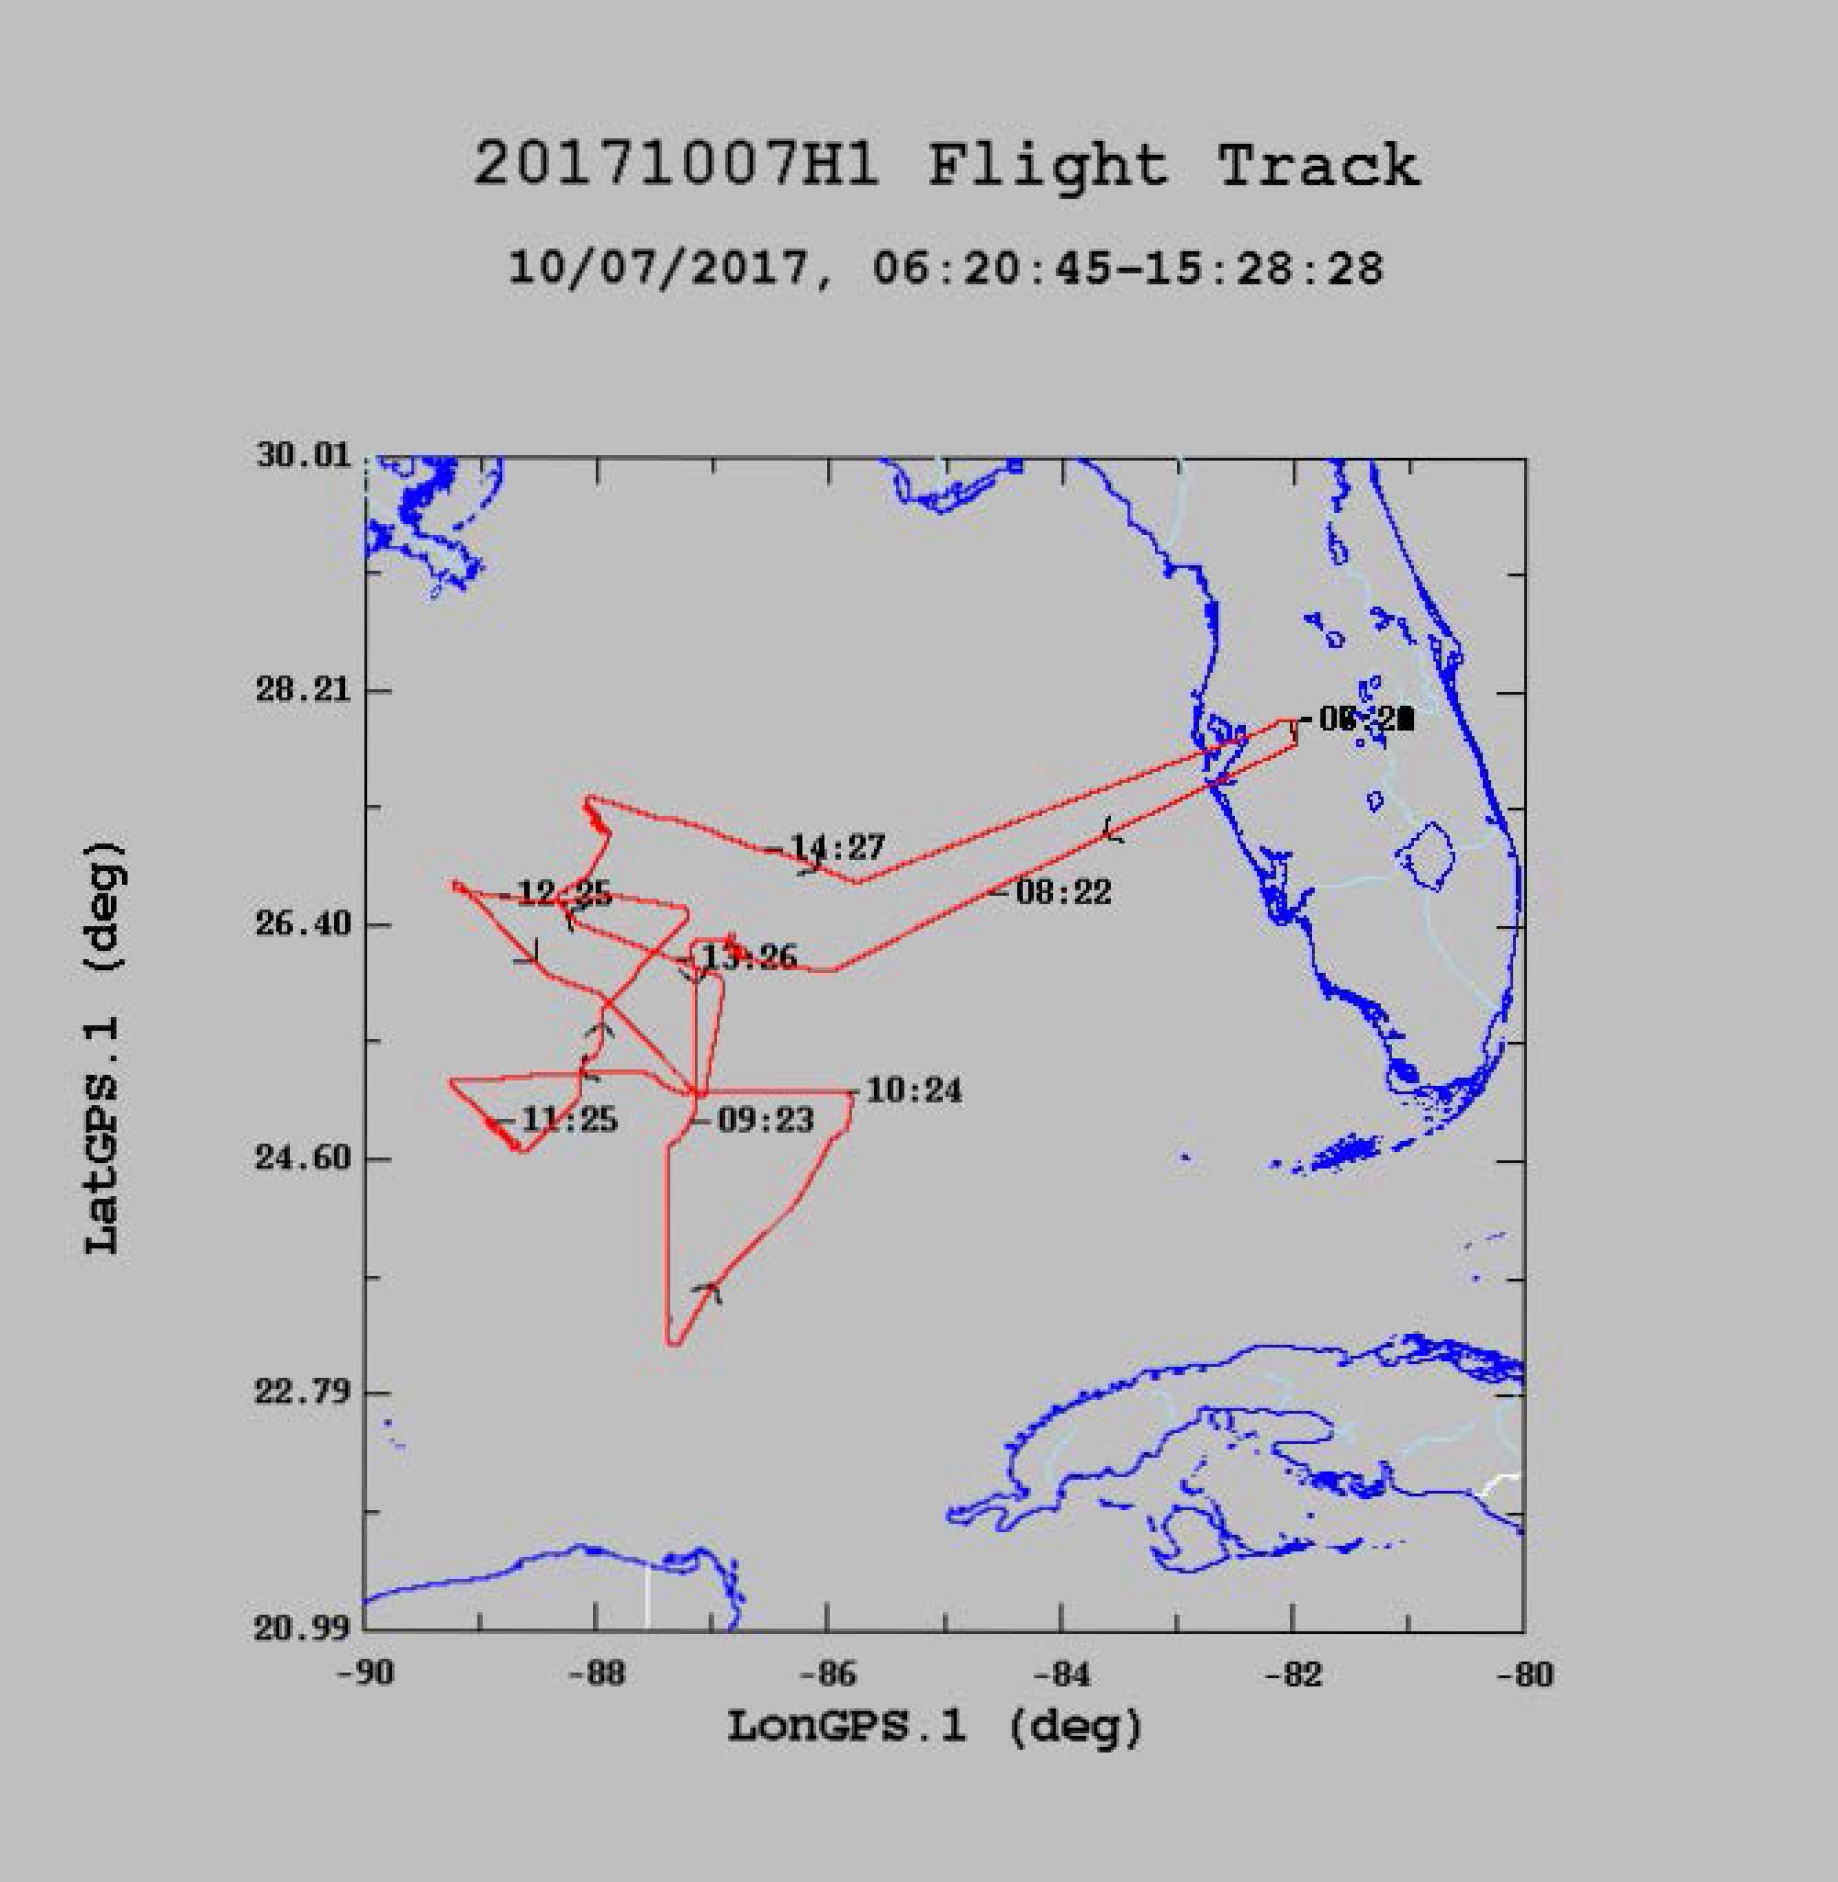
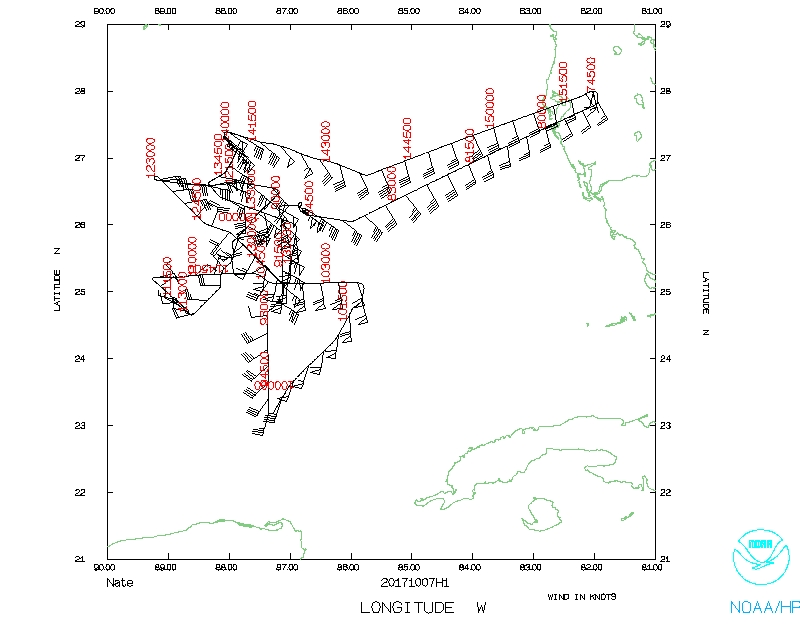
Actual flight track for 20171007H1 |
| Aircraft Commander | Justin Kibbey |
| Co-pilot | Kahn |
| Co-pilot | Rossi |
| Flight Engineer | Paul Darby |
| Flight Engineer | Todd Tufnell |
| Navigator | Freeman |
| Flight Director | Mike Holmes |
| System Engineer | Bobby Peek |
| Data Technician | Terry Lynch |
| Dropsonde Operator | Underwood |
| Lead ProjectScientist | Jon Zawislak | HRD |
| Radar Scientist | Heather Holbach | HRD |
| Dropsonde Scientist | Kathryn Sellwood | HRD |
| DWL Scientist | Brad Klotz | HRD |
| AXBT Scientist | Josh Wadler | RSMAS |
| Radar Scientist | John Gamache | HRD |
Mission Plan :
|
Figure 1. Proposed flight track for mission 20171007H1 |
Detail of proposed flight track for 20171007H1 |
Actual flight track for 20171007H1 |
NOAA42 will conduct a third research HRD-tasked mission for AIPEX in Nate. The initial plan calls for a rotated Figure-4 at 10-kft (altitude may be adjusted for de-confliction for Teal) with 90 nm radial legs (Figure 1). A few modules were proposed for this mission: a high-altitude circumnavigation on the upshear side if precipitation is asymmetric, the SFMR high-incidence angle module, and a convective burst module. A second SFMR does appear to be on the airplane, but it is unknown as to whether it is ready for use. The plan calls for dropsonde / AXBT combination releases at turn points, midpoints, and center drops, although we may not drop a sonde on every center pass unless NHC requests it. In total, there are 30 dropsondes and 21 AXBTs available onboard. SHIPS shear as of the 0000 UTC analysis is 043°/6 kt. The NHC advisory at 0200 am EDT / 0600 UTC: Motion, 340°/19 kt; Intensity, 70 kt, 987 mb; Position, 23.5°N / 86.5°W. The NHC forecast position at 1200 UTC is 25.1°N / 87.8°W (forecast intensity, 70 kt).

Figure 2. GOES-13 IR imagery of Nate from 0615 UTC 7 October |

Figure 3. IR imagery and CIMSS-derived deep-layer (850-200-hPa) vertical wind shear (contoured; contours colored by favorability for intensification, with green being "favorable", yellow being "neutral", and red being "unfavorable", valid at 0445 UTC 7 October (images courtesy CIMSS, tropic.ssec.wisc.edu) |
Nate was intensifying during the previous P-3 mission (20171006H2), reaching 55-60 kt. Since that mission, Teal observed hurricane-force winds, and so NHC upgraded the intensity to 70 kt. Deep convection, which during this crew's mission yesterday (20171006H1) was predominantly on the western regions of the storm, has apparently rotated all the way around the center (at least according to the IR imagery, Fig. 2). Nate appears to have experienced rapid intensification in the previous 24 h (increase of 35 kt). If the 0000 UTC SHIPS analysis is consistent with the actual direction Nate is experiencing, then the upshear quadrant (NE to SE of the center) has seen an increase in azimuthal symmetry, as convective bursts appear to be forming downshear (west of center) and rotating upshear. The CIMSS analysis (Fig. 3), however, suggests the shear may be southwesterly, which means that rainfall would need to increase on the SW side (upshear) of the storm in order to achieve precipitation symmetry. Either way, this cycling evolution during this mission would be an ideal set-up for a convective burst module. As the SSTs are high and deep-layer vertical wind shear apparently relatively low and favorable (Fig. 3), we expect the organization of Nate to continue to improve, and for the intensity to increase during this mission. If Nate is experiencing RI, the intensity forecasts (Fig. 4) may be less than what Nate actually experiences. As the storm is moving fairly rapidly to the north (Fig. 5), the highest winds should be on the east side of the storm.
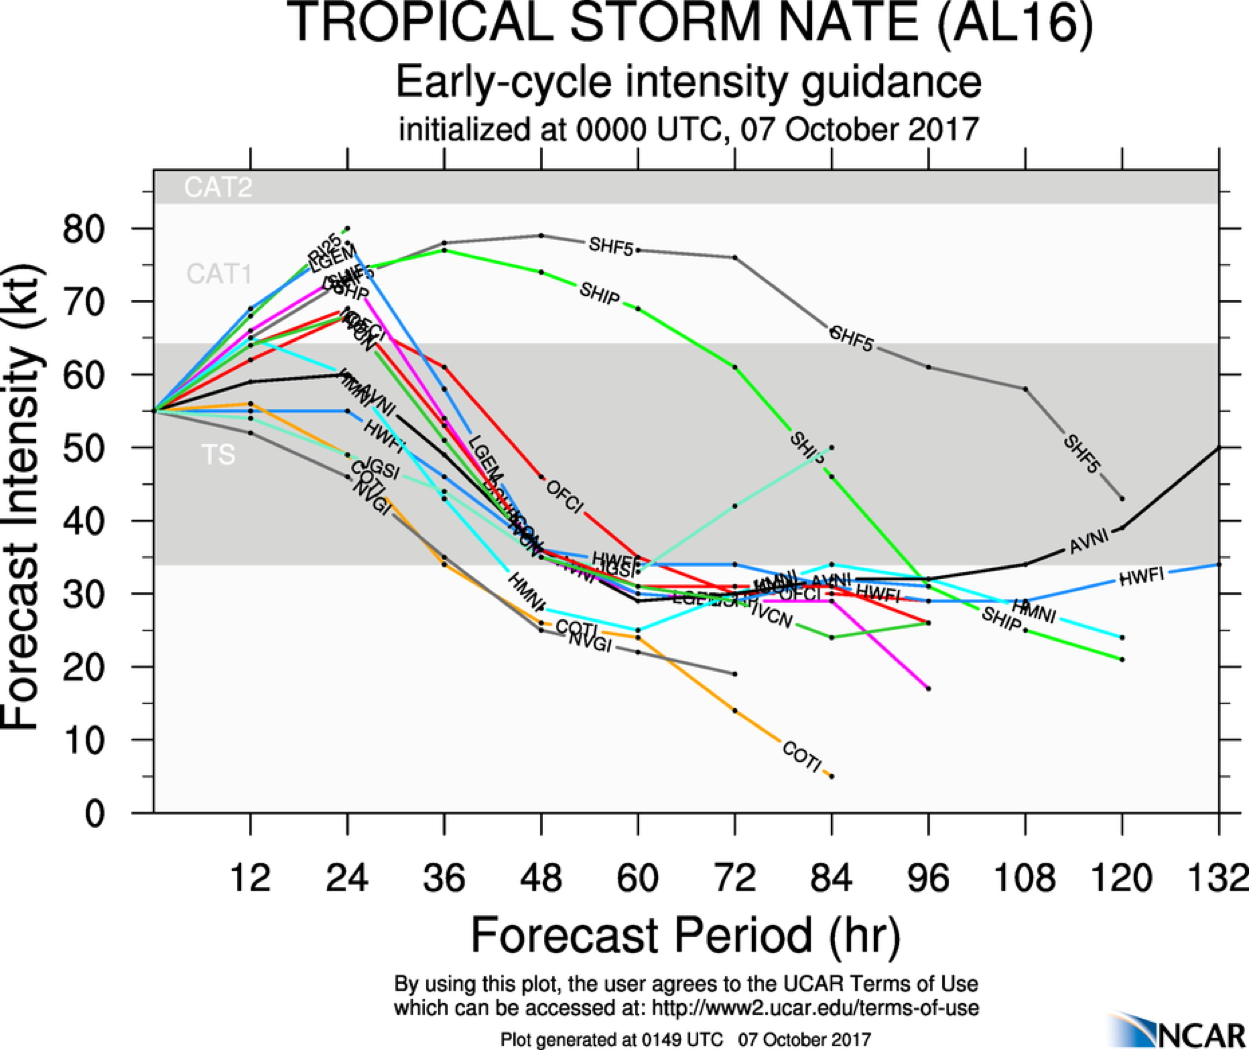
Figure 4. Intensity forecast guidance for Nate valid 0000 UTC 7 October (image courtesy http://www.ral.ucar.edu/guidance/realtime/current/) |
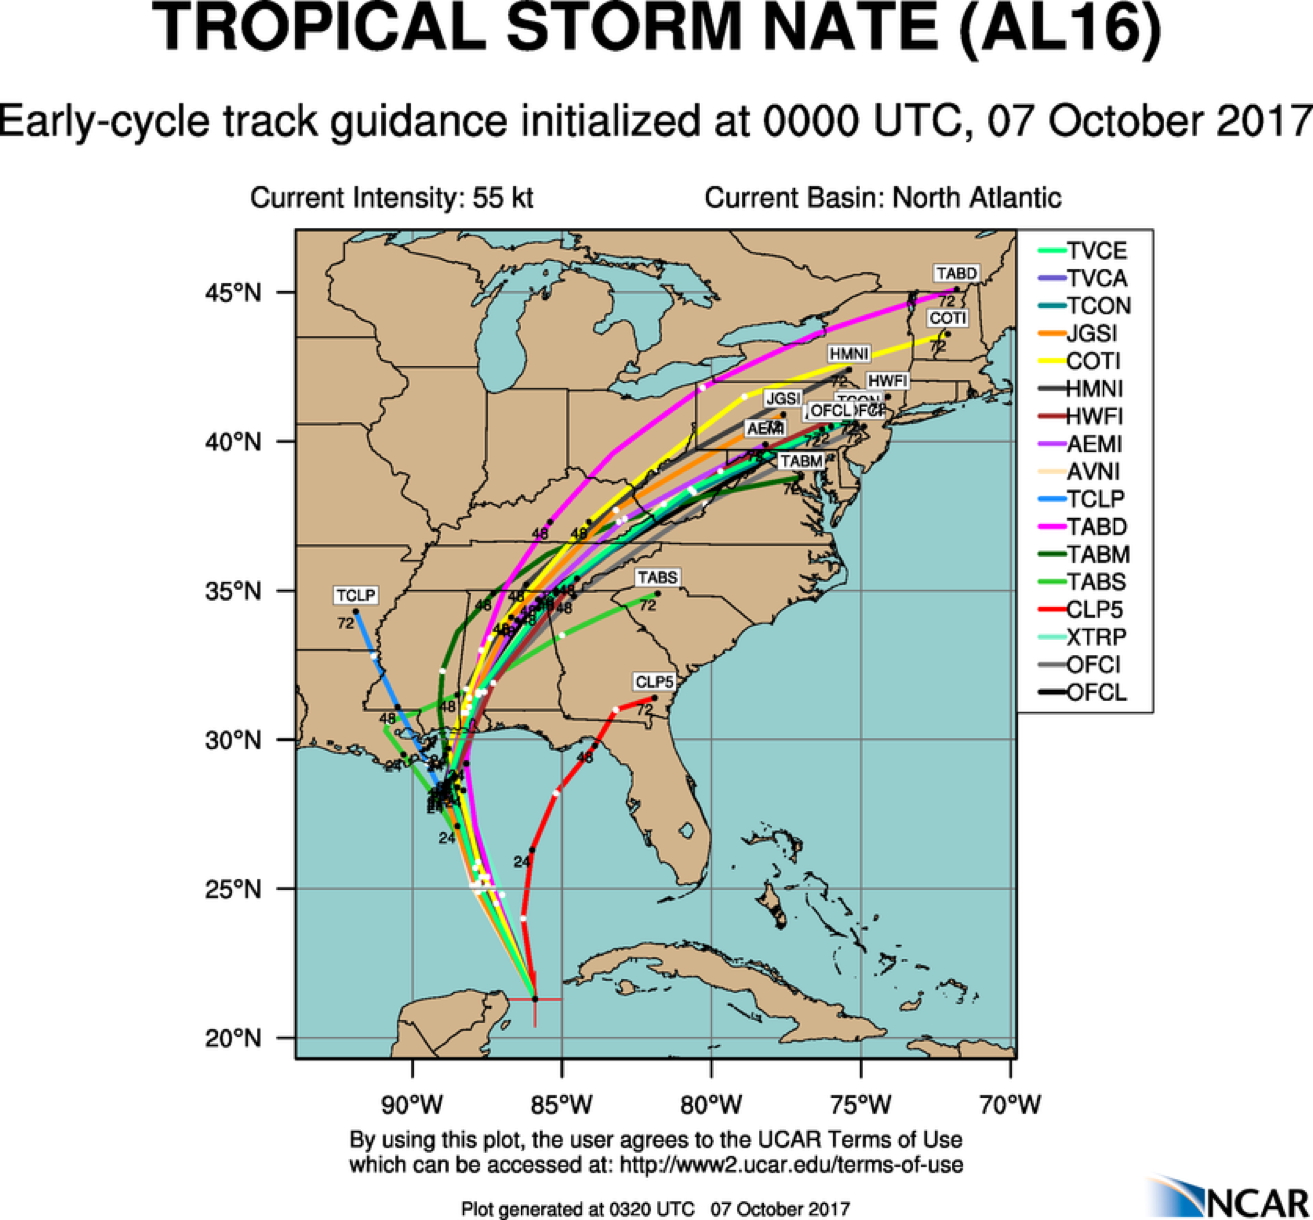
Figure 5. Track forecast guidance for Nate valid 0000 UTC 7 October (image courtesy http://www.ral.ucar.edu/guidance/realtime/current/) |
|
Prepared by the Hurricane Research Division October 06, 2017 Aircraft: N42RF Proposed takeoff: 07/0800Z
DROP LOCATION TABLE
| #
| LAT
| LON
| RAD/AZM
| TIME
|
| deg min
| deg min
| nm deg
| (hh:mn)
| 1S | 24 48 | 88 30 | 90/000 | 1:14
| 2I | 24 05 | 88 30 | 1:26
| 3I | 23 23 | 88 30 | 1:36
| 4I | 22 41 | 88 30 | 1:47
| 5S | 21 58 | 88 30 | 80/180 | 1:58
| 6S | 23 18 | 86 52 | 90/090 | 2:28
| 7I | 23 18 | 87 41 | 2:41
| 8I | 23 18 | 88 30 | 2:52
| 9I | 23 18 | 89 19 | 3:03
| 10S | 23 18 | 90 08 | 90/270 | 3:14
| 11S | 22 14 | 89 38 | 90/225 | 3:32
| 12I | 22 46 | 89 04 | 3:44
| 13I | 23 18 | 88 30 | 3:56
| 14I | 23 50 | 87 55 | 4:07
| 15S | 24 22 | 87 21 | 90/045 | 4:18
| 16S | 24 22 | 89 39 | 90/315 | 4:50
| 17I | 23 50 | 89 05 | 5:02
| 18I | 23 18 | 88 30 | 5:14
| 19I | 22 46 | 87 56 | 5:22
| 20S | 22 14 | 87 22 | 90/135 | 5:30
| | ||||||||||||||||||||||||||
Mission Summary :
| Take off | Landing
| Linder-Lakeland, FL
| 07:44 UTC
| Linder-Lakeland, FL
| 15:22 UTC
| Penetrations
| 5
| Expendables
| 22 Dropsonde (all good) | 21 AXBT (11 Good, 10 did not report data) | ||||||
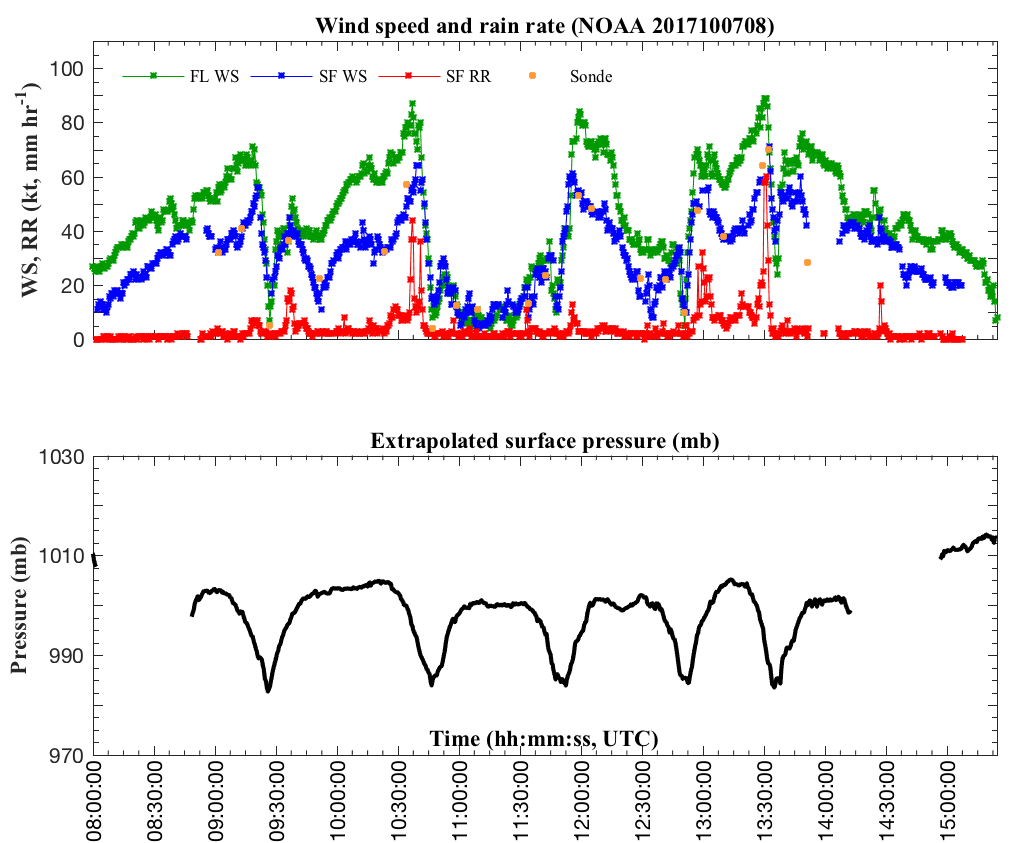
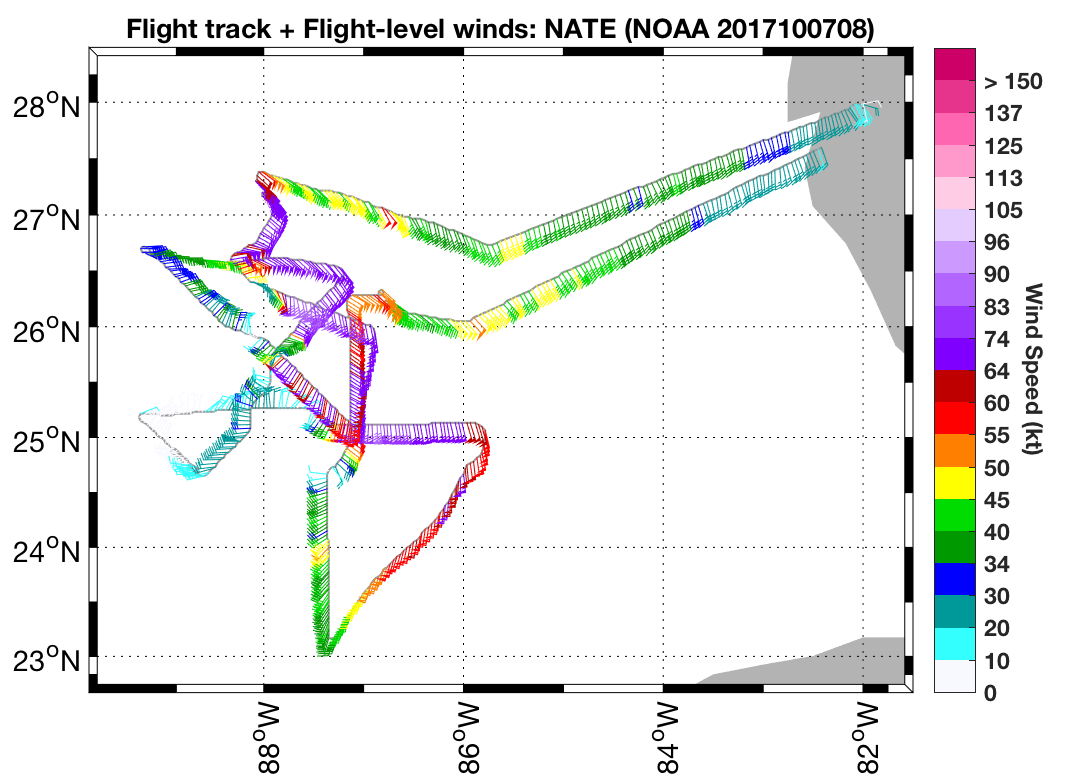
The actual track of this mission is shown in Fig. 6, with wind information at flight level (FL), extrapolated sea level pressure (SLP), and SFMR surface wind speed and rain rate shown in Fig. 7. Prior to pre-flight, we were not able to get the DWL computer powered on (despite it apparently working on the previous mission, 171006H2). As this was an issue the prior day, we did not work the issue and kept with the plan to depart early (given the fast motion of the storm). While en route to the IP, the deep convection to the north of the center appeared to weaken (warming tops in the IR imagery). We arrived at the IP around 0901 UTC near 26°9'N / 87°10'W (Sonde #1 / AXBT #1; the AXBT did not report data). We flew inbound on the 360° azimuth, dropping a sonde at the approximate midpoint of the leg at 0913 UTC (Sonde #2 / AXBT #2; the AXBT did not report data). On the inbound, it was apparent that the precipitation was still not symmetric around the center. We fixed the center at 0926 UTC near 24°42'N / 87°21'W (Sonde #3 / AXBT #3; the AXBT did not report data) (IR imagery near the time of the center pass, Fig. 8; lower fuselage, LF, image in Fig. 9). On the outbound leg to the south (180° azimuth), we decided to drop the sonde / AXBT combo (Sonde #4 / AXBT #4; the AXBT reported good data) in the middle of the heavy rain band to the south of the center (Fig. 9), where the predominant precipitation was in the storm. This rainband was approximately 50 nm from the center. We reached WP #2 to the south at 0951 UTC (Sonde #5 / AXBT #5) and turned downwind for WP #3. The peak FL wind on this pass was 76 kt, 60 kt from SFMR at the surface, and an extrapolated SLP of 983 mb (Fig. 7). The vertical reflectivity profile from the TDR for this first pass is shown in Fig. 10.
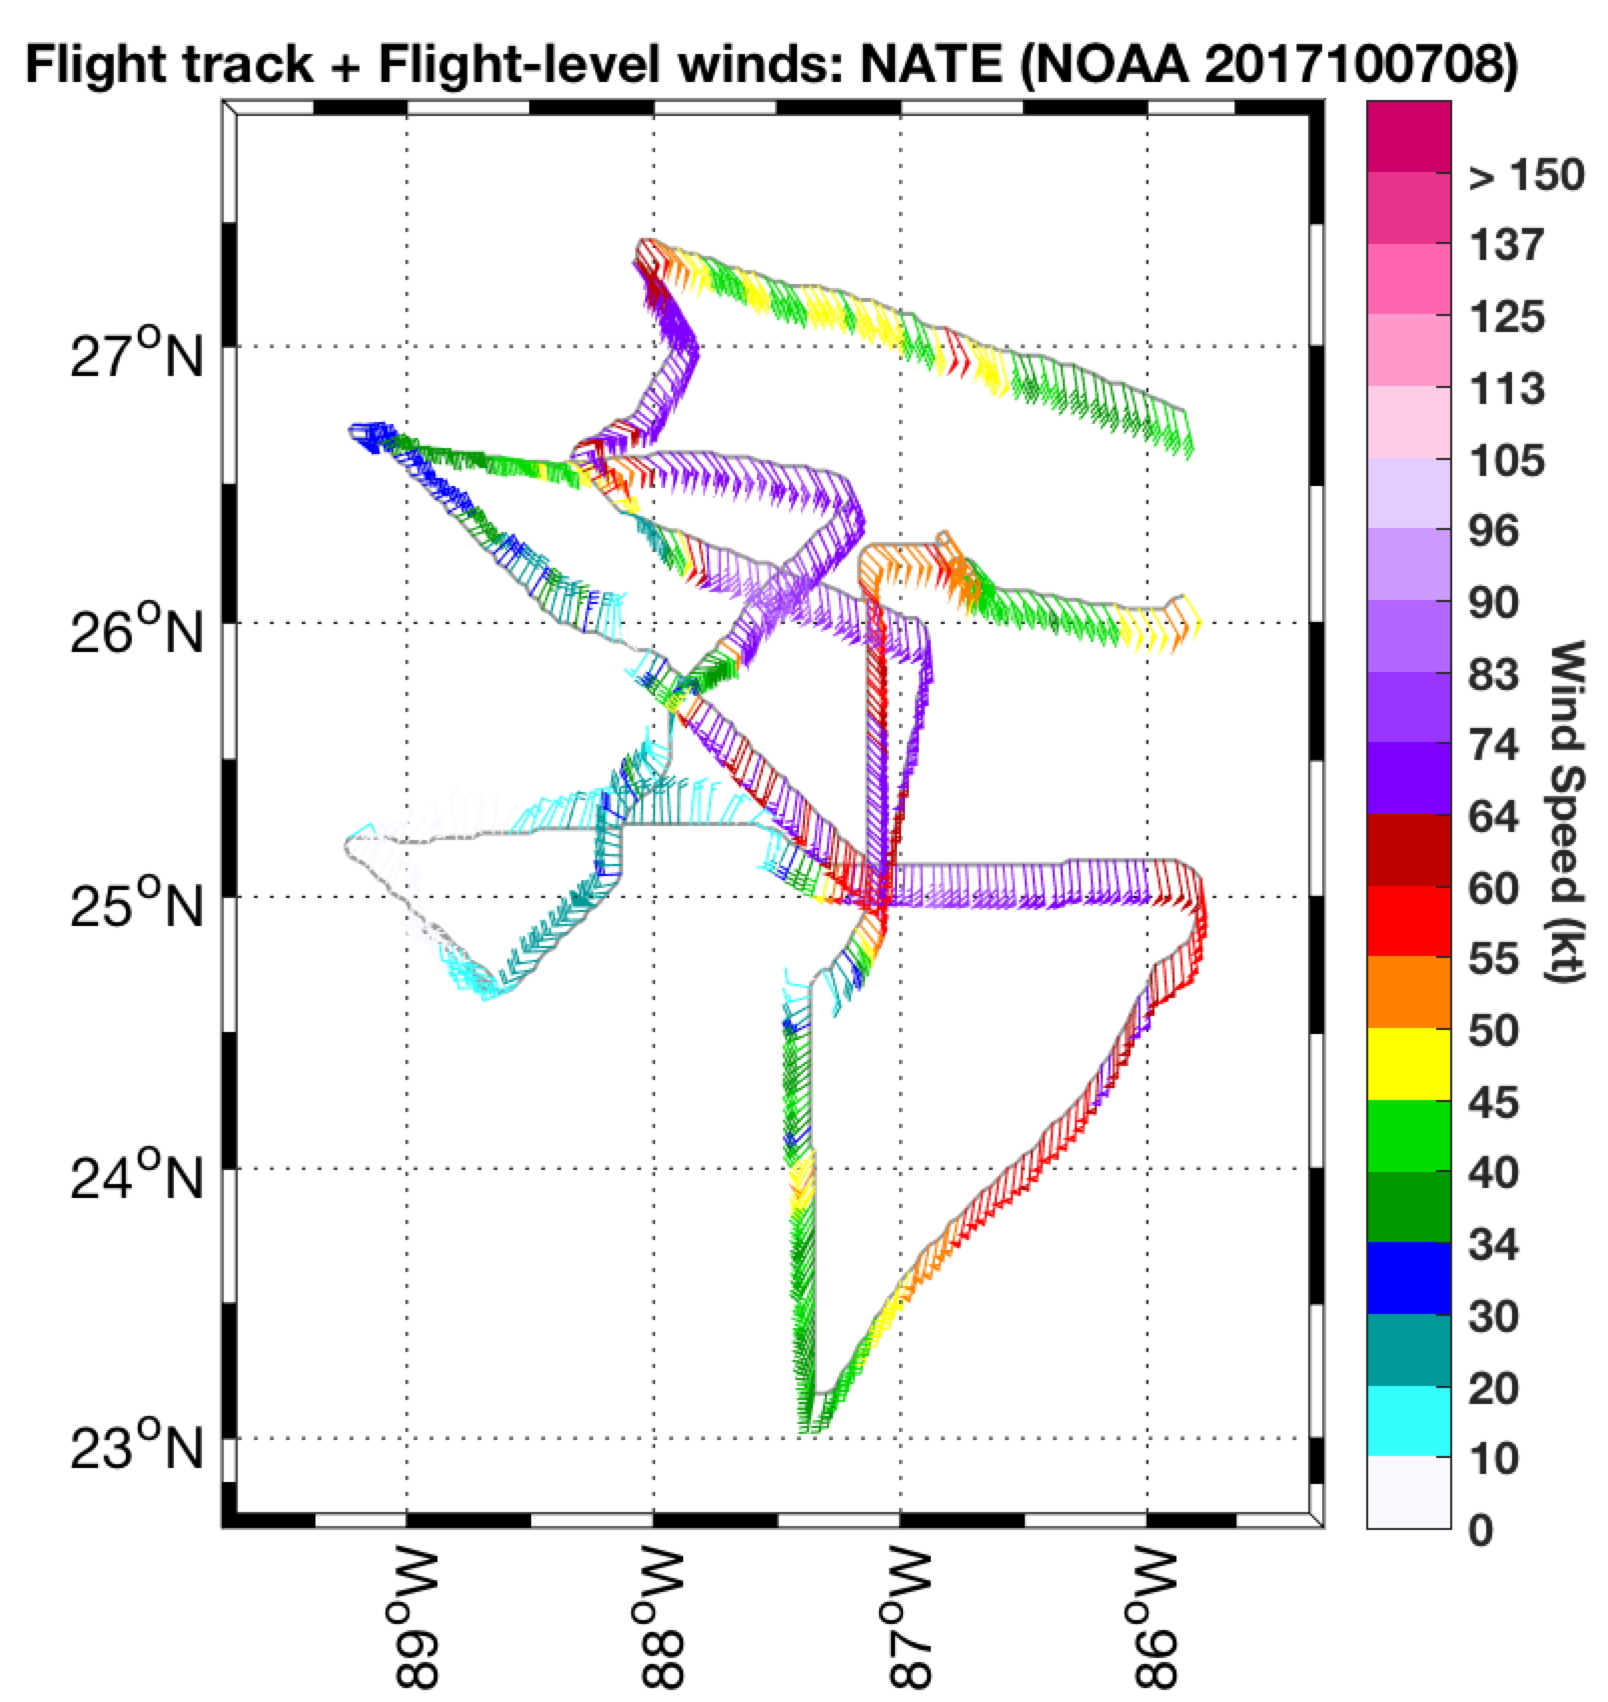
Figure 6. Actual flight track for mission 20171007H1. Flight-level winds (barbs) and wind speeds (shaded, kt) indicated. |

Figure 7. Time series of flight-level winds (green, kt), SFMR surface winds (blue, kt), and SFMR rain rate (red, mm/hr) for mission 20171007H1, as well as the extrapolated surface pressure (mb). |
At WP #3 to the east of the center (arrived 1023 UTC, Sonde #6 / AXBT #6; the AXBT did not report data), we turned on the inbound leg on the 090° azimuth. While inbound, it was still apparent that the eyewall was well developed on the E and NE side, with little development on the W and SW side of the storm (Fig. 12). We did encounter an extensive stratiform rain region on the inbound from the east (Fig. 13). This azimuthal precipitation distribution confirmed that the shear was likely more northwesterly, instead of the northeasterly as the 0000 UTC SHIPS indicated. We released a combo near the midpoint of the inbound leg (Sonde #7 / AXBT #7; the AXBT did not report data). We fixed the center at 1047 UTC near 25°16'N / 87°34'W (Sonde #8 / AXBT #8; the AXBT reported SST of 28.67°C) (IR imagery near the time of the center pass in Fig. 11; LF imagery, Fig, 12). On the outbound to the west, we released the sonde / AXBT combo (Sonde #9 / AXBT #9) near the approximate midpoint at 1058 UTC. At that time, we also decided to forgo doing a convective burst module at the completion of the first Fig. 4. Given the time remaining in the flight, a high-altitude circumnavigation would be difficult; therefore we decided to attempt the planned second Fig. 4 (rotated). This would also allow sampling to be consistent in coverage from the previous two P-3 AIPEX research missions. We arrived at WP #4 at 1108 UTC (Sonde #10 / AXBT #10) . The vertical reflectivity profile from the TDR for the second pass is shown in Fig. 13. The peak FL wind on the second pass was approximately 95 kt, while the peak SMFR surface wind speed was nearly 70 kt, and the extrapolated minimum SLP was 985 mb (Fig. 7).
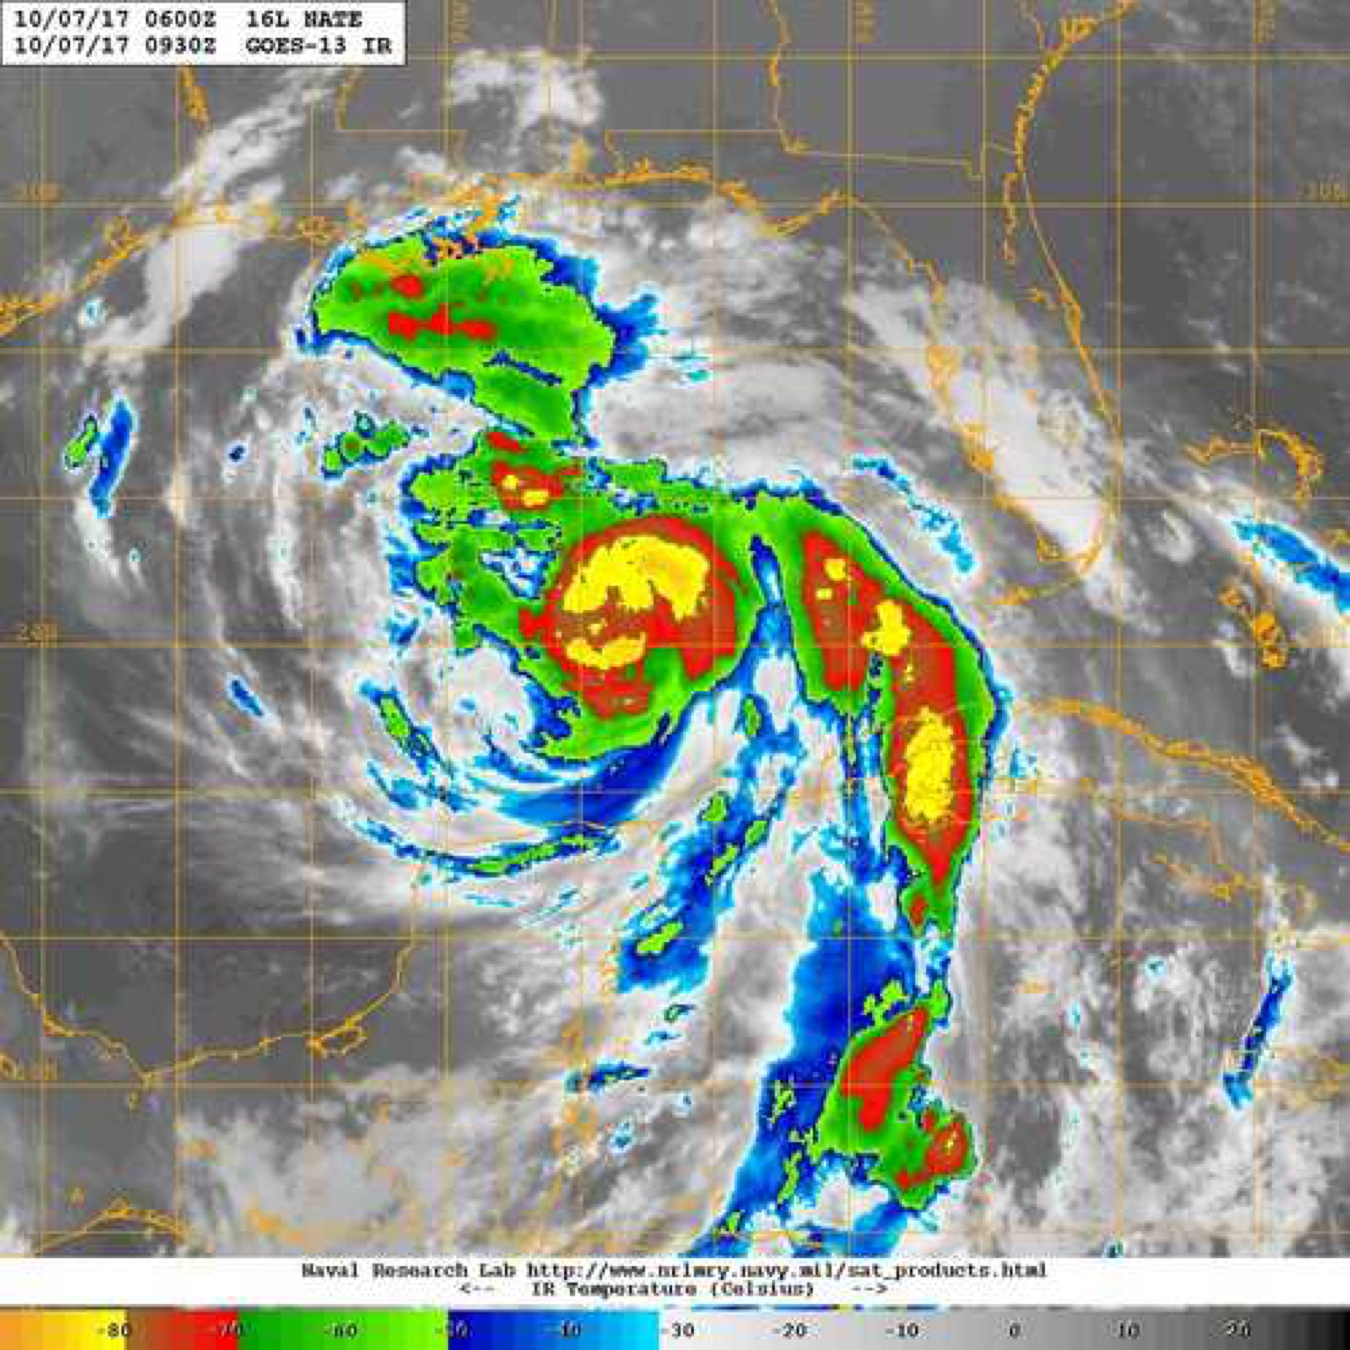
Figure 8. IR imagery at 0930 UTC 7 October, around the time of the first center pass (image courtesy the Naval Research Laboratory, nrlmry.navy.mil/TC.html) |
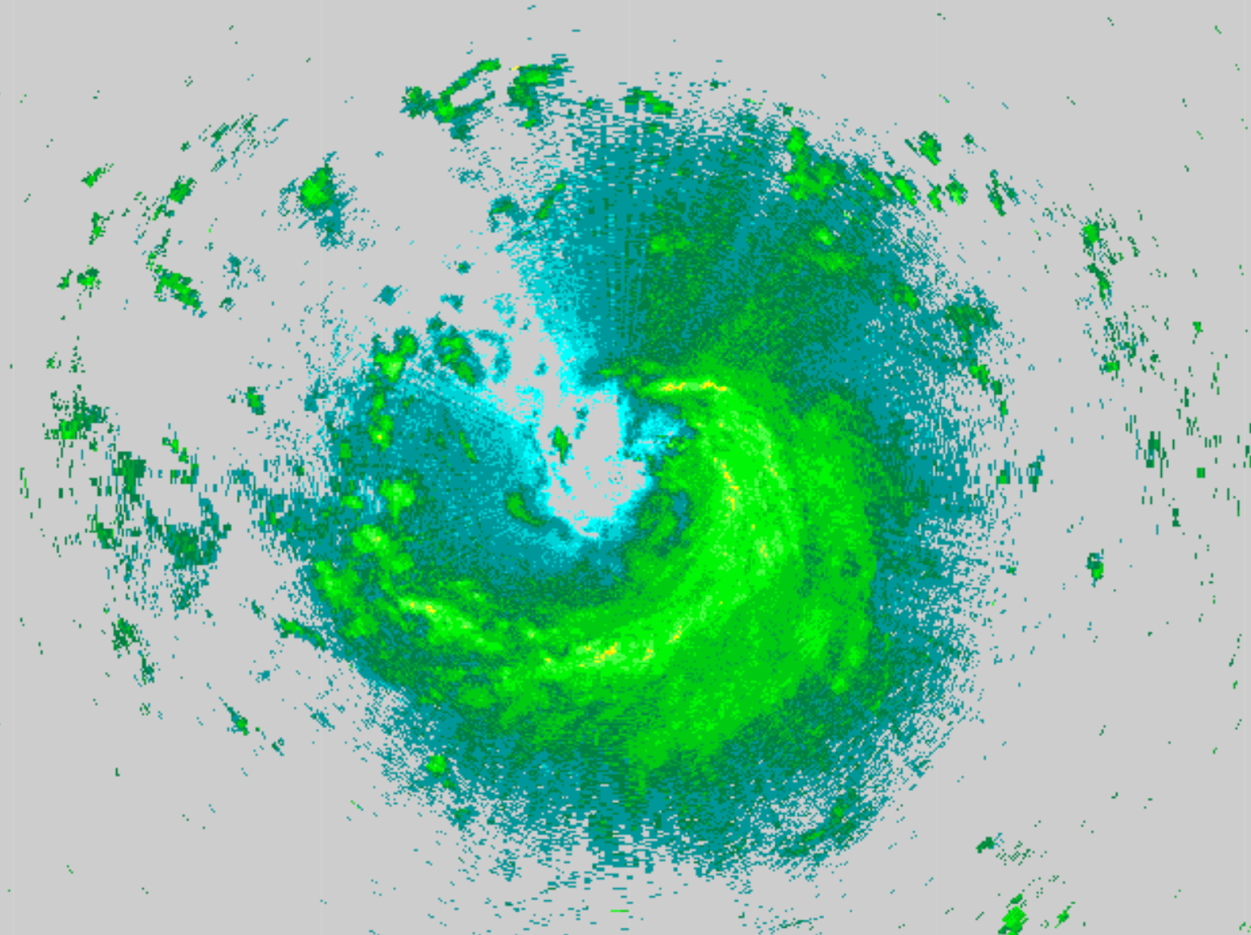
Figure 9. LF imagery at 0925 UTC 7 October |

Figure 10. TDR vertical profile analysis of reflectivity (shaded, dBZ) and vertical velocity (contoured, m s-1) for the first pass (between the IP to the N and WP #2 to the S), centered at 0926 UTC |
As we decided to go into the planned second Fig. 4, we turned downwind to WP #5 to the SW of the center. We would monitor the S side of the storm (seemingly downshear right) for new convective development that would be a target for a convective burst module at the completion of the second Fig. 4. After briefly circling on the downwind leg to ensure that we would go in on the 225° azimuth, we arrived at WP #5 at 1131 UTC (Sonde #11 / AXBT #11 was released at 1134 UTC; the AXBT reported 28.12°C) and went inbound on the 225° azimuth. It was apparent, however, that the storm was moving northward faster than anticipated, and consequently we had to make a jog to the north to be able to fix the center. As the legs would be shorter on this Fig. 4 (~70 nm), we released the midpoint combo at 1142 UTC (Sonde #12 / AXBT #12). We were able to fix a center at 1147 UTC near 25°34'N / 87°56'W (IR imagery around this center pass time, Fig. 14; LF imagery, Fig. 15), but no sonde or AXBT was released for this fix. On the outbound leg on the 045° azimuth to the NE (apparently upshear left), we encountered heavy precipitation (Figs. 15, 16). We released the midpoint combo of the outbound leg at 1158 UTC (Sonde #13 / AXBT #13) and arrived at WP #6 at 1205 UTC (Sonde #14 / AXBT #14). The vertical reflectivity profile from the TDR for this third pass of the center is shown in Fig. 16. The peak FL wind was 92 kt, SFMR surface wind was 70 kt, and the extrapolated minimum SLP was 985 mb (Fig. 7).
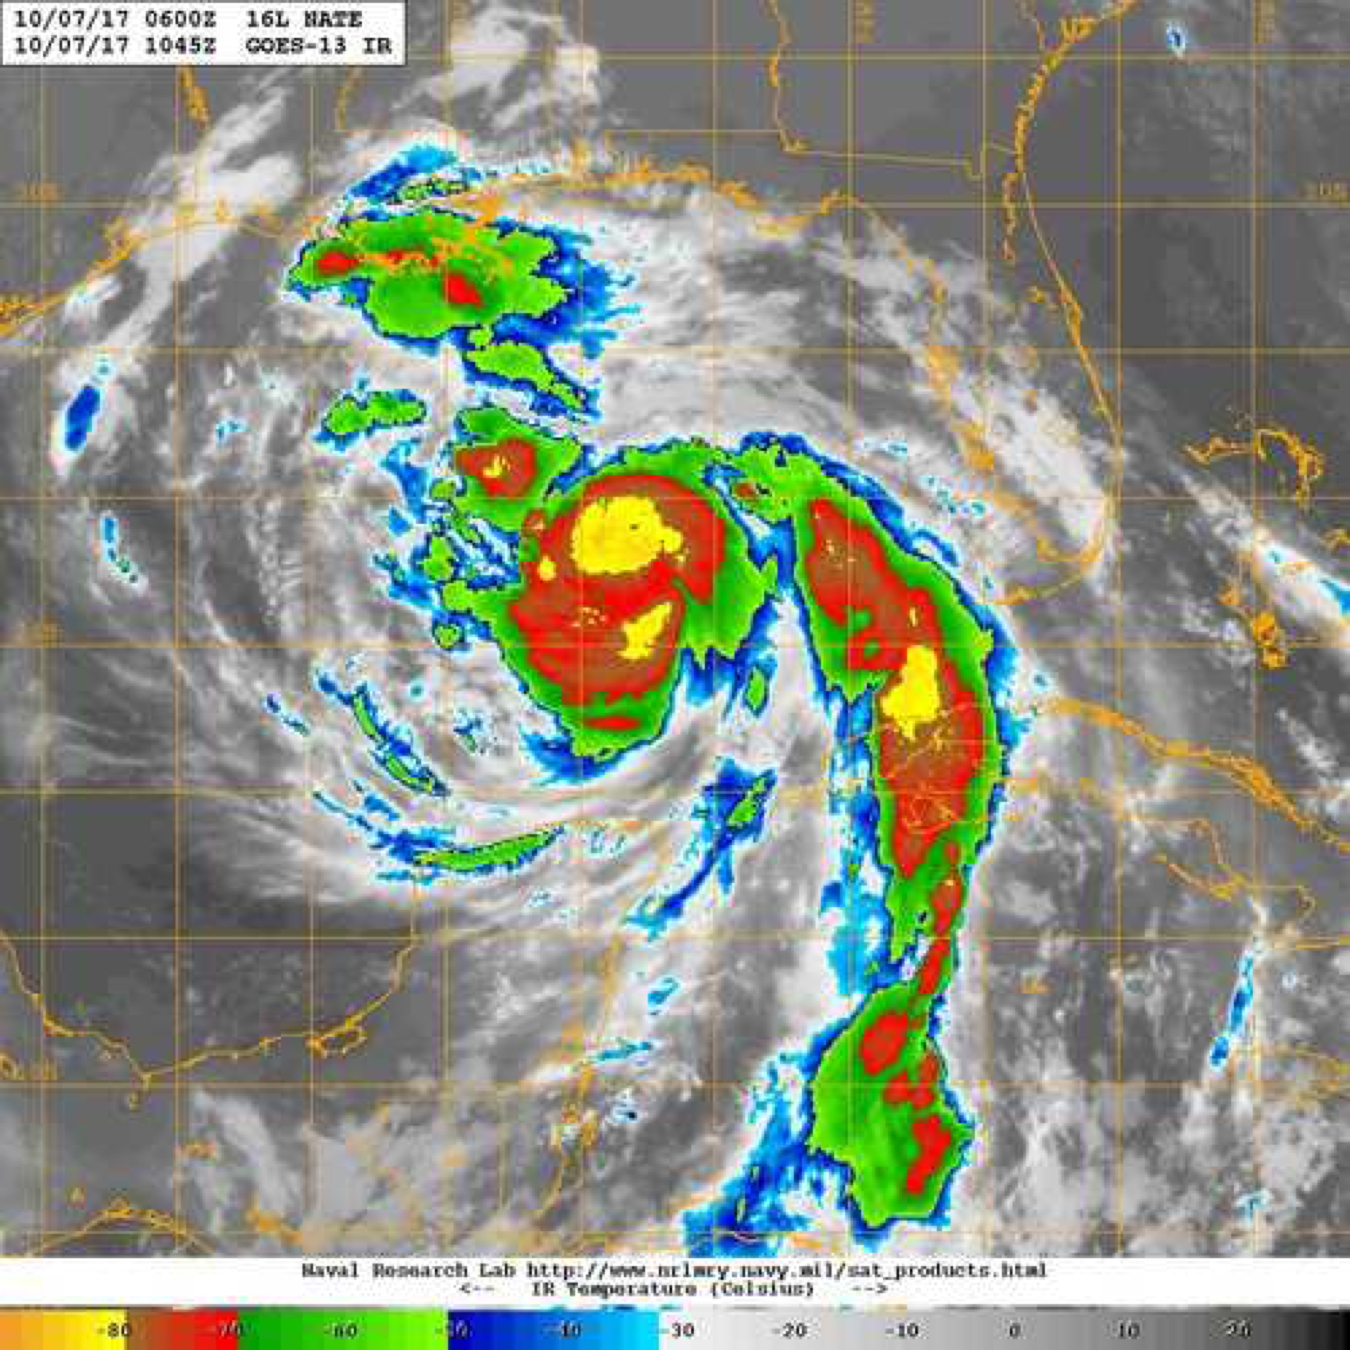
Figure 11. IR imagery at 1045 UTC 7 October, around the time of the second center pass (image courtesy the Naval Research Laboratory, nrlmry.navy.mil/TC.html) |
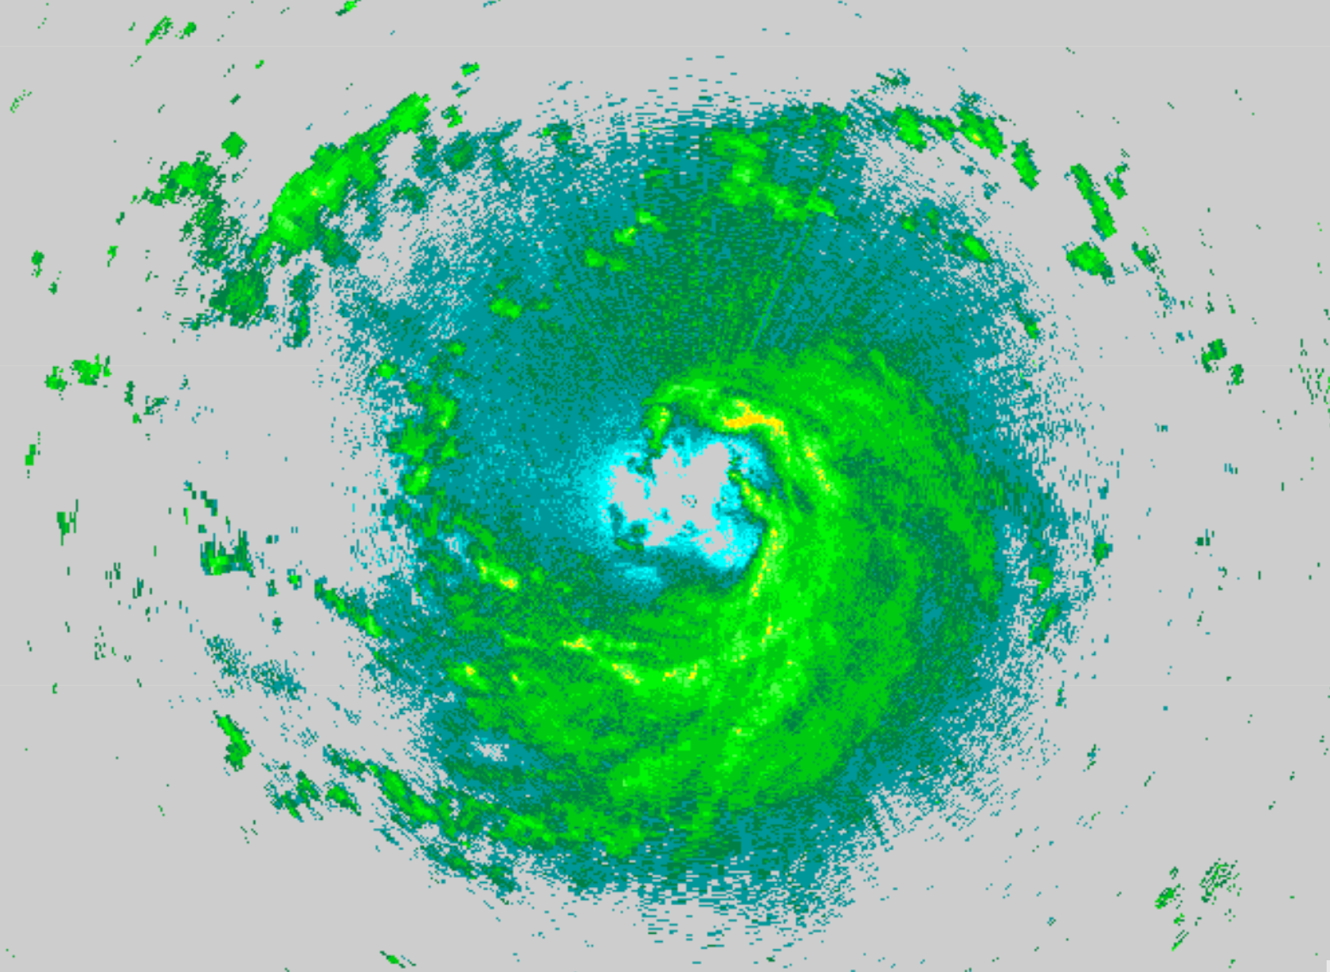
Figure 12. LF imagery at 1046 UTC 7 October |
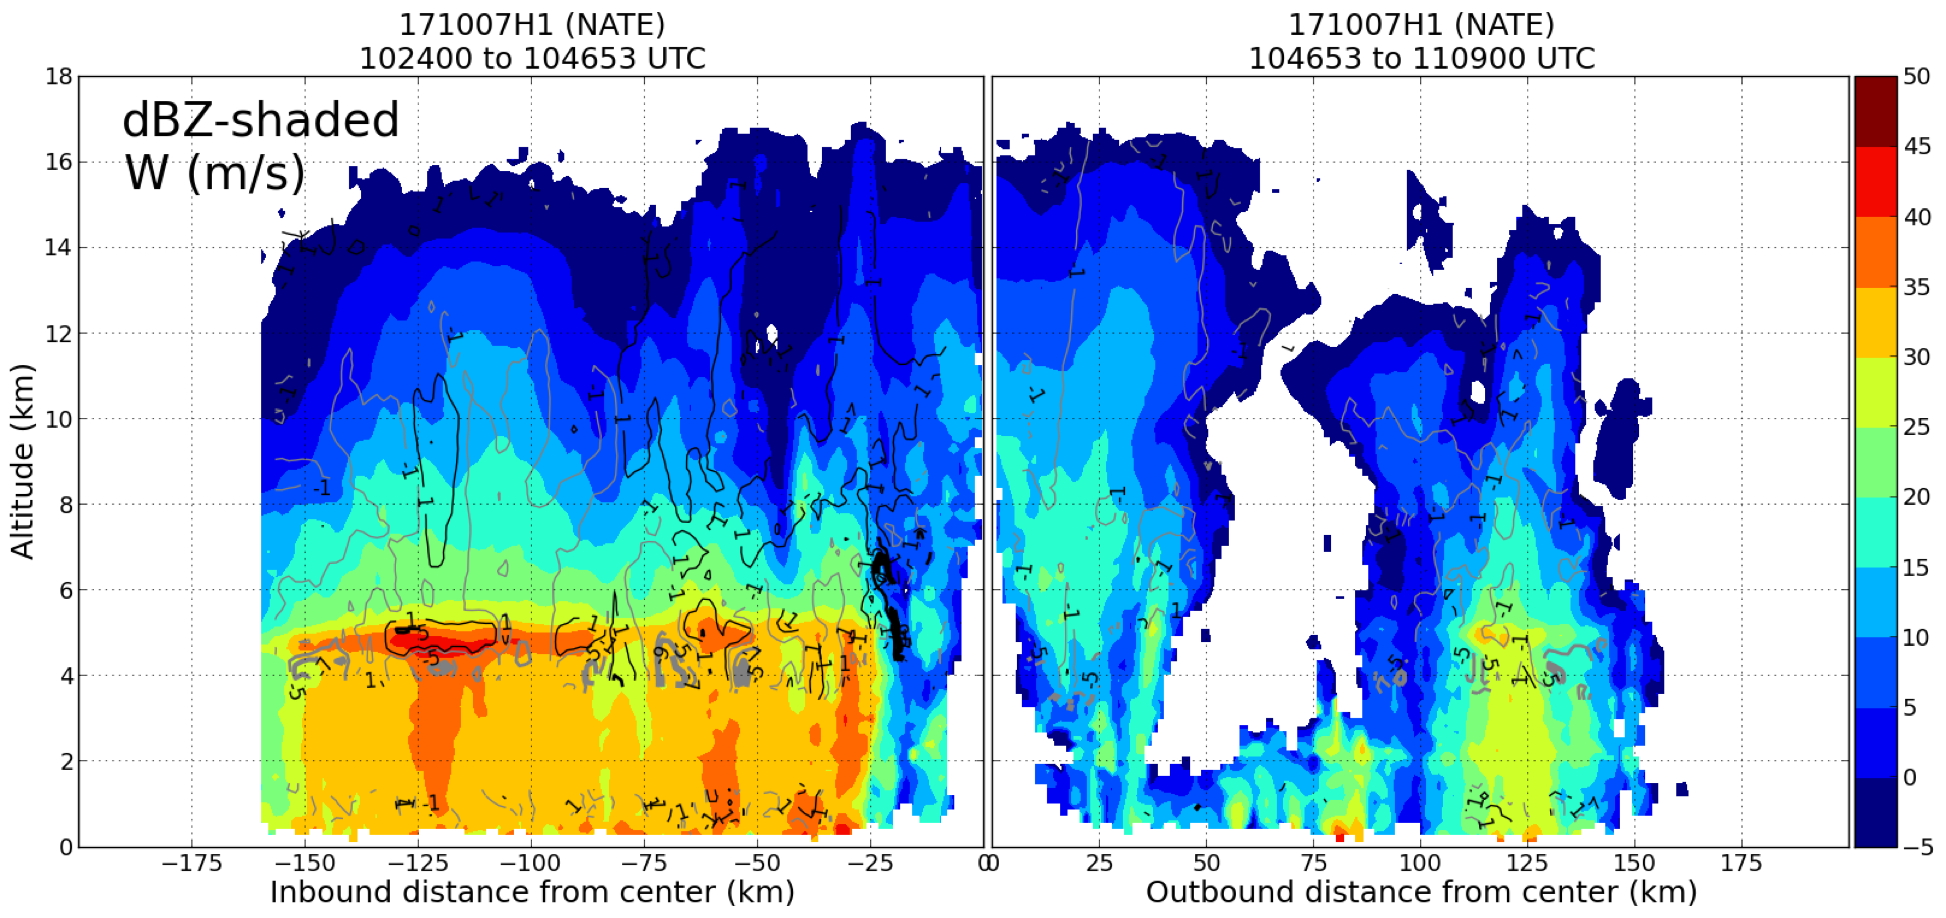
Figure 13. TDR vertical profile analysis of reflectivity (shaded, dBZ) and vertical velocity (contoured, m s-1) for the second pass (between the WP #3 to the E and WP #4 to the W), centered at 1046 UTC |
On the downwind to WP #7 to the NW of the storm, IR imagery indicated that there was new convective growth to the south / southeast (apparently DSR, downshear) side of the storm. We began focusing on that region for the convective burst module on the completion of the final pass. We arrived at WP #7 at 1229 UTC (Sonde #15 / AXBT #15) and encountered scattered moderate to deep convection in the area, but otherwise fairly clear conditions. We turned inbound on the 315° azimuth and released the midpoint combo at 1241 UTC (Sonde #16 / AXBT #16). Given the difficulties in fixing the center on the previous pass, we decided to simply release the sonde / AXBT combo on our closest approach (IR imagery near the time of the pass, Fig. 17; LF imagery, Fig. 18), which was 1251 UTC (Sonde #17 / AXBT #17). We missed the surface center slightly to the SW, according to the LF. On the outbound on the 135° azimuth, we dropped the midpoint combo early (about 20 nm from the center) at 1257 UTC, so that it would be released in convection (although we observed predominantly stratiform rain on this outbound leg, Fig. 19). We arrived at WP #8 at 1310 UTC (Sonde #19), and began to set up the legs for the convective burst module. The vertical reflectivity profile from this fourth pass is shown in Fig. 19.
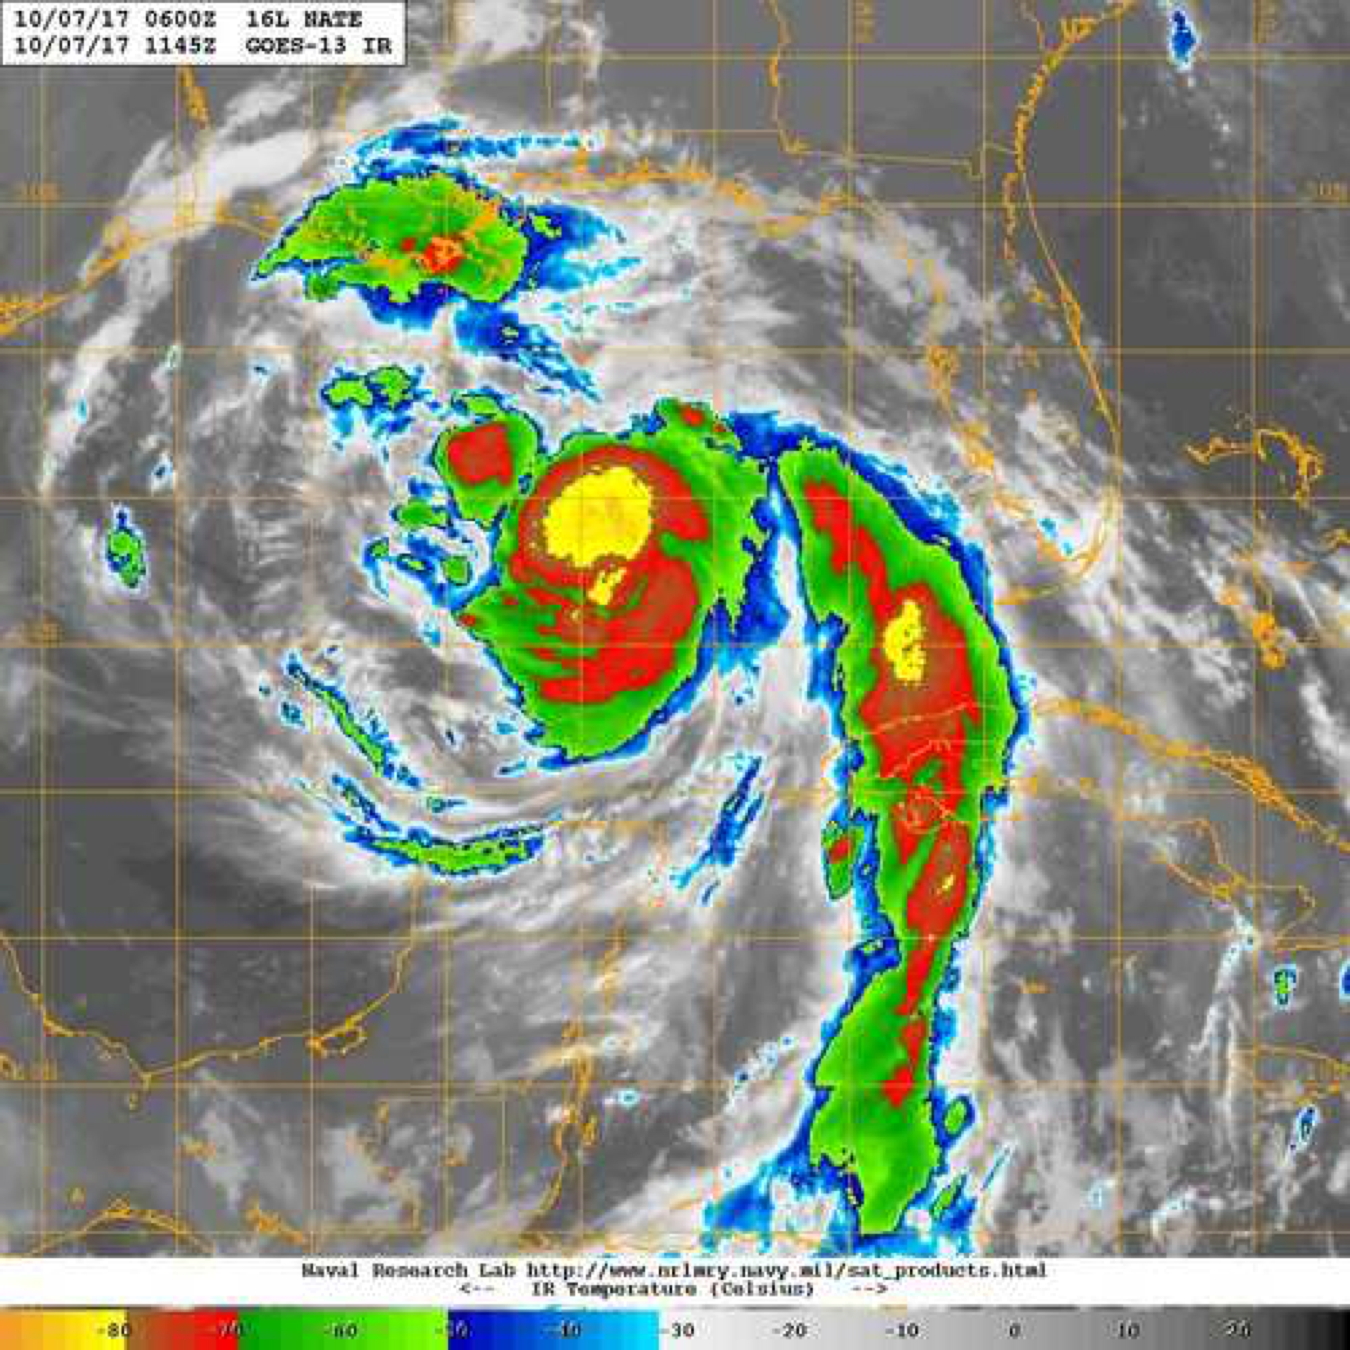
Figure 14. IR imagery at 1145 UTC 7 October, around the time of the third center pass (image courtesy the Naval Research Laboratory, nrlmry.navy.mil/TC.html) |
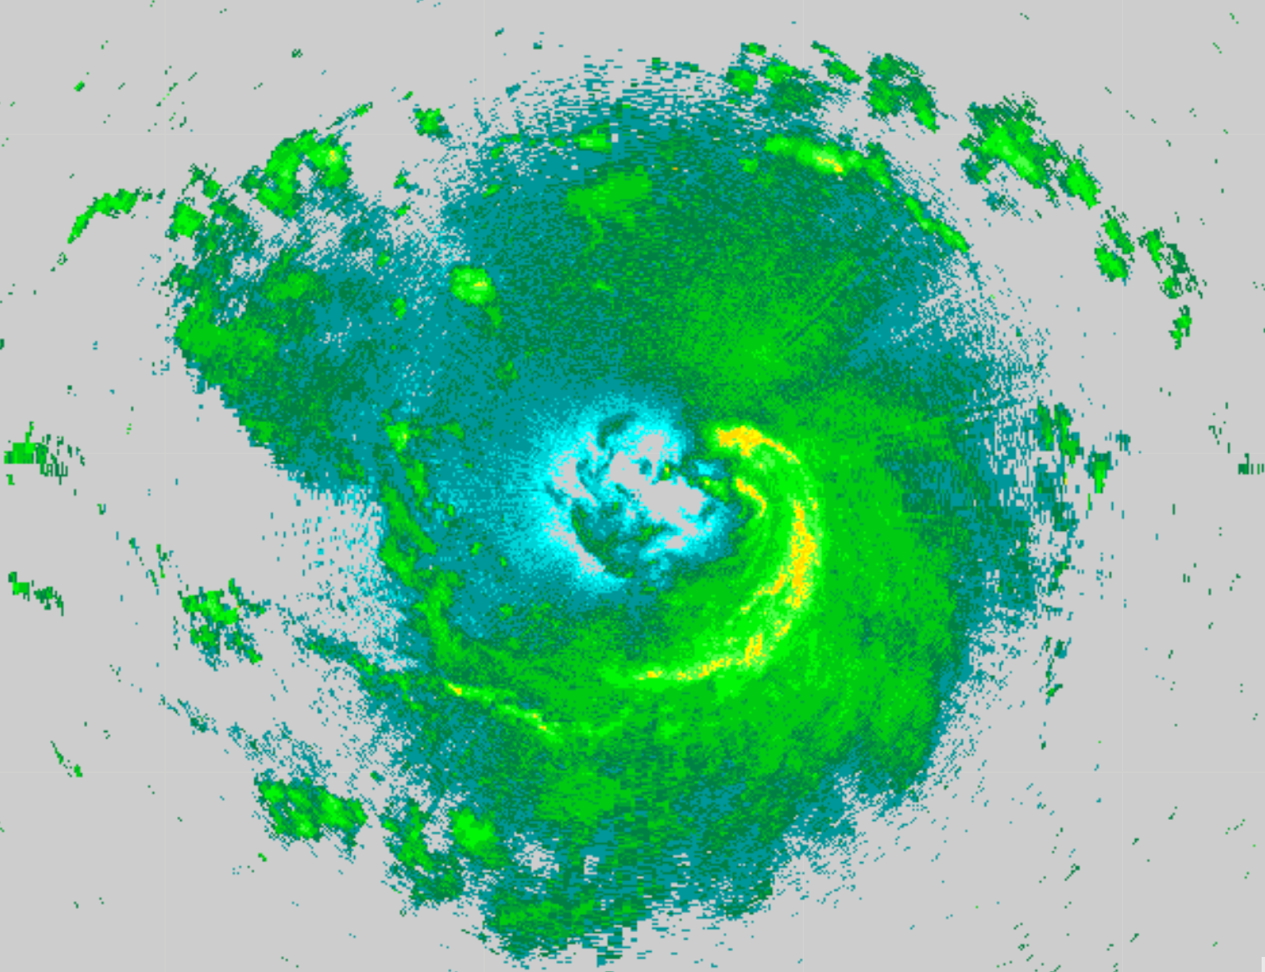
Figure 15. LF imagery at 1148 UTC 7 October |

Figure 16. TDR vertical profile analysis of reflectivity (shaded, dBZ) and vertical velocity (contoured, m s-1) for the third pass (between the WP #5 to the SW and WP #6 to the NE), centered at 1147 UTC |
As the storm was moving north fairly rapidly (~25 kt), and that we had encountered mainly stratiform rain to the SE of the center on the previous outbound (Fig. 19), we flew downwind prior to turning towards the center. Our first inbound leg was on a heading of 290°. Within the eastern eyewall, we encountered moderate turbulence, 35-dBZ echo tops to 12 km, and SMFR surface winds up to 80 kt. If the shear were, in fact, northwesterly, then this sampled area would be downshear, downshear left. We released a sonde / AXBT combo radially outward (at 1329 UTC, Sonde #20 / AXBT #19; AXBT reported 27.17°C) and inward of the eyewall (at 1332 UTC, Sonde #21 / AXBT #20; the AXBT did not report data). Once in the "eye", we maintained a NNW heading and painted the NE eyewall (presumably, upshear left). The TDR indicated very deep convection, with echo tops to 18 km, along this eyewall. Once clear of the eyewall (for hazard avoidance), we turned to a 060° heading at 1342 UTC north of the center, which allowed us to safely exit to the northeast of the storm. Once we encountered high enough winds (> 15 m/s surface winds according to SFMR) and scattered or better cloud conditions below the aircraft, we started the SFMR high-incidence angle module. We started the module near 27°6'N / 87°52'W at 1351 UTC (Sonde #22 / AXBT #21) with scattered to broken clouds below, and 42 kt surface winds; there were three circles at 30° bank angle, and five circles at 45° bank angle (left turns).
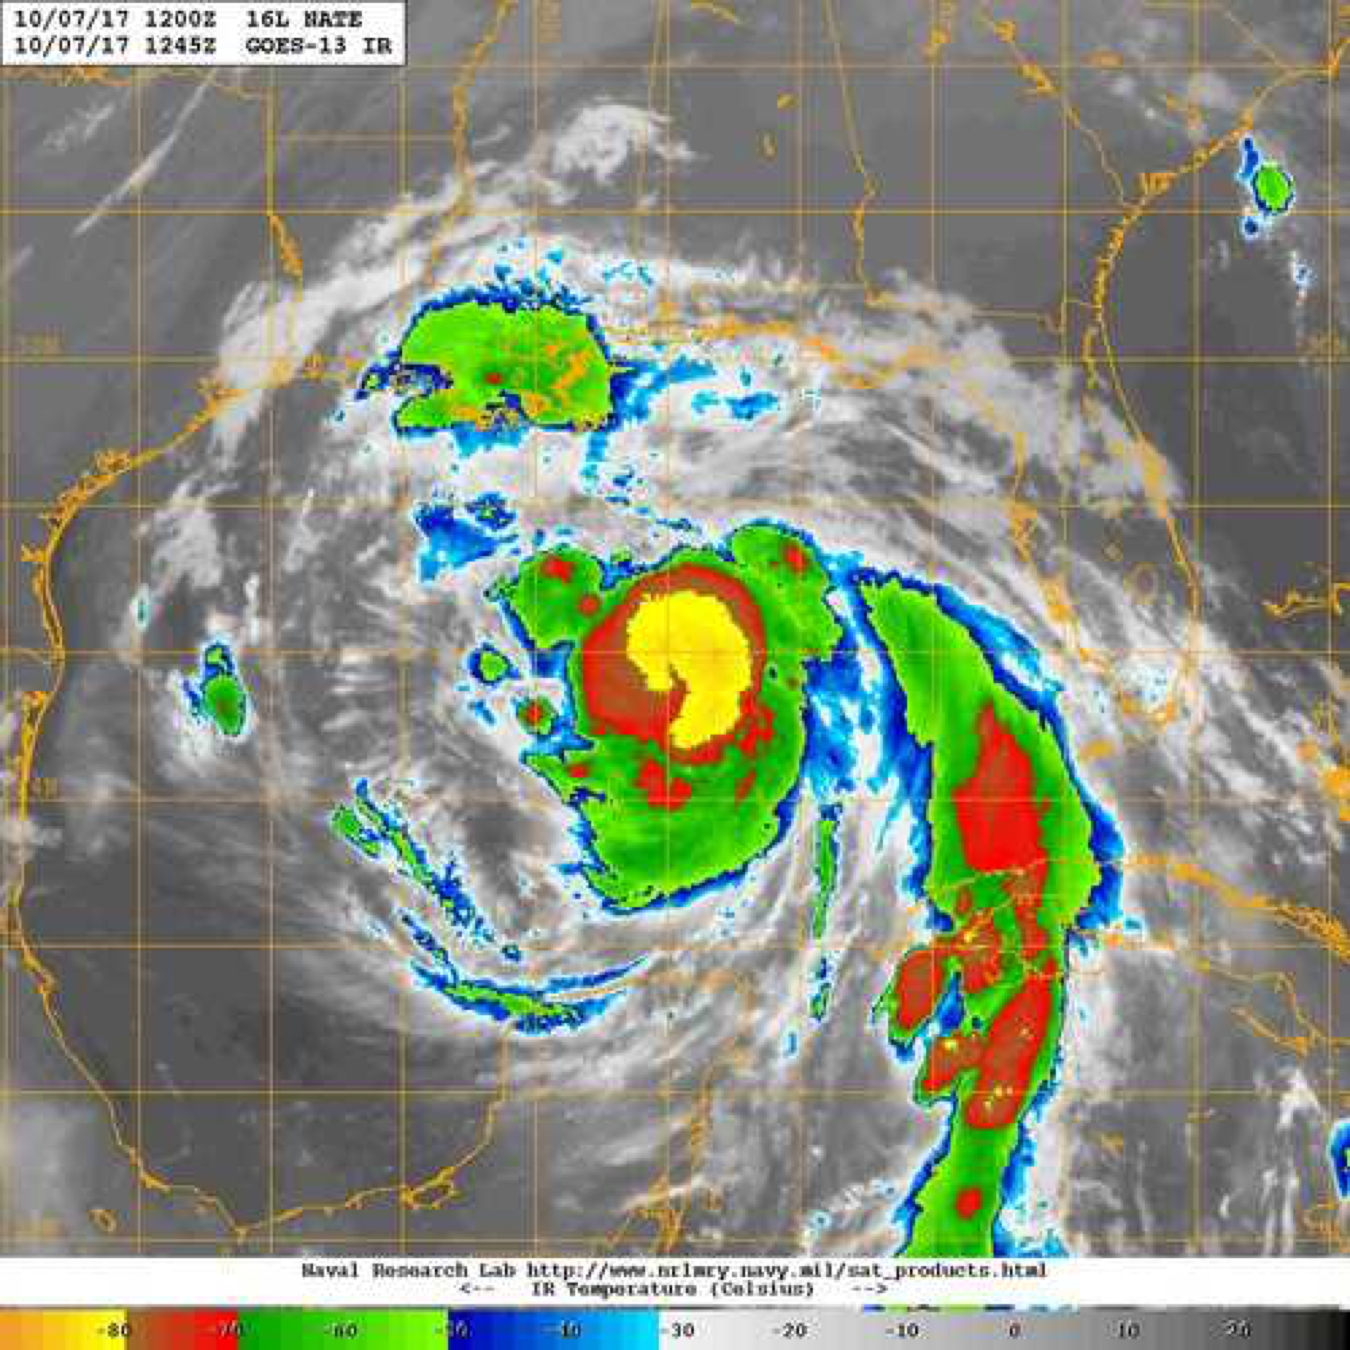
Figure 17. IR imagery at 1245 UTC 7 October, around the time of the fourth center pass (image courtesy the Naval Research Laboratory, nrlmry.navy.mil/TC.html) |
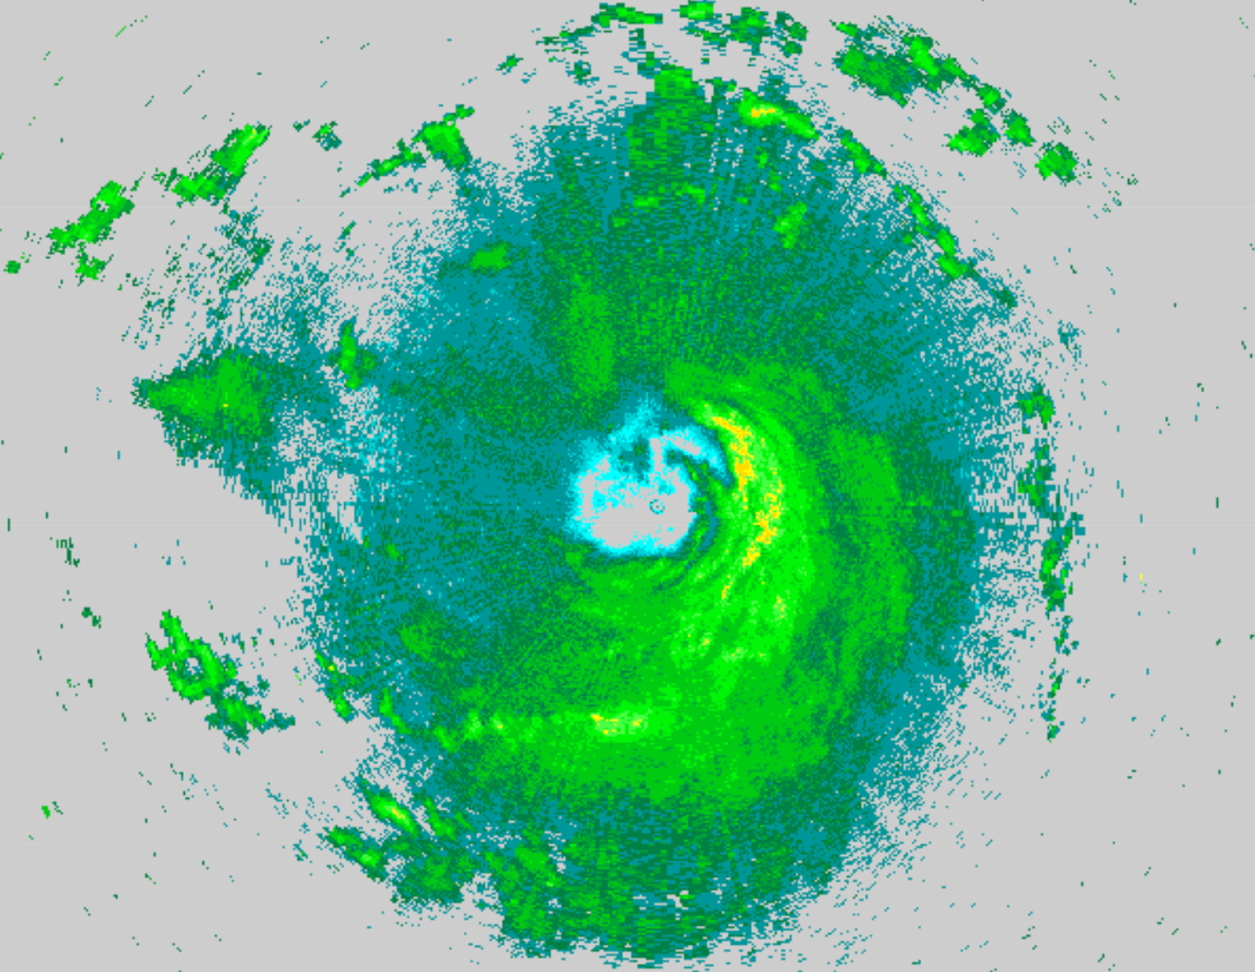
Figure 18. LF imagery at 1252 UTC 7 October |
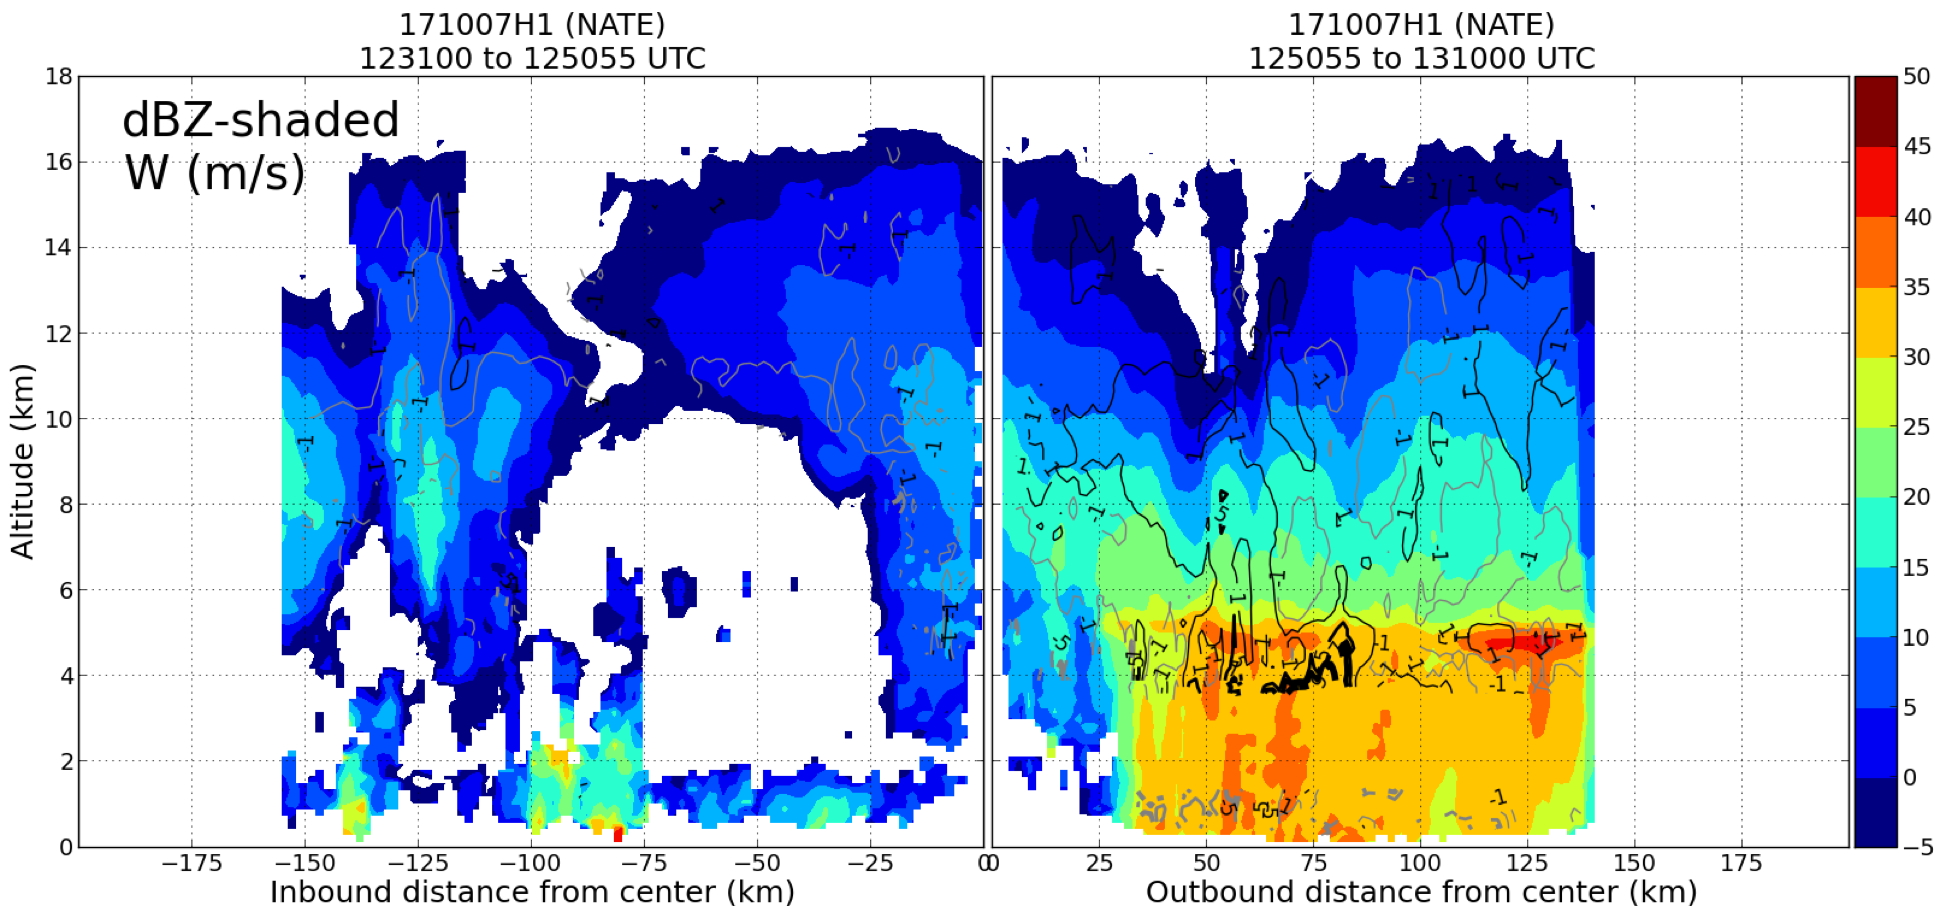
Figure 19. TDR vertical profile analysis of reflectivity (shaded, dBZ) and vertical velocity (contoured, m s-1) for the fourth center pass (between the WP #7 to the NW and WP #8 to the SE), centered at 1250 UTC |
Mission Evaluation:
Nate appeared to continue to slowly intensify while we were in the storm, with the official intensity being increased from 70 kt upon arrival to 80 kt by the end of the mission. The strongest winds, as expected given the 20-25 kt forward motion, were on the eastern and northeastern sides of the storm. The precipitation within the inner core remained asymmetric, with precipitation predominantly on the southern to northeastern sides of the storm. For the SHIPS shear direction this corresponded to precipitation being predominantly upshear. It, however, appears that the deep-layer shear direction was more northwesterly, which meant the precipitation distribution in Nate was primarily downshear right to upshear left. Little precipitation or deep convection was observed to the west and northwest, with predominantly only shallow cloud and isolated moderately deep-to-deep convective clouds. The peak FL wind observed during the mission was 90-95 kt, while the peak surface from SFMR was ~80 kt, albeit in heavy rain.
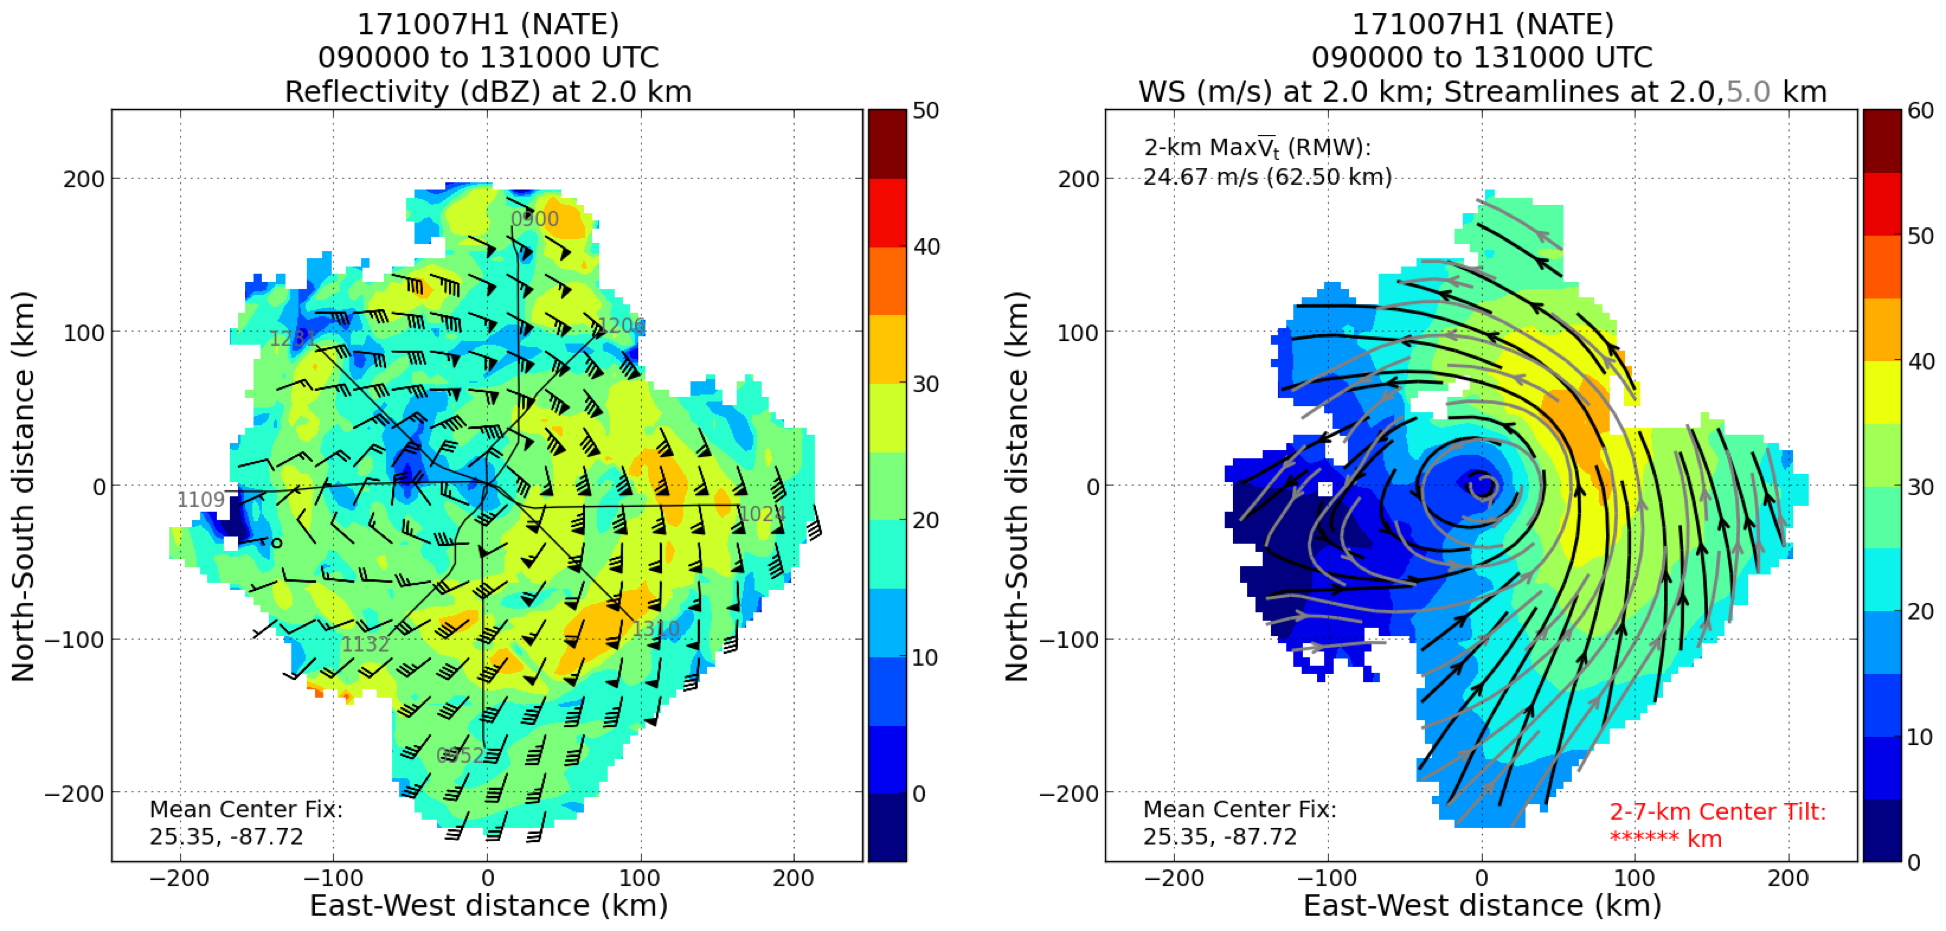
Figure 20. Plan view of reflectivity (dBZ, shaded) at 2 km (left image), as well as the windspeed retrieval at 2 km (shaded) and streamlines at 2 (gray) and 5 (black) km from the TDR |
We were able to complete the rotated Figure-4, which was a challenge given the 20-25 kt motion of the storm. Targets for the convective burst module were not as good after completing the first Figure-4, but it was apparent from GOES-16 imagery that a new downshear right burst was developing to the south/southeast of the center, and that burst could be sampled on the inbound on 225° from the southwest, and subsequently on the outbound on 135° after the final pass. After the final pass when then planned to then re-enter the burst area where we would begin an abbreviated convective burst module. On the outbound from the center on 135°, we encountered primarily stratiform rain, so we decided at the endpoint to go further downwind before entering on a 290° towards the center. This allowed us to sample the more convective part of the eyewall burst left of shear. We dropped a sonde/AXBT combo release on either side of the eyewall, and then proceeded northwestward through the center, all the while painting 18 km echo tops in the TDR in the northeast and northern eyewall. In order to not go through that convection we held track until we could safely take an outbound heading of 060° to exit the eyewall and storm. Once through, we found an area with high winds (> 40 kt) with scattered clouds below, and successfully completed three 30° circles and five 45° circles for the SFMR high incidence angle module. Upon exiting the storm, inner core precipitation still was not symmetric, with an open eyewall to the west and northwest (presumably right of shear to upshear right). Future research into this case should vary the shear calculation to determine what deep-layer shear Nate was actually experiencing. It's clear that parsing the relative influence of the rapid forward motion and vertical wind shear on the storm precipitation distribution and structure could be an interesting research topic.
Overall, we successfully completed a rotated Figure-4, consistent with the previous two P-3 missions (sampling strategy was consistent flight to flight), which contributed 4 TDR analyses. Sonde/AXBT combos were released at turn points, midpoints, and 3 of the 4 centers. We also released a couple extra sonde/AXBT combos in the abbreviated convective burst module, as well as one at the beginning of a successful SFMR high-incidence angle module. The convective burst module was not extensive, but we appeared to sample well the left of shear convective burst from a stratiform area in the southeast eyewall (presumably downshear left) to very deep convection in the northeast eyewall (presumably upshear left).
Problems :
As for problems, we did not have enough time to do a more extensive convective burst module or high-altitude circumnavigation. The DWL computer once again did not have power (even though it did for the previous P-3 mission, 171006H2), and 11 of the 21 AXBTs did not report data (these were primarily channel 14 and 16 AXBTs).
Jon Zawislak
Oct. 16, 2017
| NetCDF SFMR data | |
Timeseries wind, rain rate, and pressure plots |
|
Flight level wind plots full flight |

Flight level wind plots in storm |
SFMR wind plots full flight |
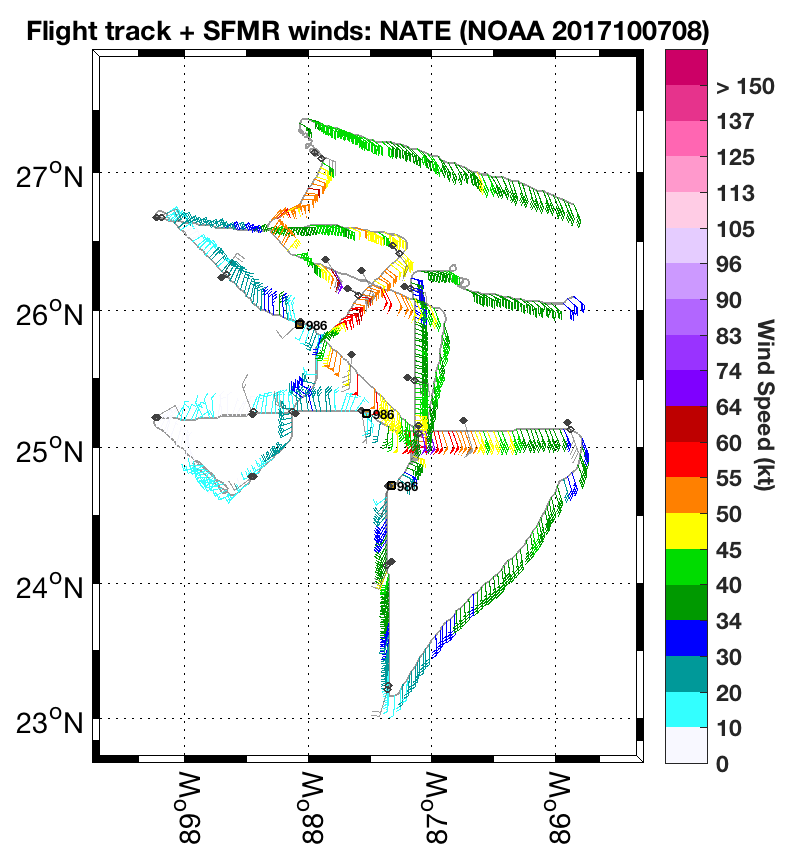
SFMR wind plots in storm |
 Flight track |
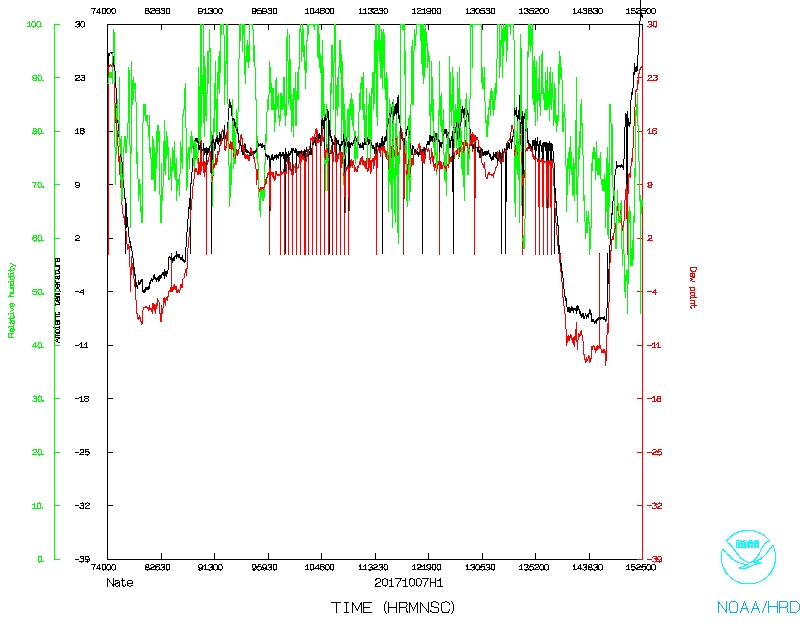 Temperature and Moisture |
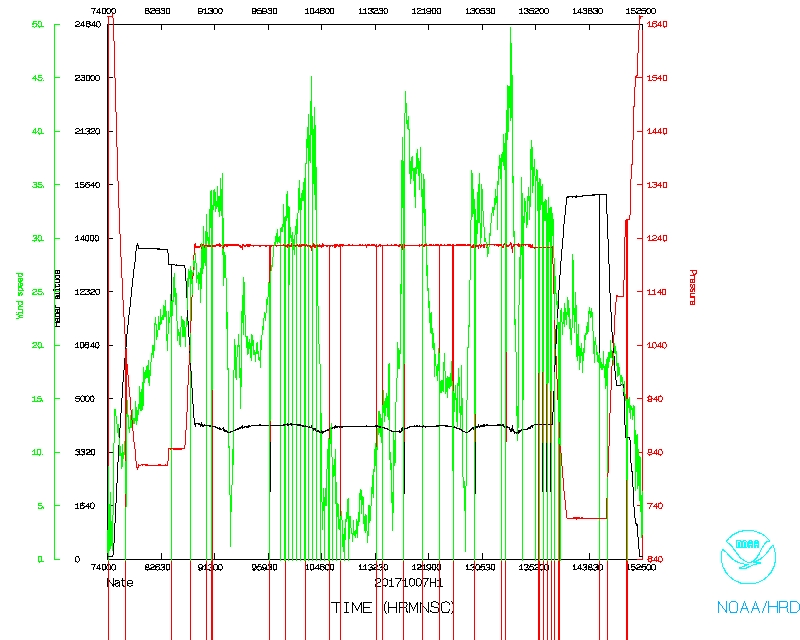 Wind and Atlitude |
 Flight track detail |
Flight Director's manifest
Flight Director's log |
serial data
LPS log |
Radar log |
Drop log |
AXBT log |
DWL log