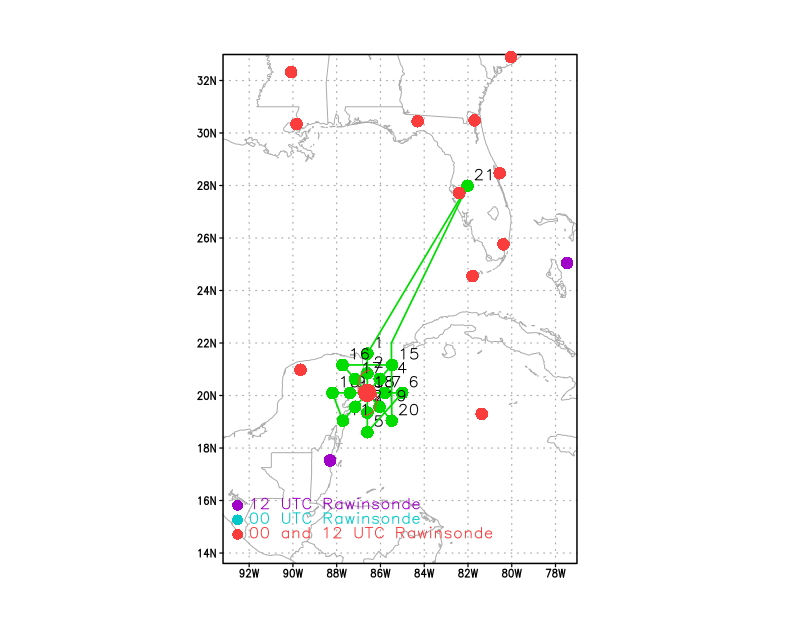
Proposed flight track for 20171006H2 |
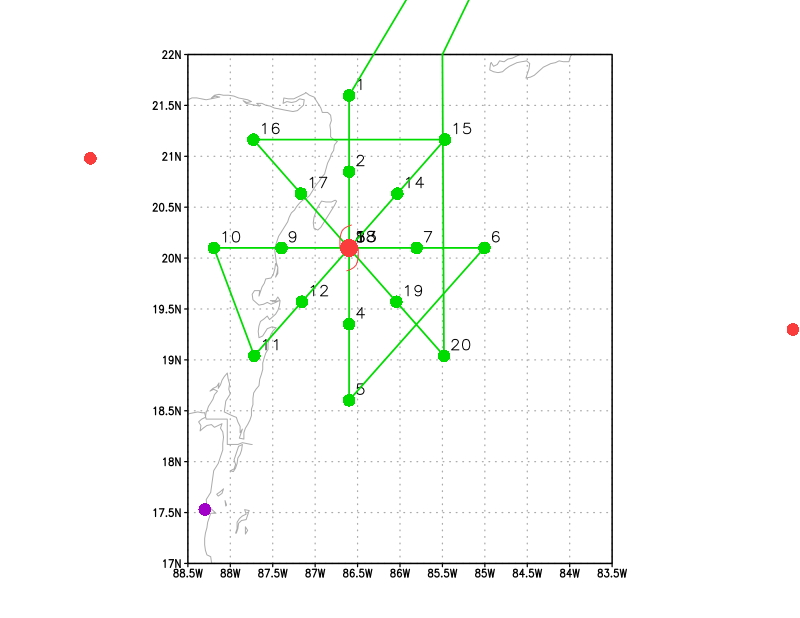
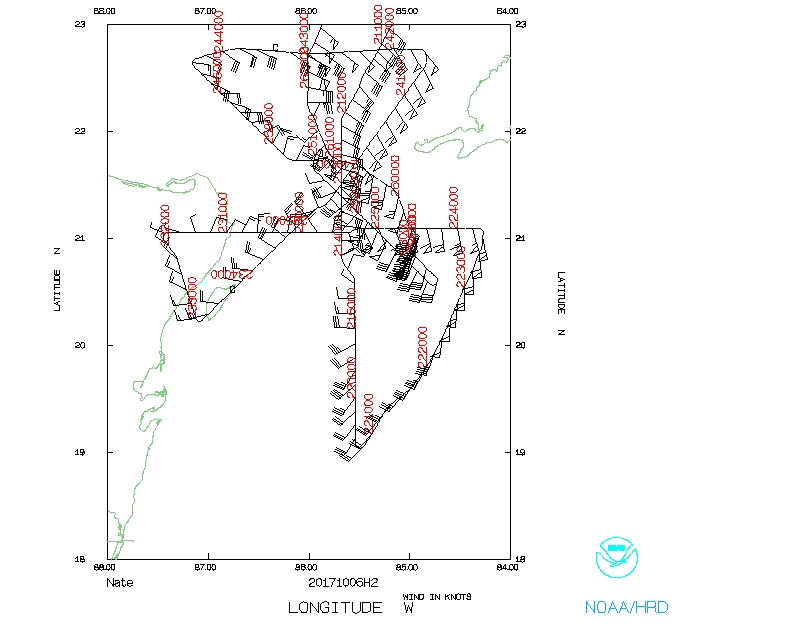
Detail of proposed flight track for 20171006H2 |
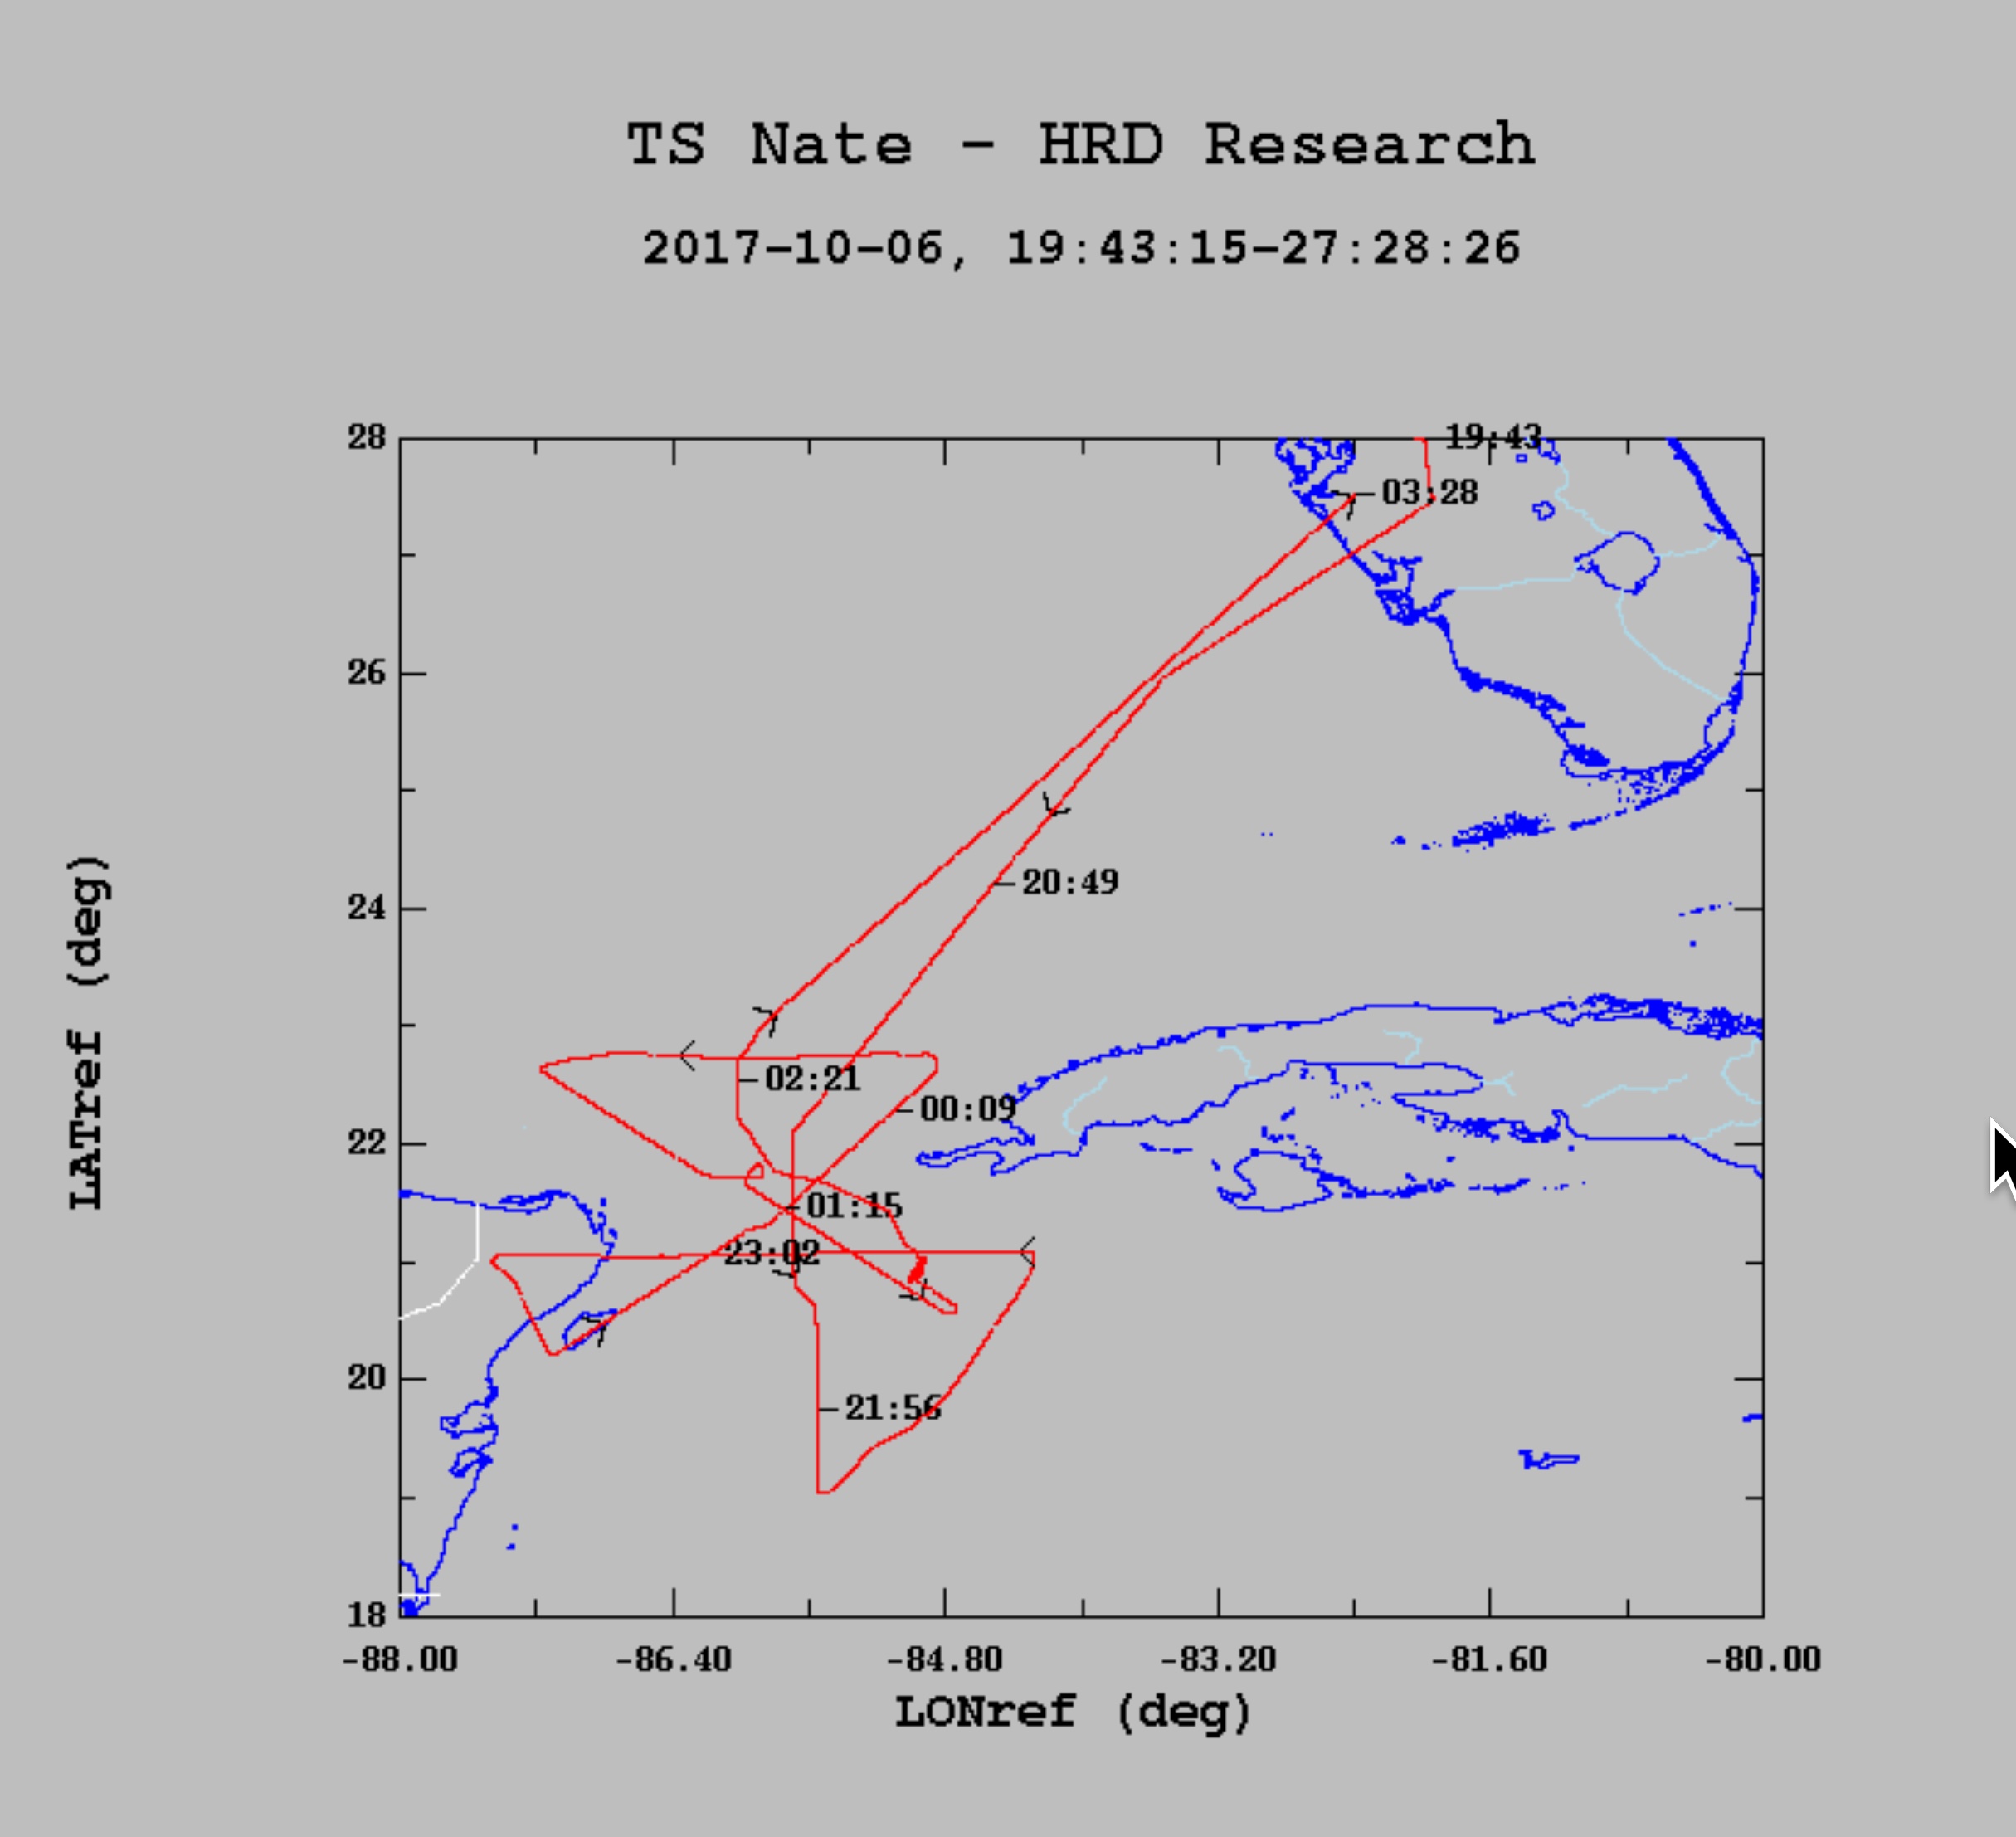
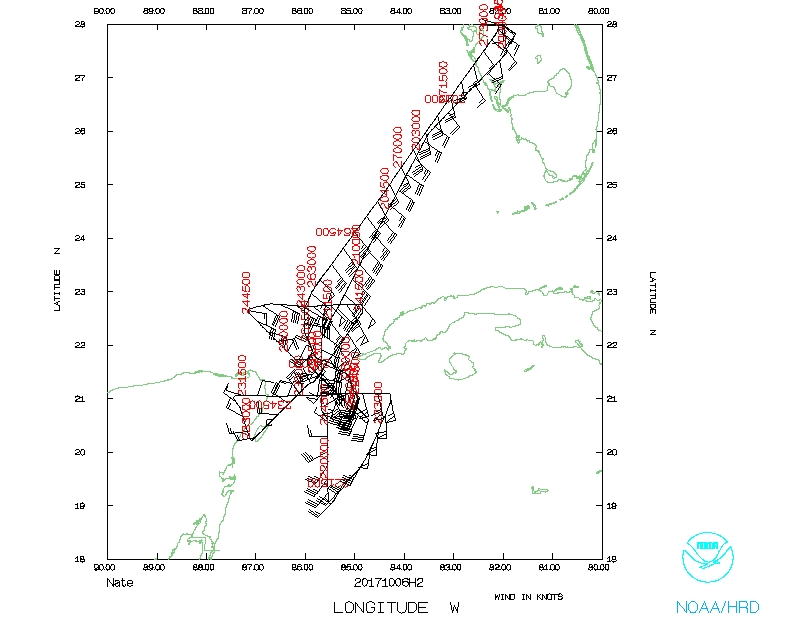
Actual flight track for 20171006H2 |
| Aircraft Commander | Scott Price |
| Co-pilot | Mitchell |
| Co-pilot | Rees Richards |
| Flight Engineer | Ken Heystek |
| Flight Engineer | Mike Sanchez |
| Navigator | Sam Urato |
| Flight Director | Jess Williams |
| System Engineer | James Warnecke |
| Data Technician | Mike Mascaro |
| Dropsonde Operator | Patel |
| Lead Scientist | Rob Rogers | HRD |
| Radar Scientist | Leon Nguyen | HRD |
| Dropsonde Scientist | Jason Dunion | HRD |
| AXBT Scientist | Benjamin Jaimes | UMiami |
| AXBT Scientist | Jun Zhang | HRD |
| Observer | Brian Richards | Unk |
Mission Plan :
|
Proposed flight track for 20171006H2 |
Detail of proposed flight track for 20171006H2 |
Actual flight track for 20171006H2 |
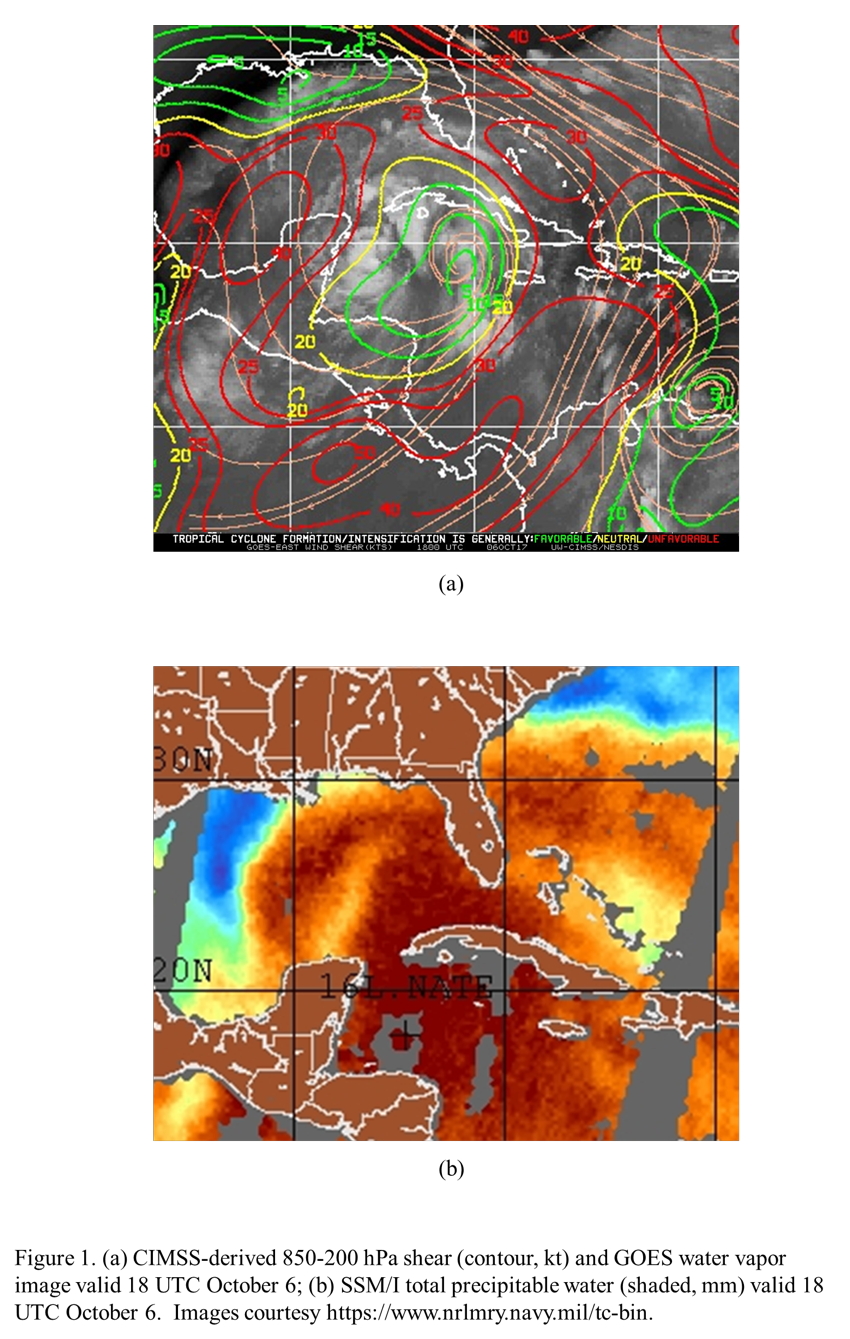
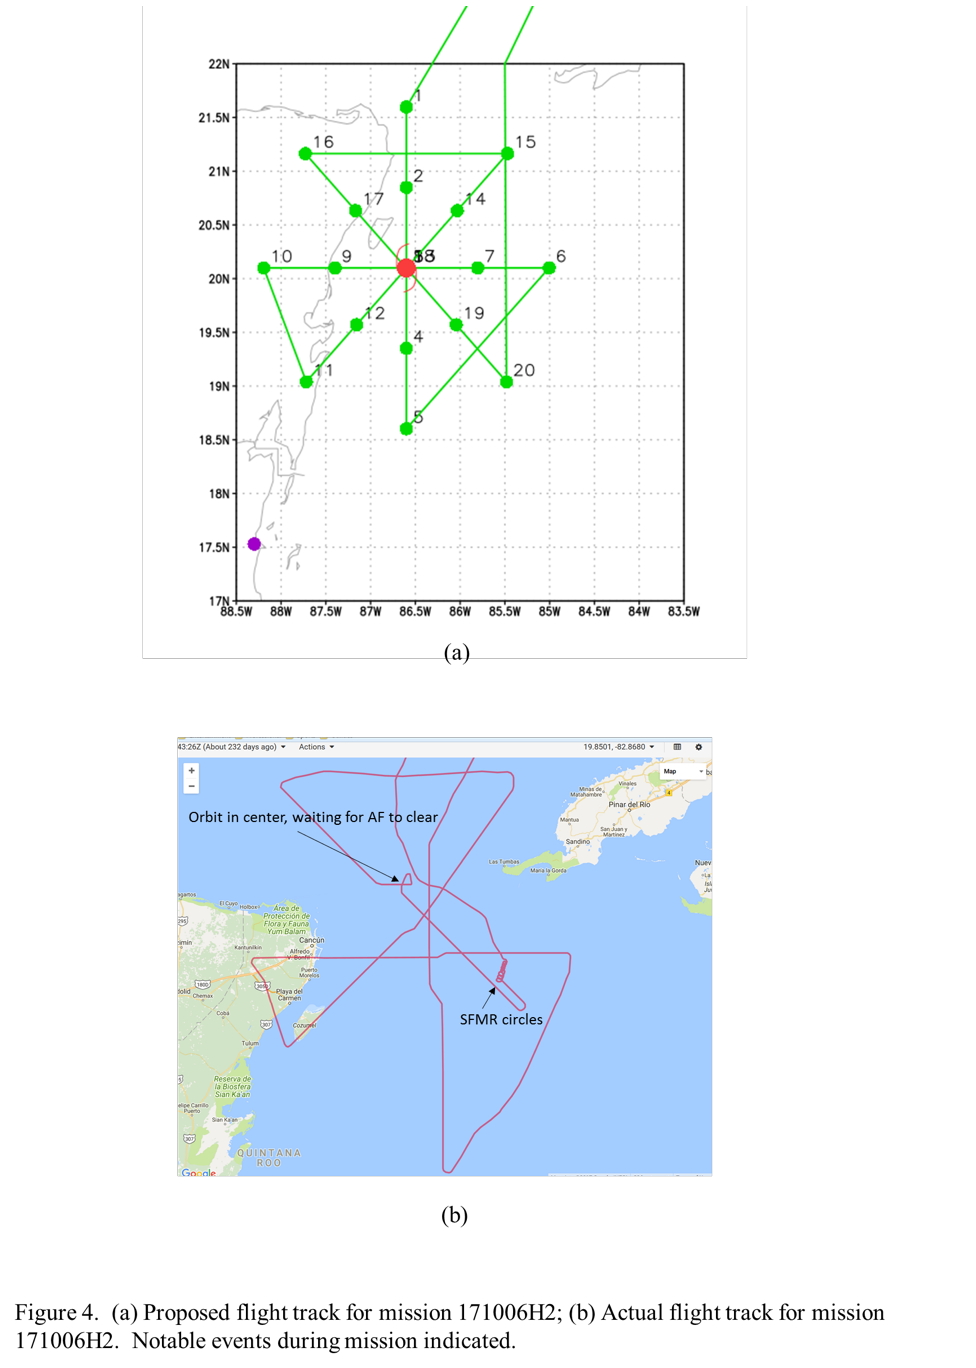
Perform an AIPEX mission into TS Nate. Nate is a 45-kt tropical storm located in the northwest Caribbean, having emerged from Honduras ~12-18 h previously. The storm is asymmetric, with peak winds well-removed from the center on the east side. The environment (Fig. 1) shows a rather complex pattern, with Nate located in a region of relatively low southwesterly shear (~10 kt from CIMSS analysis for 850-200 hPa shear), but in a region of high shear gradient. The total precipitable water field (TPW) shows high TPW values around Nate, indicating the low- to mid-levels are moist. Satellite imagery (Fig. 2) shows cold cloud tops and significant cloudiness near the center and on the southwest side. Significant ice scattering, indicative of deep convection, is also seen west and south of the center. Assuming that the shear is coming from the southwest, that would suggest that much of this precipitation is already on the upshear side of the storm. Track guidance (Fig. 3) was in good agreement that Nate would continue toward the northwest, into the southeastern Gulf of Mexico and the northern Gulf. Given an apparently favorable large-scale environment, most guidance continued to predict that Nate would slowly strengthen to a strong tropical storm or Category 1 hurricane within 24-36 hours. It should be noted that Nate was moving toward the north-northwest at ~18 kt - fast forward motion.
The plan called for conducting a rotated figure-4 pattern (Fig. 4), with 105 nm leg lengths and an initial point (IP) on the north side. Dropsondes would be released at all turn and midpoints, plus the first and last center pass. AXBTs would be released at all midpoints, plus the first and last center drop, and one at the IP. If time permits, conduct a series of banking maneuvers to collect SFMR measurements at off-nadir. This would likely occur on the southeast side.
The pattern would be flown at 10,000 feet pressure altitude.
|

|
|
Prepared by the Hurricane Research Division October 06, 2017 Aircraft: N42RF Proposed takeoff: 06/2000Z
DROP LOCATION TABLE
| #
| LAT
| LON
| RAD/AZM
| TIME
|
| deg min
| deg min
| nm deg
| (hh:mn)
| 1S | 21 36 | 86 36 | 90/000 | 1:25
| 2I | 20 51 | 86 36 | 1:37
| 3I | 20 06 | 86 36 | 1:49
| 4I | 19 21 | 86 36 | 2:00
| 5S | 18 36 | 86 36 | 90/180 | 2:11
| 6S | 20 06 | 85 00 | 90/090 | 2:44
| 7I | 20 06 | 85 48 | 2:56
| 8I | 20 06 | 86 36 | 3:07
| 9I | 20 06 | 87 24 | 3:18
| 10S | 20 06 | 88 12 | 90/270 | 3:29
| 11S | 19 02 | 87 43 | 90/225 | 3:47
| 12I | 19 34 | 87 09 | 4:00
| 13I | 20 06 | 86 36 | 4:11
| 14I | 20 38 | 86 02 | 4:22
| 15S | 21 10 | 85 28 | 90/045 | 4:33
| 16S | 21 10 | 87 44 | 90/315 | 5:05
| 17I | 20 38 | 87 10 | 5:18
| 18I | 20 06 | 86 36 | 5:29
| 19I | 19 34 | 86 03 | 5:40
| 20S | 19 02 | 85 29 | 90/135 | 5:51
| | ||||||||||||||||||||||||||
Mission Summary :
| Take off | Landing
| Linder-Lakeland, FL
| 19:52 UTC
| Linder-Lakeland, FL
| 03:39 UTC
| | ||

|
|
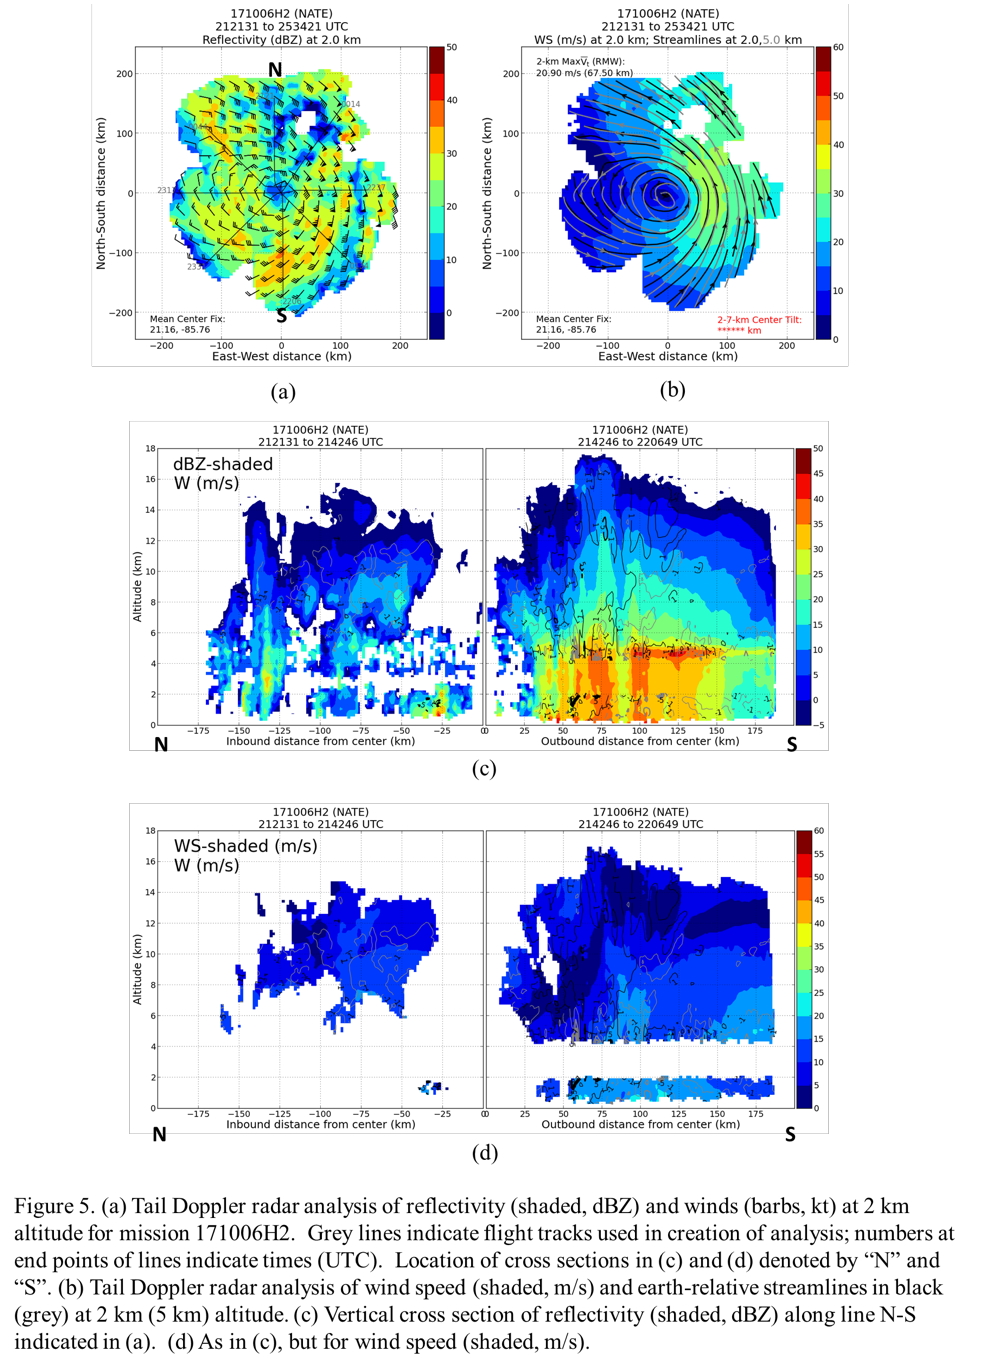
The storm was slowly intensifying and trying to become more symmetric in terms of its precipitation distribution. It was still, however, highly asymmetric in terms of its wind field. Real-time radar analysis shows the relatively symmetric distribution of reflectivity at 2-km altitude (Fig. 5a), while the wind field displays a pronounced wavenumber-1 asymmetry maximized on the east side (Fig. 5b). Vertical cross sections of reflectivity (Fig. 5c) and wind speed (Fig. 5d) on the first, north-south center pass show that the deepest reflectivity is located on the south side of the storm. Much of this precipitation appears to be stratiform precipitation with embedded convective elements (e.g., at 75 and 100 km from the center on the south side). On the north side there is more widespread coverage of shallow to moderately-deep convection. The coverage of wind speed is severely limited in these profiles due to a 3-km gap in the radar analyses of wind retrievals, so little can be inferred in terms of the wind speed from this particular cross section.
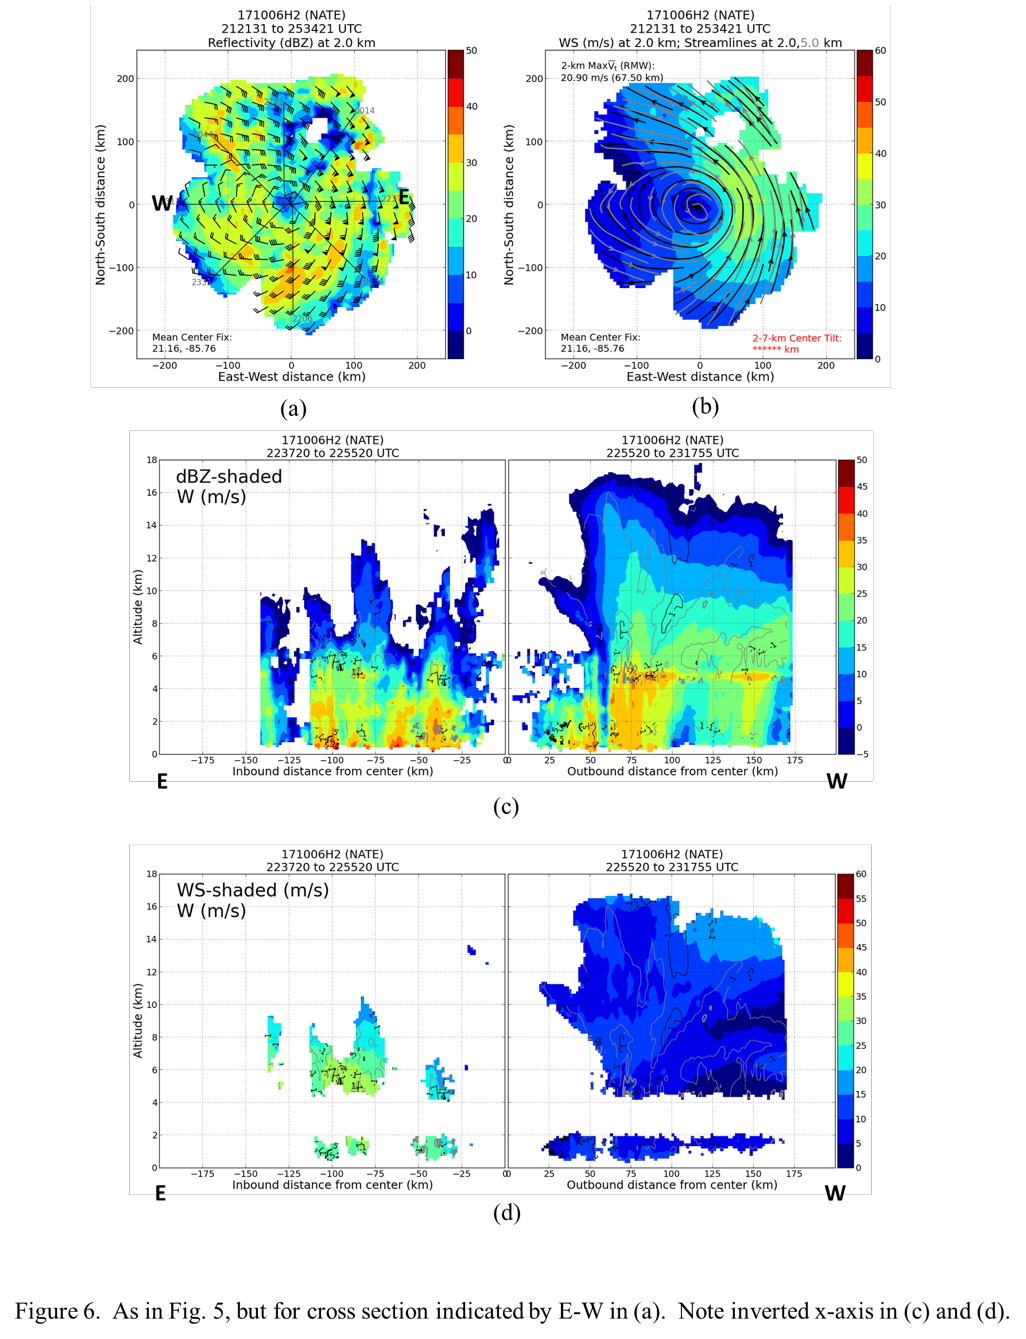
The east-west cross sections (Fig. 6) show that the shallower reflectivity is on the east side of the storm, while the deeper reflectivity is on the west. Similar to the north-south cross section, the shallower reflectivity (east side) appears to consist of shallow to moderately deep convection, while the deeper reflectivity on the west side is mostly stratiform with embedded deep convection with echo tops extending up to 16 km. The cross section of wind speeds clearly shows the wavenumber-1 asymmetry in wind speeds here, with much stronger winds on the east side, even with the 3-km gap in the analyses.
|
|
The azimuthal distribution of precipitation, and its vertical structure, that can be inferred from these cross sections is consistent with the satellite imagery shown earlier (cf. Fig. 2). Deep convection is on the south and west side of the storm, while much less vertically-extensive precipitation is on the north and east side. If the storm were truly experiencing southwesterly vertical shear, this would suggest that the shallow, weaker precipitation is on the downshear side of the storm, while the deeper, stronger convection is on the upshear side. This is counter to most conceptual models of tropical cyclones in shear, and suggests that the storm is in fact likely experiencing northeasterly shear. The complexity of the shear pattern seen in Fig. 1 may be part of the reason for this uncertain shear environment. Land interactions due to proximity to the Yucatan peninsula may be clouding some of this signal, but the storm is far enough away from land (cf. Fig. 4b) that this seems unlikely.
Regardless, the vortex is nearly completely aligned (cf. Fig. 5b), despite the presence of substantial asymmetries, particularly in the wind field and the azimuthal variation in precipitation mode and depth. Perhaps much of this asymmetry is due to the fast translational speed of the storm. Nonetheless, the storm is getting better organized. By the end of the mission and eyewall appeared to be forming, with deep convection appearing on the northeast side of the storm.
Mission Evaluation:
The mission generally was a success. A total of 18 drops were released, with four good radar passes, and 11 AXBTs that mapped out the thermodynamic and kinematic fields in this slowly intensifying, yet asymmetric, storm. The storm is fast-moving, which may be making it harder to symmetrize. The DWL was having some problems with scanning.
Problems :
The DWL was having problems scanning. Otherwise everything else worked well.
| NetCDF SFMR data | |
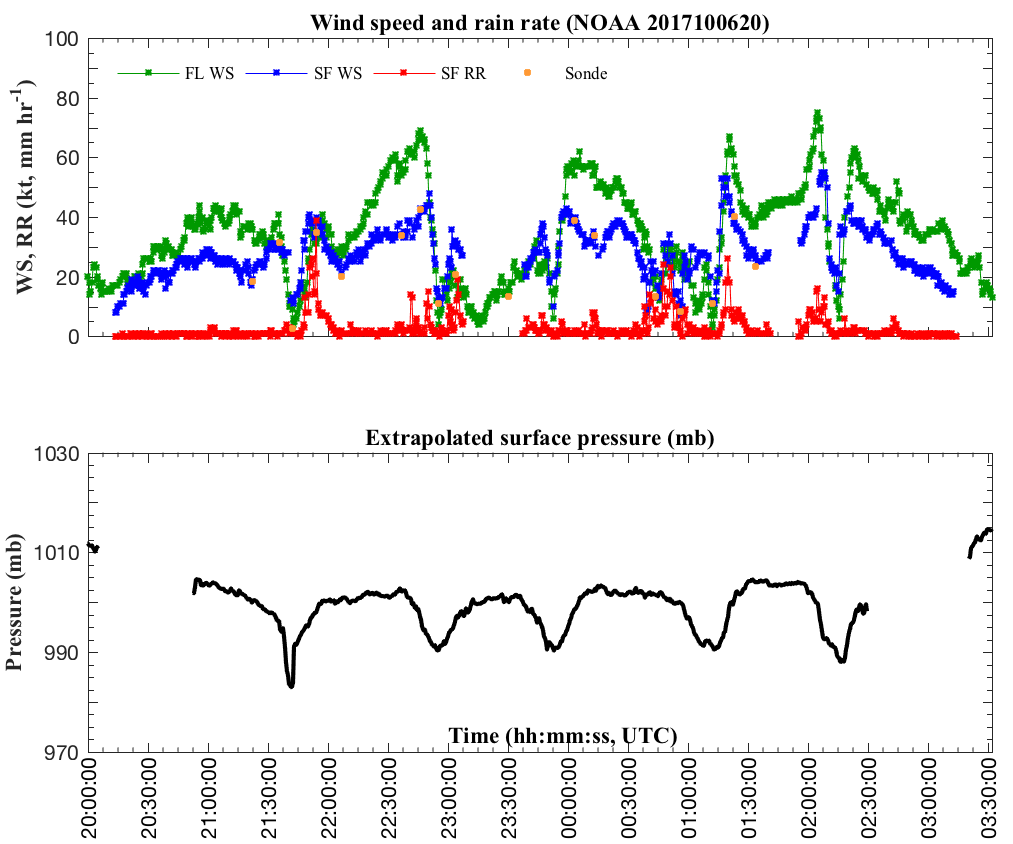
Timeseries wind, rain rate, and pressure plots |
|
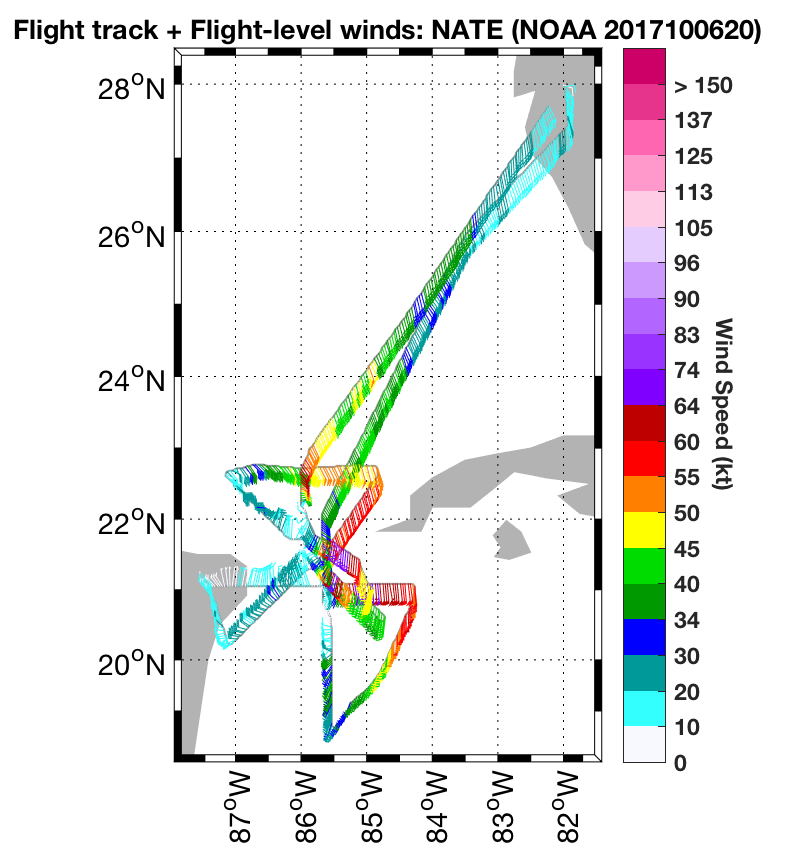
Flight level wind plots full flight |
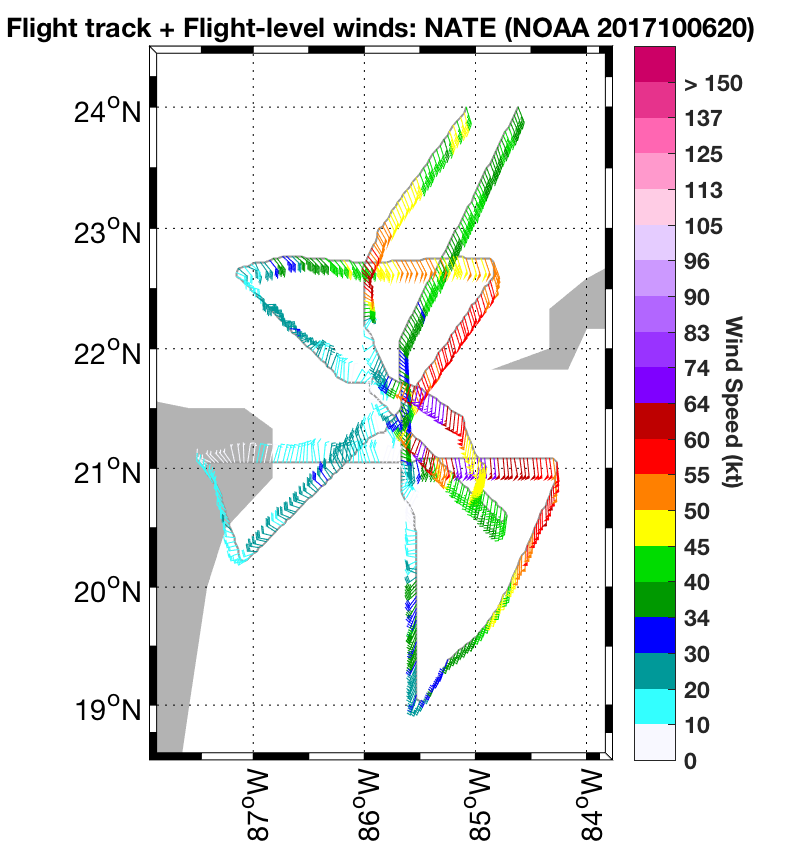
Flight level wind plots in storm |
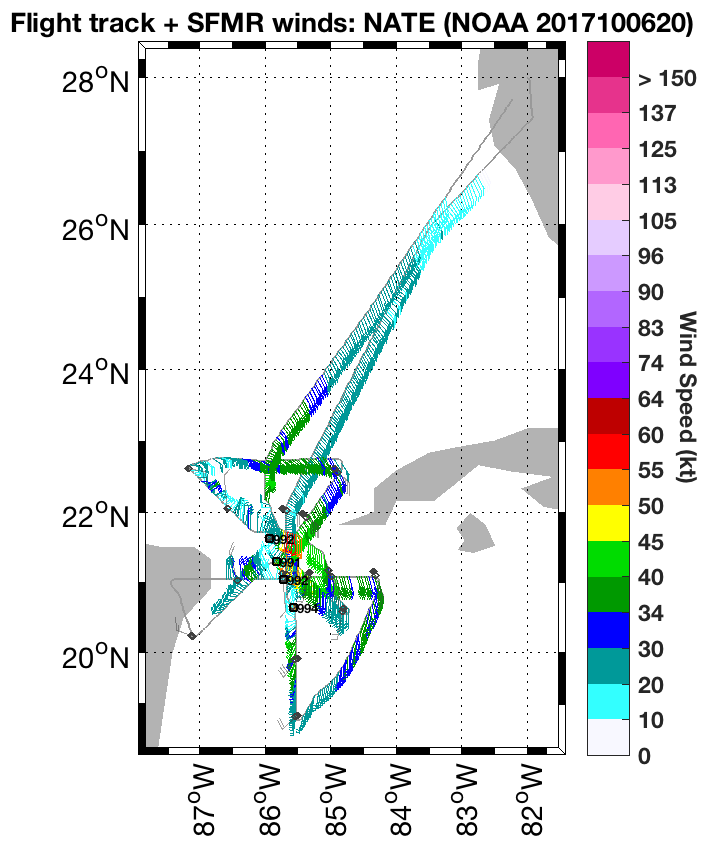
SFMR wind plots full flight |
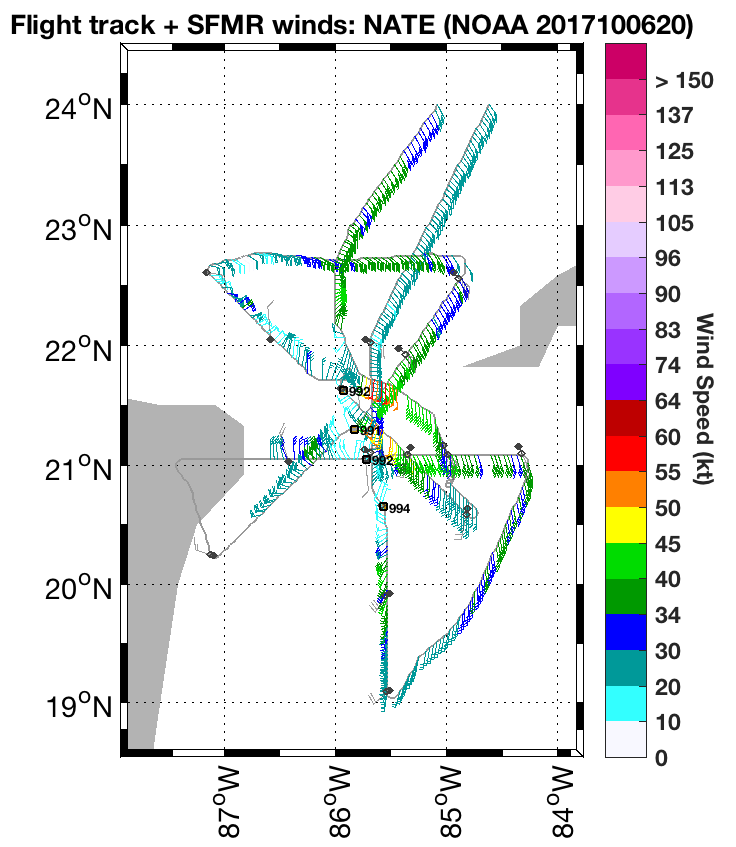
SFMR wind plots in storm |
 Flight track |
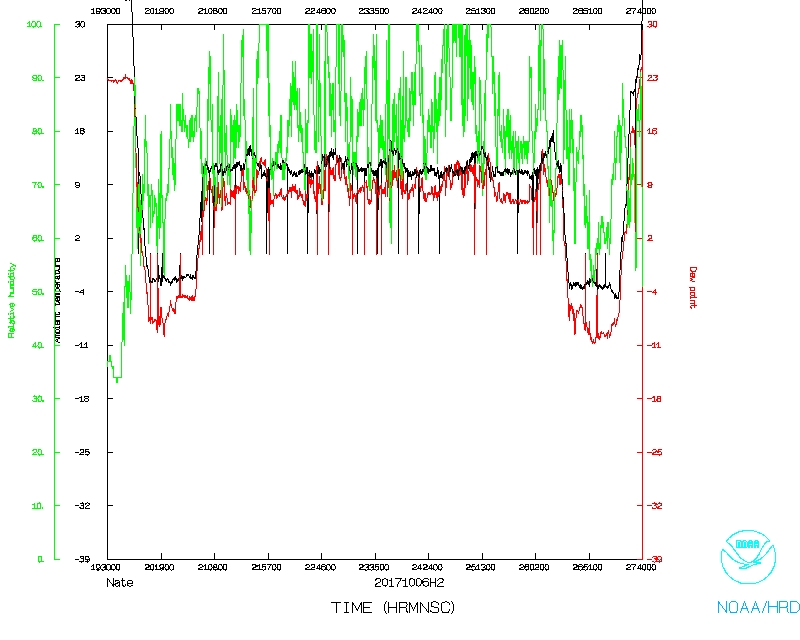 Temperature and Moisture |
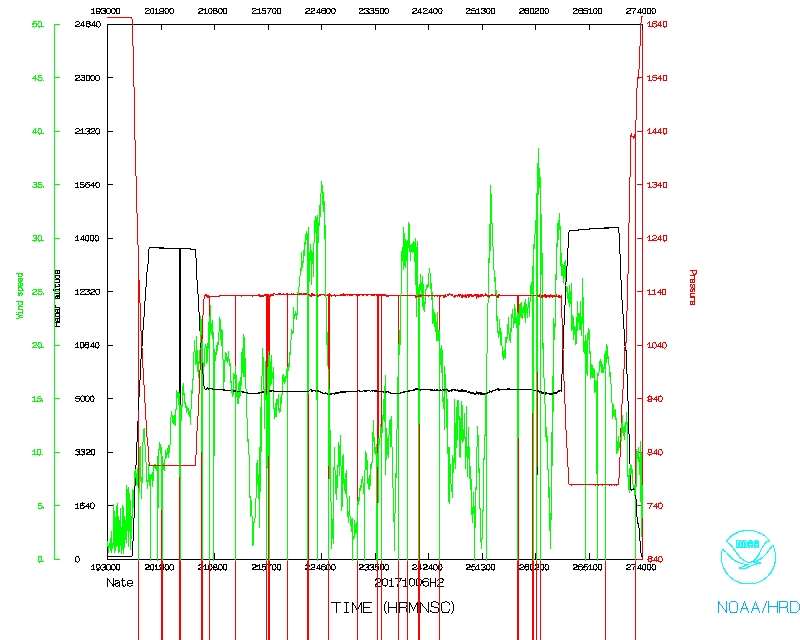 Wind and Atlitude |
 Flight track detail |
Flight Director's log |
Flight Director's manifest
NetCDF data |
serial data
LPS log |
Radar log |
Drop log |
AXBT log |
1 second data