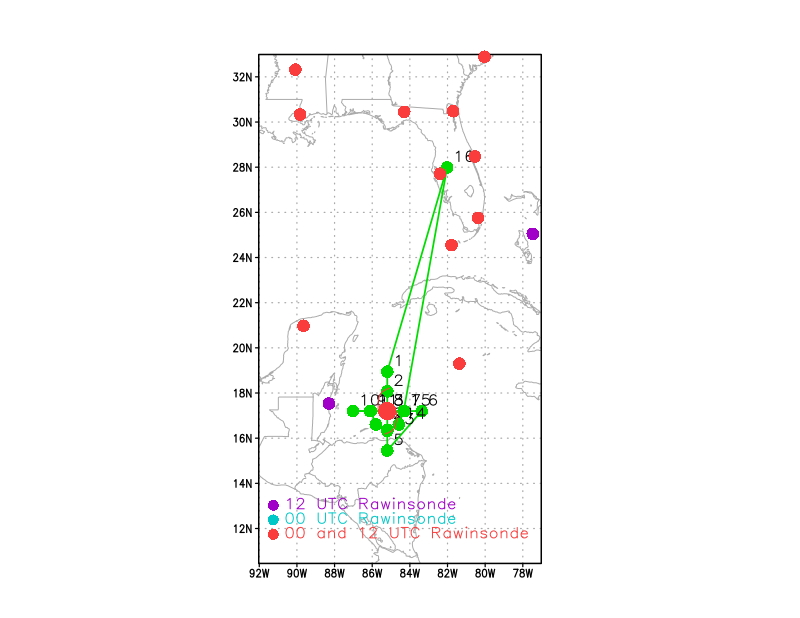
Figure 1. Proposed flight track for mission 20171006H1 |
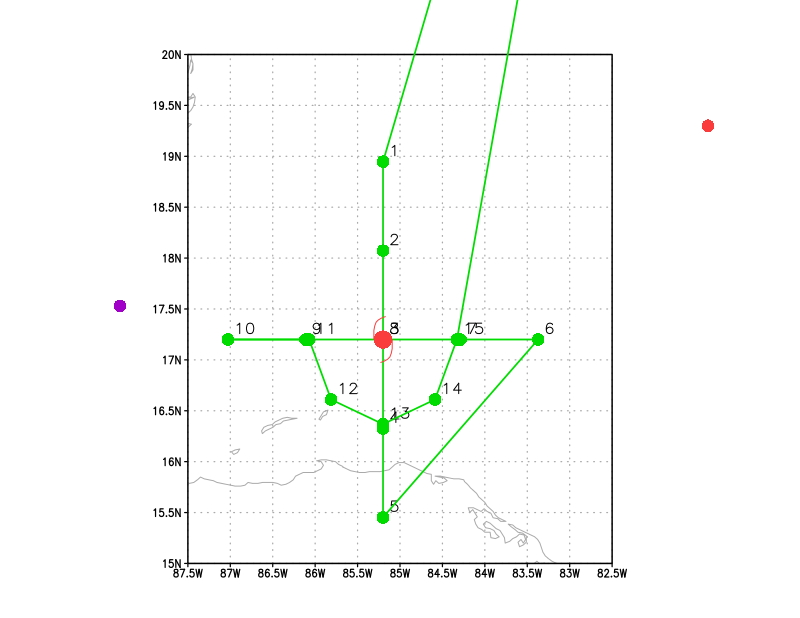
Detail of proposed flight track for 20171006H1 |
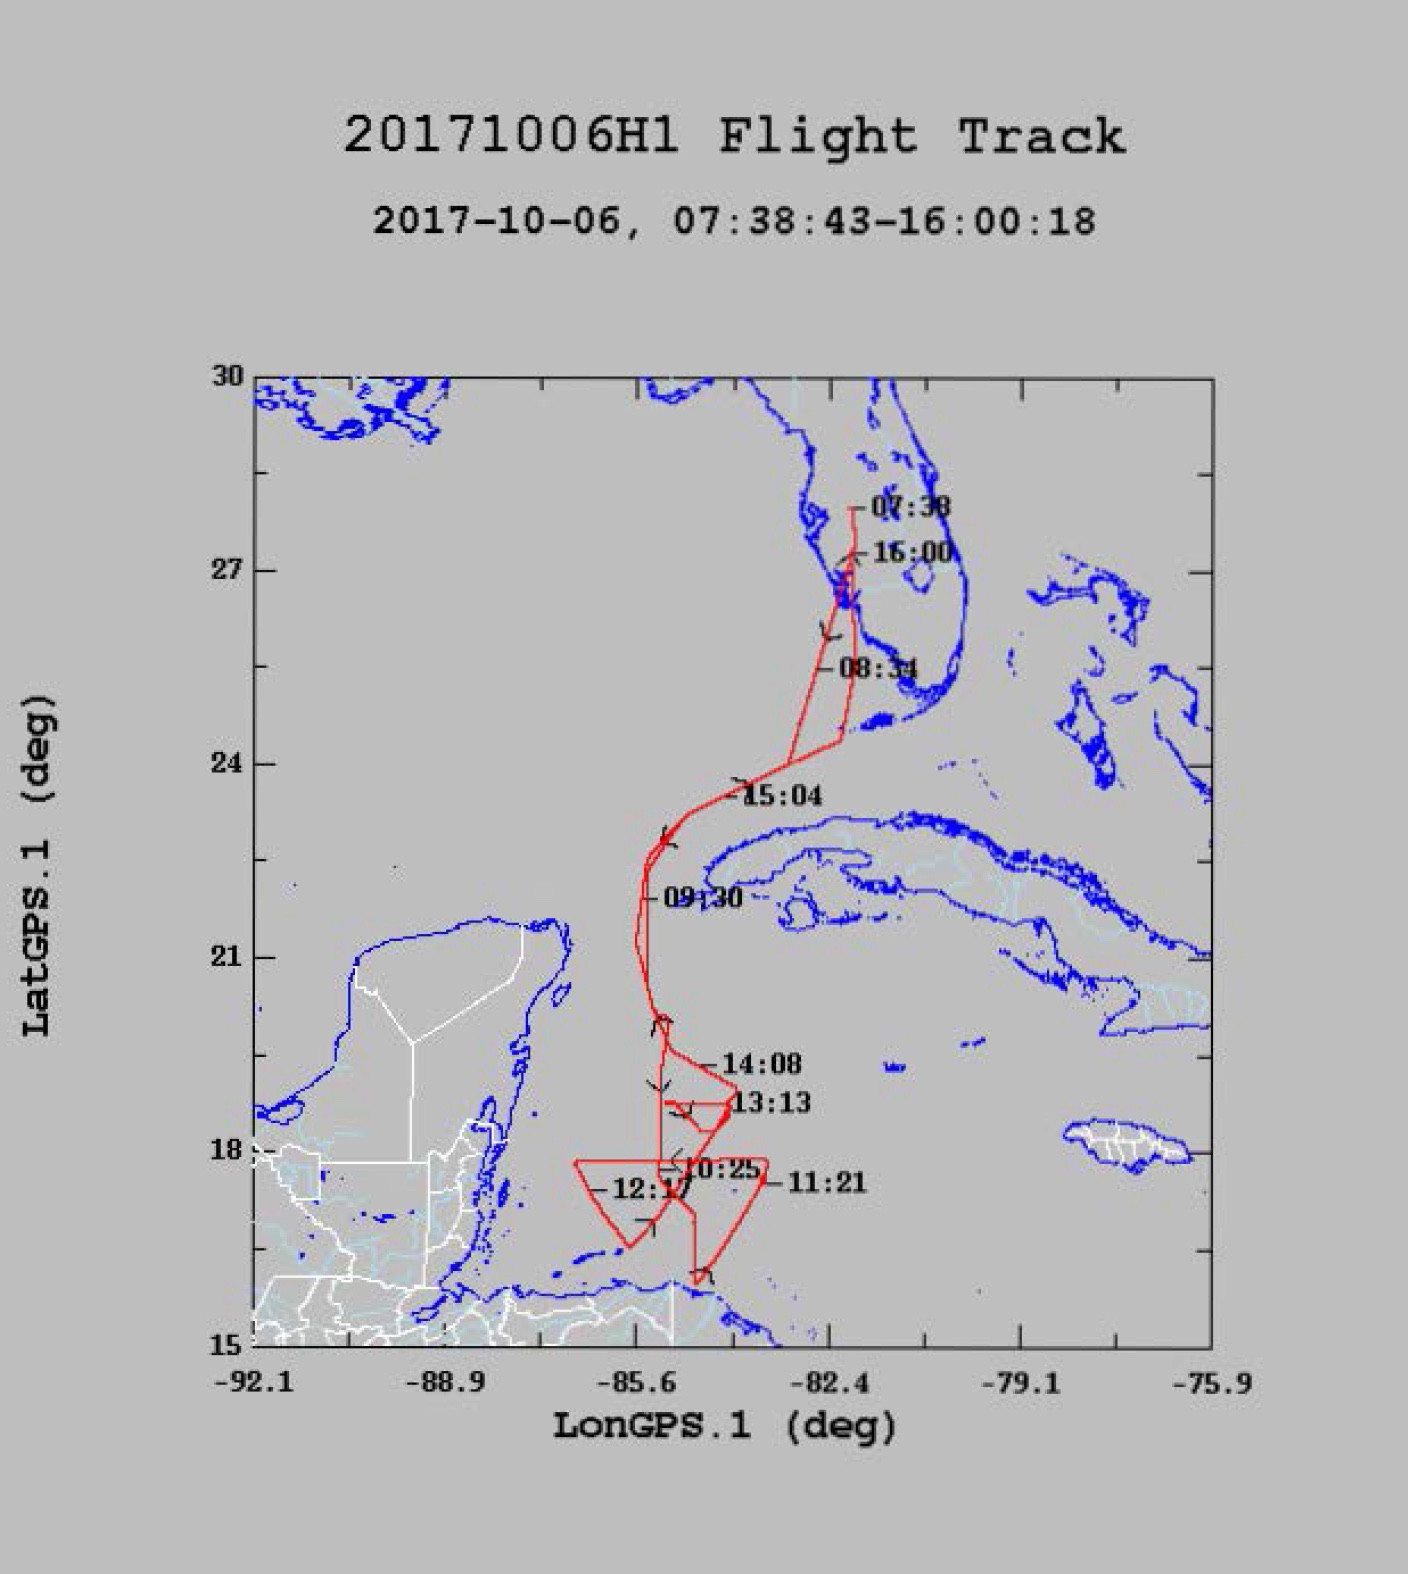
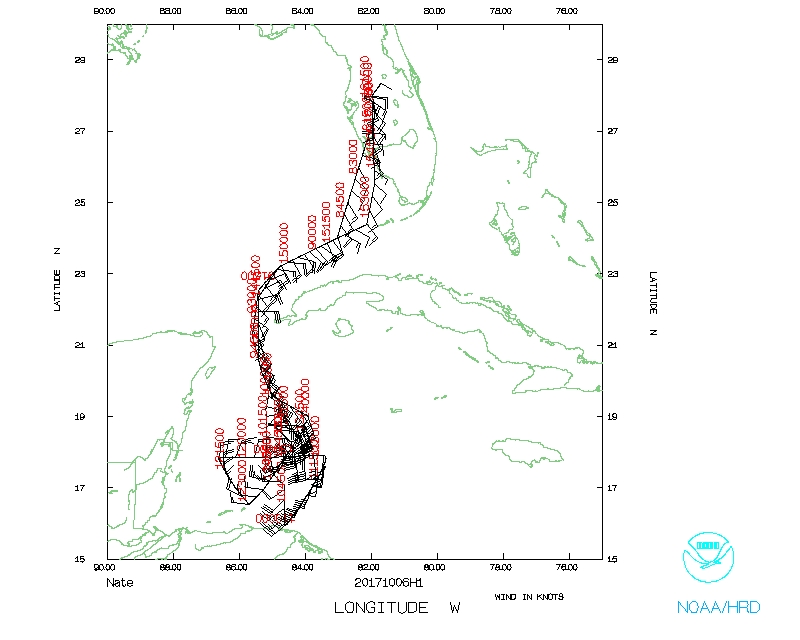
Actual flight track for 20171006H1 |
| Aircraft Commander | Justin Kibbey |
| Co-pilot | Kahn |
| Co-pilot | Rossi |
| Flight Engineer | Paul Darby |
| Flight Engineer | Todd Tufnell |
| Navigator | Freeman |
| Flight Director | Mike Holmes |
| System Engineer | Bobby Peek |
| Data Technician | Terry Lynch |
| Dropsonde Operator | Underwood |
| Lead ProjectScientist | Jon Zawislak | HRD |
| Radar Scientist | Heather Holbach | HRD |
| Dropsonde Scientist | Kathryn Sellwood | HRD |
| DWL Scientist | Brad Klotz | HRD |
| AXBT Scientist | Josh Wadler | RSMAS |
| Radar Scientist | John Gamache | HRD |
Mission Plan :
|
Figure 1. Proposed flight track for mission 20171006H1 |
Detail of proposed flight track for 20171006H1 |
Actual flight track for 20171006H1 |
NOAA42 will conduct an HRD-tasked research mission for the Analysis of Intensification Processes Experiment (AIPEX). The initial plan calls for a single Figure-4 at 10-kft radar altitude with 105 nm radial legs (Fig.1) for an initial survey of the vortex. Dropsonde/AXBT's will be released in combination at each turn point, mid point, and center of the first Figure-4 pattern (10 total). After completing the Fig. 4 survey pattern, there will be a couple of options. The preference is to climb to a higher altitude and perform a partial circumnavigation (5 total sonde/AXBT combo releases, spaced azimuthally every 45°) in a clearer region upshear of the center (presuming we can maintain visual meteorological conditions [VMC]). If a circumnavigation is not possible, then we'll rotate for another center pass oriented 225° inbound / 045° outbound (ideally we would complete a second Fig. 4, if time allows). After completing the first Fig. 4, we would like to perform the SFMR High-incidence Angle Measurements Module (for time constraints, we'll do three circles at 30° and five at 45°). This module requires relatively clear conditions below the aircraft, surface wind speeds reported by the SFMR > 15 m/s, and to maintain bank angle and altitude during the circles. The module also requires a sonde/AXBT combo release at the beginning of the module. A DWL calibration leg is required over land, clear of clouds/precipitation below the aircraft, and straight level either on the ferry out or return over Florida. We have 15 AXBTs and 20 dropsondes available on the airplane. SHIPS shear as of 0000 UTC analysis is 236°/6 kt. The NHC advisory at 2 am EDT / 0600 UTC: Motion, 325°/10 kt; Intensity, 40 kt, 999 mb; Position, 16.1°N / 84.8°W. The NHC forecast position at 1200 UTC is 17.8°N / 85.6°W.
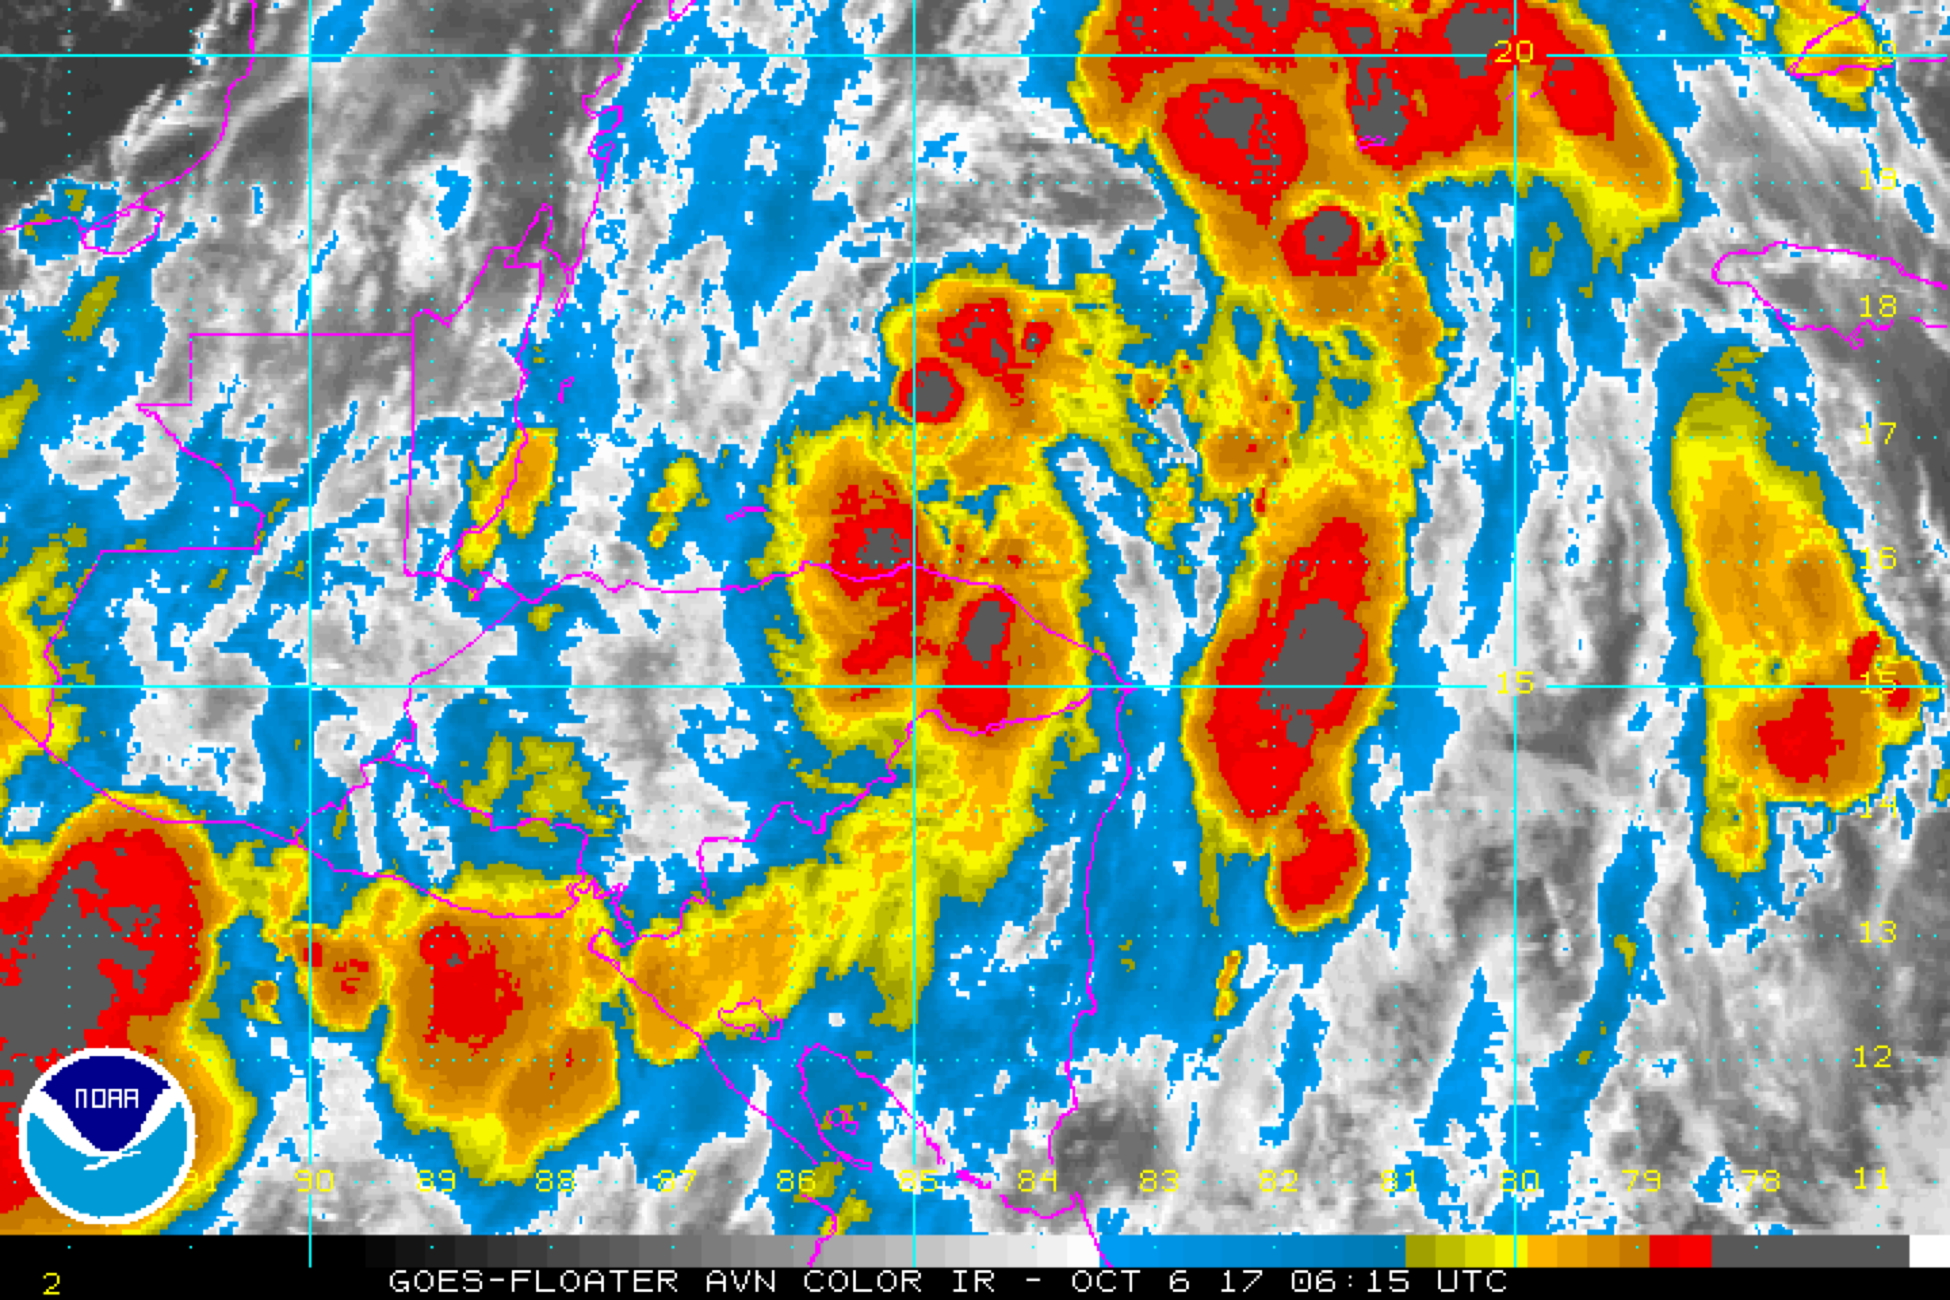
Figure 2. GOES-13 IR imagery of Nate from 0615 UTC 6 October |
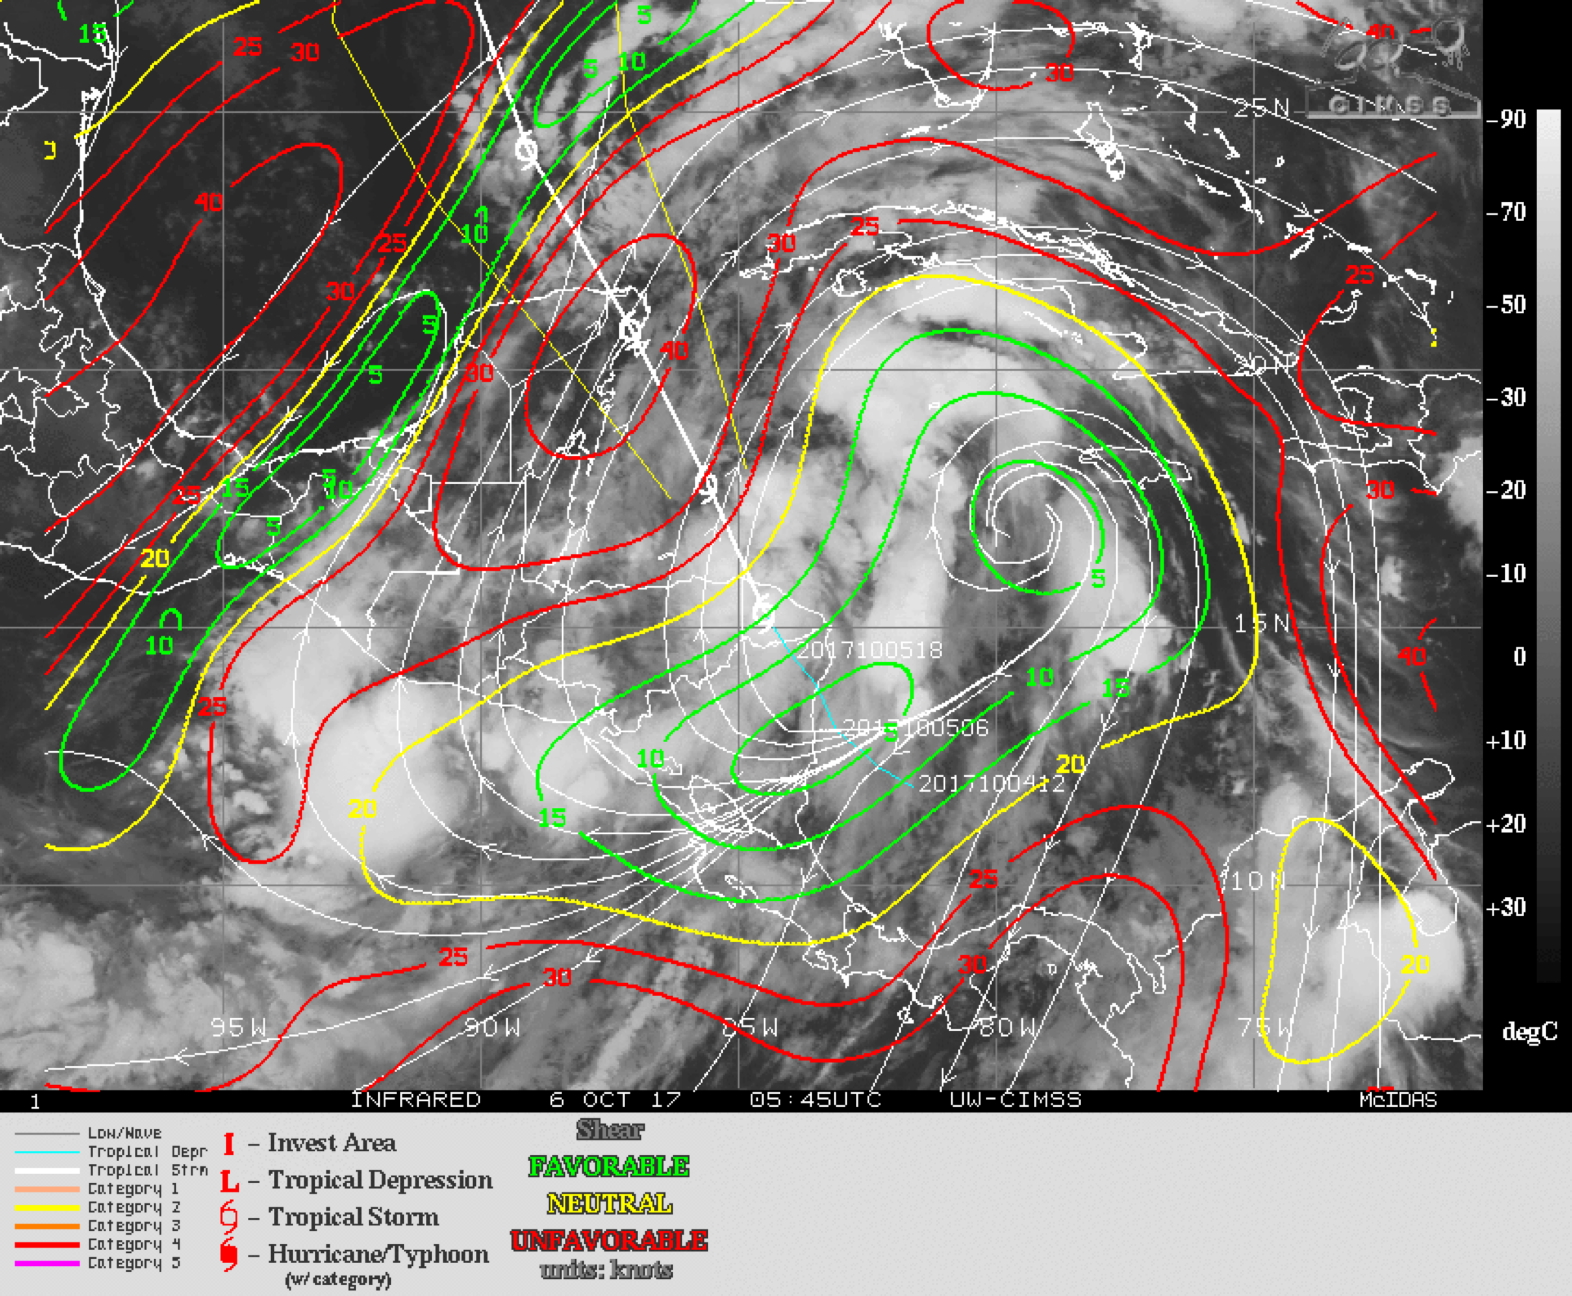
Figure 3. IR imagery and CIMSS-derived deep-layer (850-200 hPa) vertical wind shear (contoured; contours colored by favorability for intensification, with green being "favorable", yellow being "neutral", and red being "unfavorable"), valid at 0545 UTC 6 October (images courtesy CIMSS, tropic.ssec.wisc.edu) |
The center of Nate emerged off the coast of Honduras several hours prior to the mission. It appears that the low-level circulation remained robust after traversing over Nicaragua and Honduras yesterday. Deep convection has persisted throughout Nate (Fig. 2), and, at least at the moment, it appears that deep shear is not impacting the storm (the partial circumnavigation may not be possible if convection persists upshear); though, convection doesn't appear particularly organized. There is a clearer region to the east of the main convective area around the center; however a north-south band of convection has set up about 350 km east of the center beyond the clear region. As environmental conditions (SST, deep-layer vertical wind shear magnitude [Fig. 3)) appear to be favorable, NHC forecasts slow intensification for Nate as it moves towards the NNW towards the Yucatan peninsula (Figs. 4, 5), with at least some chance of rapid intensification in the next 48 h. With any reasonable success rate from the AXBTs, we should get good SST and surface flux measurements throughout the storm, which will benefit a PBL study of this potentially intensifying case.

Figure 4. Track forecast guidance for Nate valid 0600 UTC 6 October (image courtesy http://www.ral.ucar.edu/guidance/realtime/current/) |
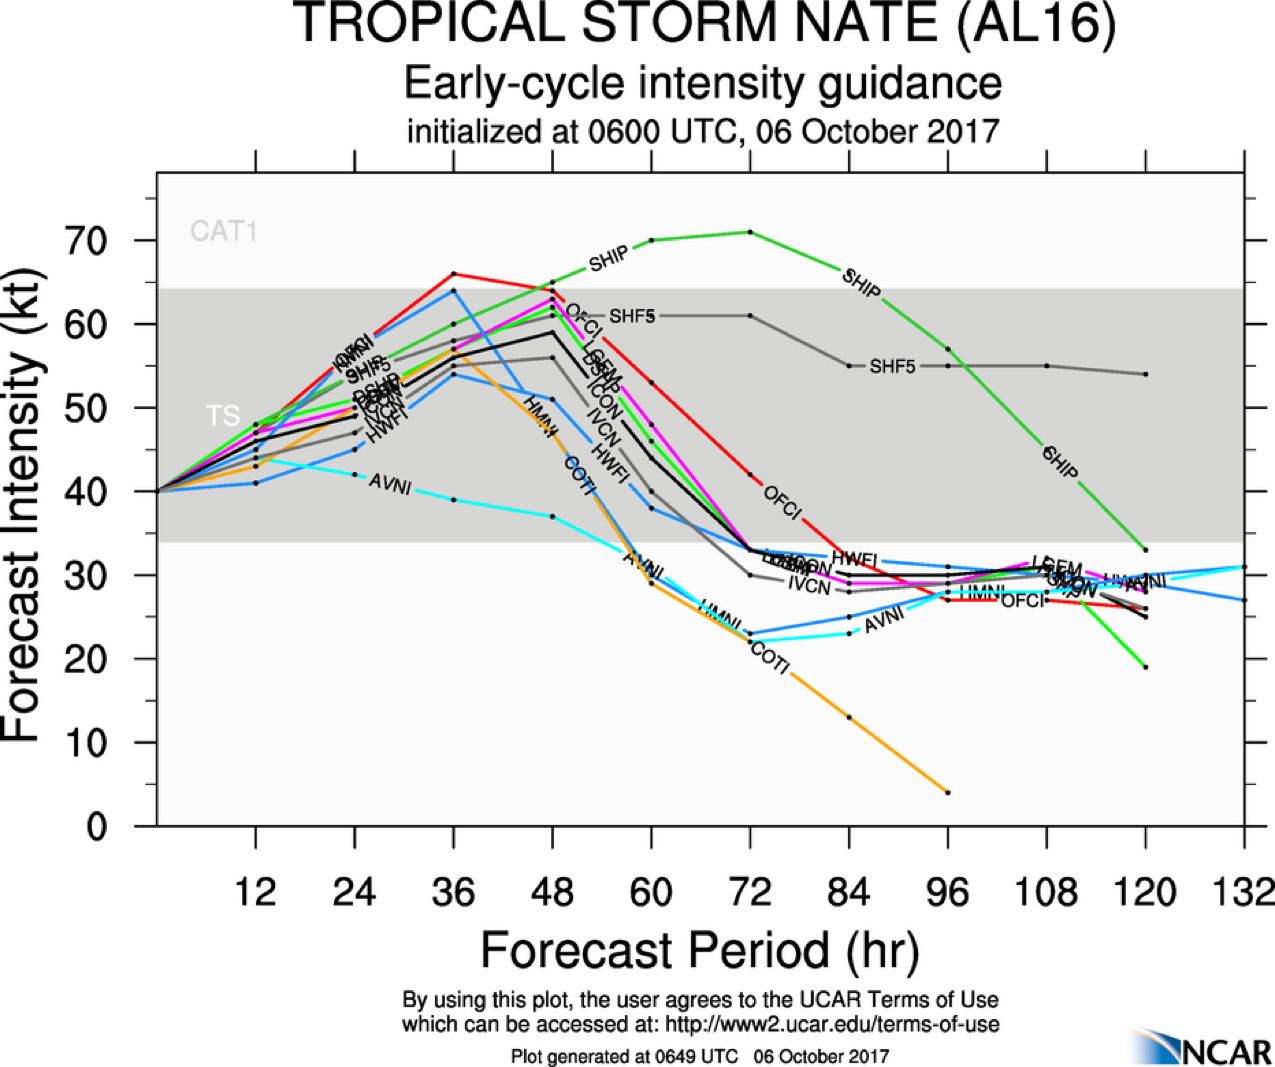
Figure 5. Intensity forecast guidance for Nate valid 0600 UTC 6 October (image courtesy http://www.ral.ucar.edu/guidance/realtime/current/) |
|
Prepared by the Hurricane Research Division October 05, 2017 Aircraft: N42RF Proposed takeoff: 06/0800Z
DROP LOCATION TABLE
| #
| LAT
| LON
| RAD/AZM
| TIME
|
| deg min
| deg min
| nm deg
| (hh:mn)
| 1S | 18 57 | 85 12 | 105/000 | 1:46
| 2I | 18 04 | 85 12 | 2:00
| 3I | 17 12 | 85 12 | 2:13
| 4I | 16 20 | 85 12 | 2:26
| 5S | 15 27 | 85 12 | 105/180 | 2:39
| 6S | 17 12 | 83 22 | 105/090 | 3:17
| 7I | 17 12 | 84 17 | 3:31
| 8I | 17 12 | 85 12 | 3:44
| 9I | 17 12 | 86 07 | 3:54
| 10S | 17 12 | 87 02 | 105/270 | 4:05
| 11S | 17 12 | 86 04 | 50/270 | 4:17
| 12S | 16 37 | 85 49 | 50/225 | 4:26
| 13S | 16 22 | 85 12 | 50/180 | 4:34
| 14S | 16 37 | 84 35 | 50/135 | 4:43
| 15S | 17 12 | 84 20 | 50/090 | 4:51
| | ||||||||||||||||||||

Figure 6. Actual flight track for mission 20171006H1. Flight-level winds (barbs) and wind speeds (shaded, kt) indicated. |

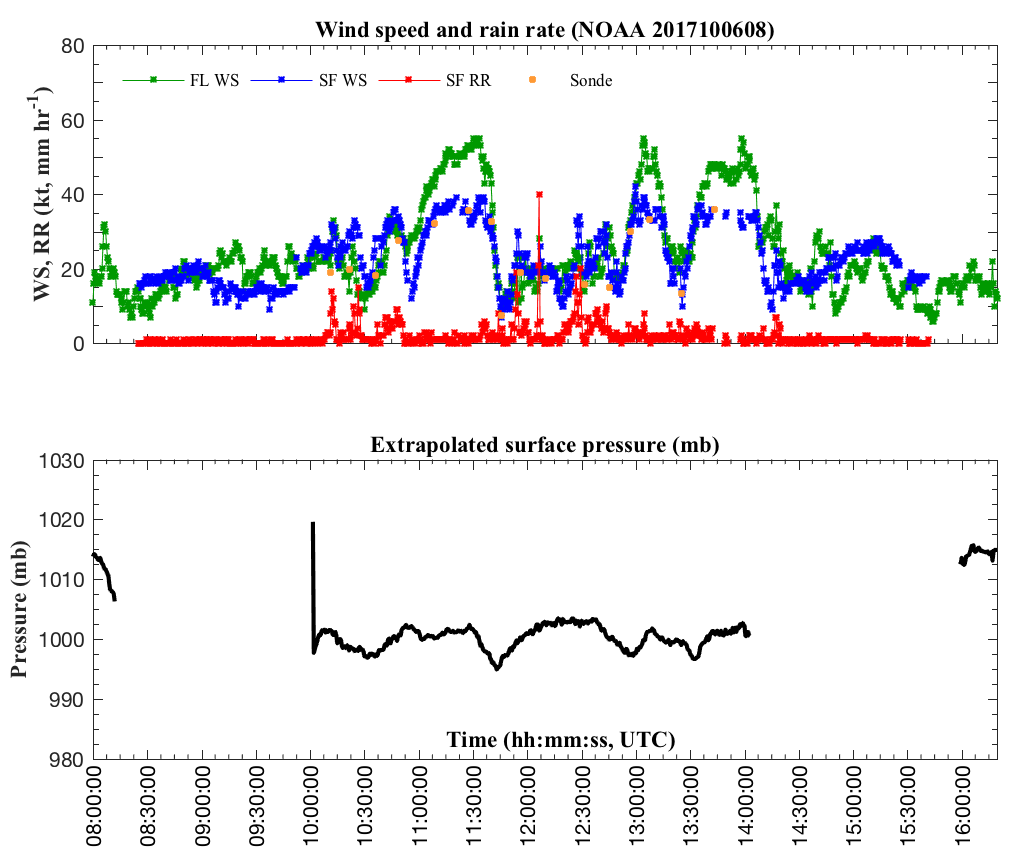
Figure 7. Time series of flight-level winds (green, kt), SFMR surface winds (blue, kt), and SFMR rain rate (red, mm/hr) for mission 20171006H1, as well as the extrapolated surface pressure (mb). |
Mission Summary :
| Take off | Landing
| Linder-Lakeland, FL
| 07:59 UTC
| Linder-Lakeland, FL
| 16:17 UTC
| Penetrations
| 4
| Expendables
| 17 Dropsonde (HRD, AIPEX)
| AXBT: 14 | ||||||
The actual track of this mission is shown in Fig. 6, with wind information at flight level (FL), extrapolated sea level pressure (SLP), and SFMR surface wind speed and rain rate shown in Fig. 7. Prior to pre-flight, we were not able to get the DWL computer powered on. It appeared to temporarily have power, but then unexpectedly shut down. We initially decided to delay departure 15 min to attempt to fix the issue, but a resolution was not found and we took off on time. After a 2+ hour ferry to Nate, we arrived at the IP around 1008 UTC near 18°56'N / 85°11'W (Sonde #1 / AXBT#1). There was no launch detect from the IP sonde, so we backed up the sonde with another at 1011 UTC (Sonde #2 / no AXBT); this one provided good data. As we went inbound to the center on the 360° azimuth, we passed through some precipitation, but as satellite (Fig. 8) and lower fuselage (LF) radar (Fig. 9) suggested, there was very little precipitation to the east of the center. After releasing another combo at the midpoint of the inbound (Sonde #3 / AXBT #2 at 1021 UTC), and after avoiding a rainband to the east of the leg, we turned to 130° heading to attempt to get a closer approach to the center. We passed by the low-level center, according to the LF (Fig. 9), about 20 nm to the WSW and released a "center" sonde/AXBT combo (Sonde #4 / AXBT #3) at 1035 UTC. The center position estimate for this "pass" from the LF was 17°36'N / 84°36'W. We resumed our outbound heading of 180° and released a sonde/AXBT combo at the approximate midpoint of the initially planned leg length at 1049 UTC (Sonde #5 / AXBT #4). The reflectivity profile from the TDR for the second pass is shown in Fig. 10.
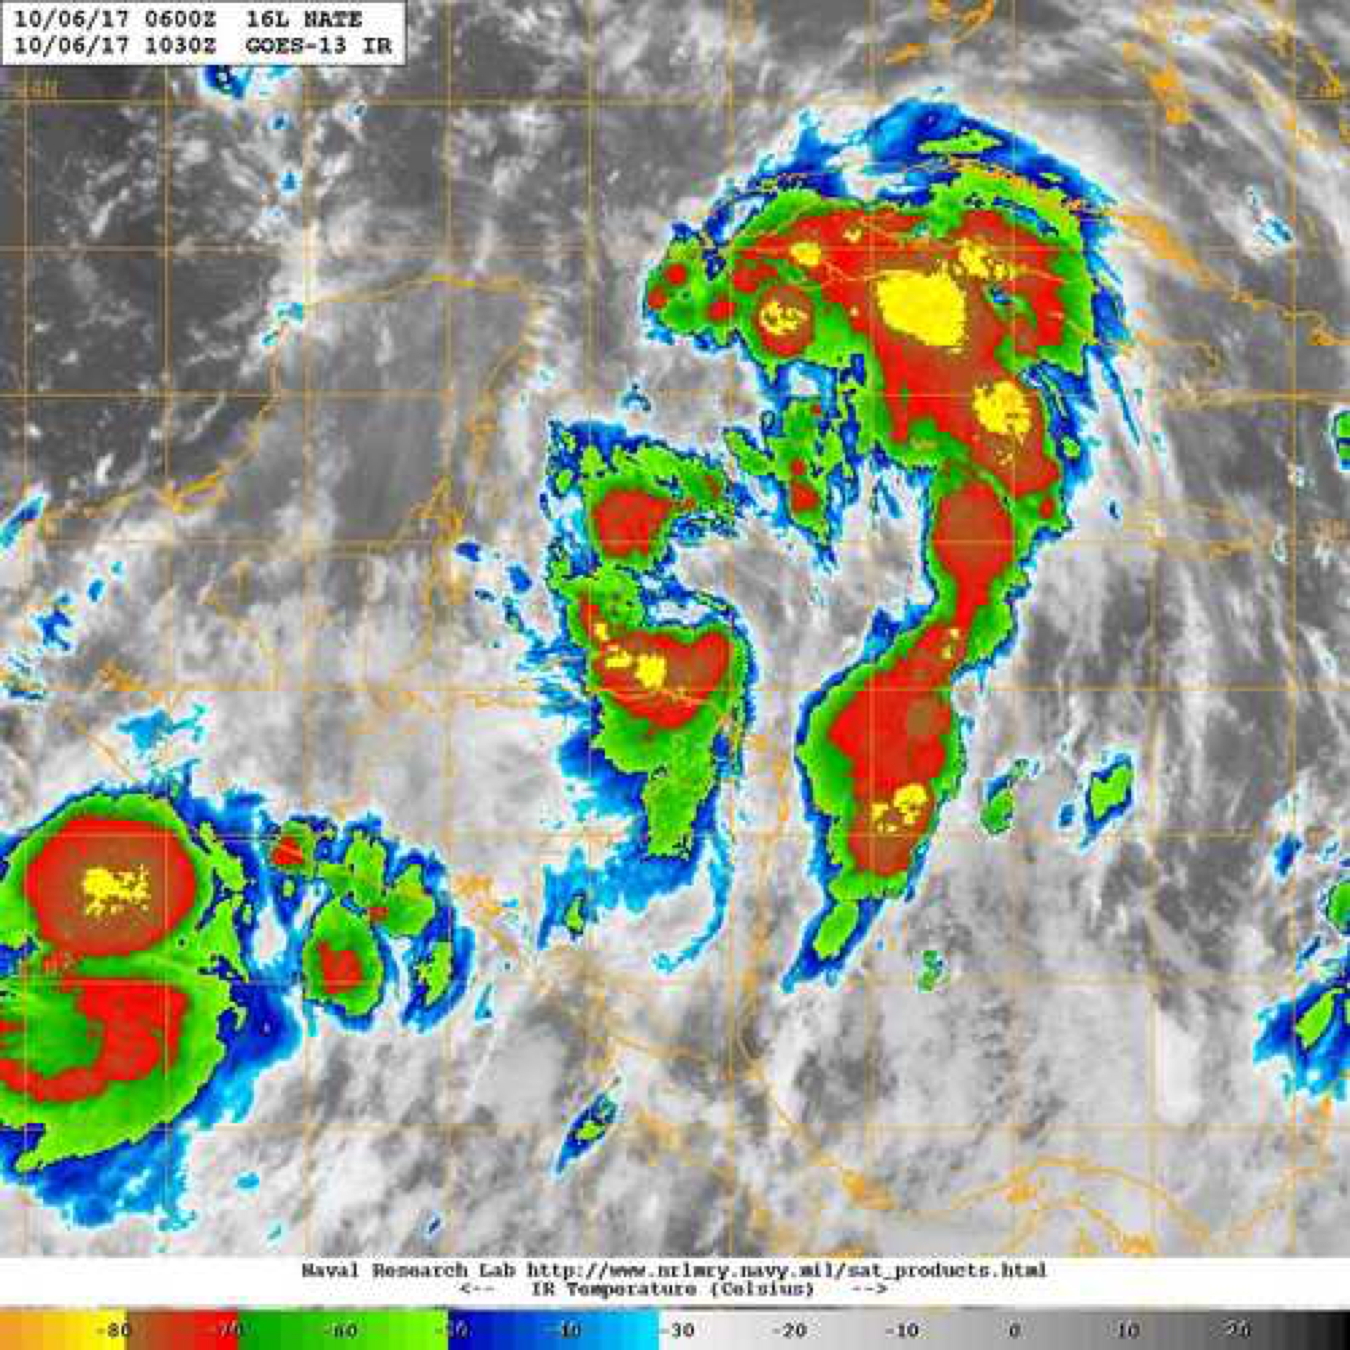
Figure 8. IR imagery at 1030 UTC 6 October, around the time of the first center pass (image courtesy the Naval Research Laboratory, nrlmry.navy.mil/TC.html) |
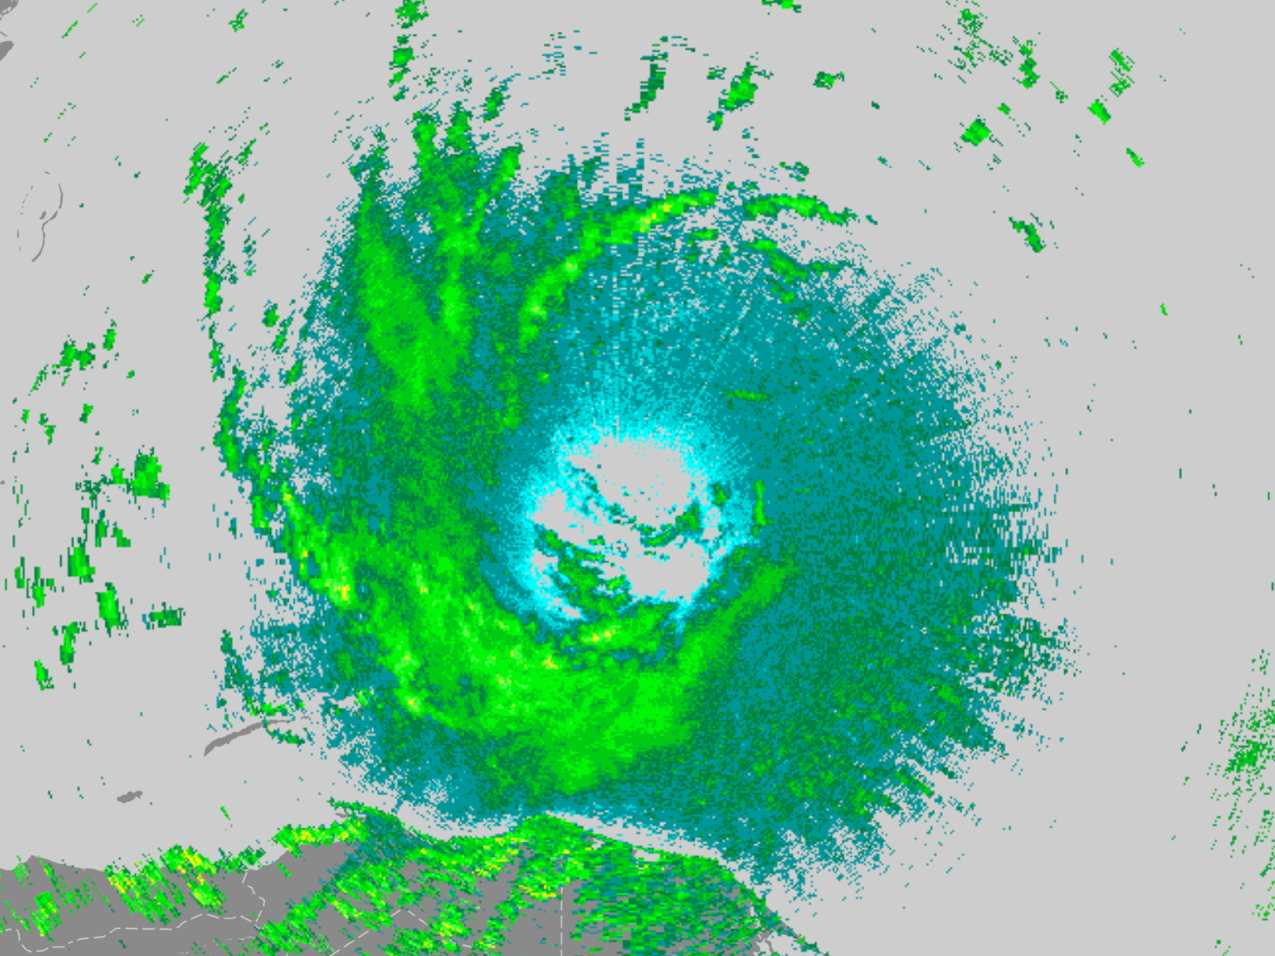
Figure 9. LF imagery at 1035 UTC 6 October |
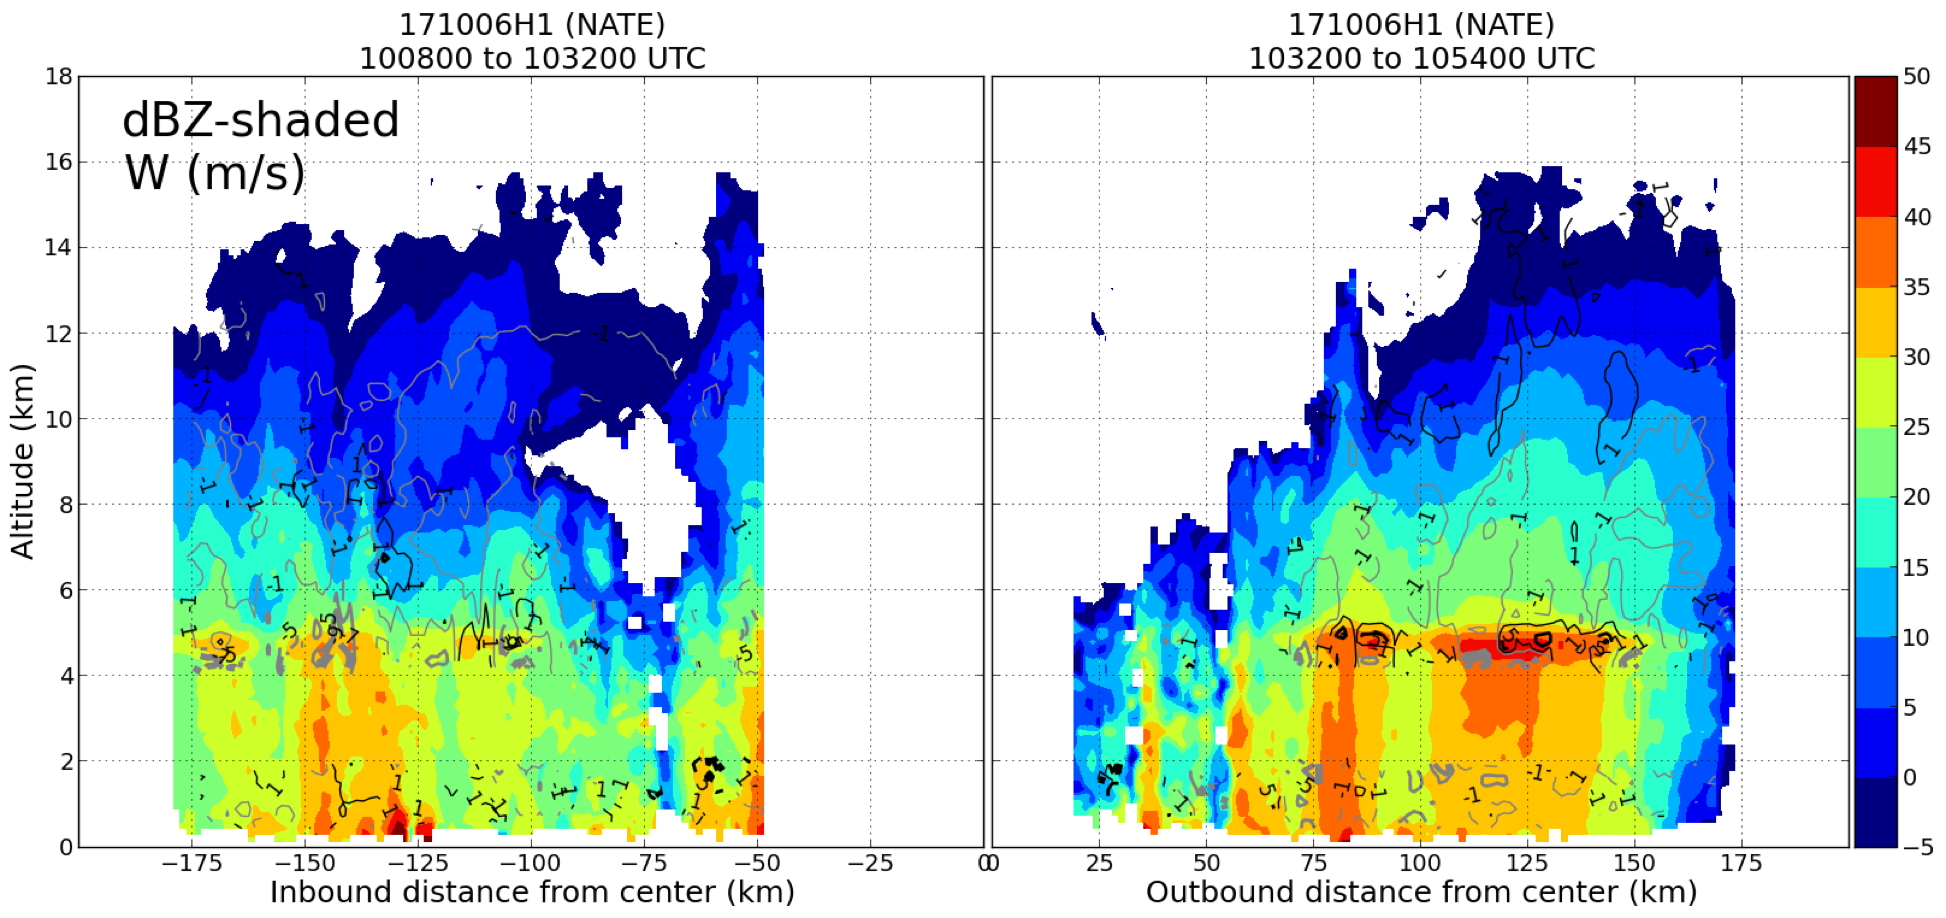
Figure 10. TDR vertical profile analysis of reflectivity (shaded, dBZ) and vertical velocity (contoured, m s-1) for the first pass (between the IP to the N and WP #2 to the S), centered at 1032 UTC |
One of the decisions we made while inbound to the IP was to remain at 10 kft radar altitude for the first pass, rather than climbing to 12500 kft, which would have allowed us to overfly the mountainous terrain near the coast of Honduras. As there wasn't as much precipitation over land, and we would not be able to drop any sondes, we decided to end the outbound leg to the S just prior to reaching the beach. As such, we flew approximately another 20 nm past the midpoint of the outbound leg, and turn downwind to WP #2 just prior to reaching the coastline at 1054 UTC (there was no sonde or AXBT at this end point due to its close proximity to the midpoint of the outbound leg). Considering the length of the subsequent downwind leg, a decision was made to release a sonde/AXBT combo at the midpoint of the downwind (Sonde #6 / AXBT #5 at 1108 UTC), as this region would allow us to sample the apparent dry intrusion into the storm on the SE side (although it could be also indicating localized subsidence). We observed 50 kt FL winds on this downwind leg. We arrived at WP #3 at 1126 UTC, released another combo (Sonde #7 / AXBT #6) and proceeded inbound on the 090° azimuth. Conditions near WP #3 were clear at FL, with only some anvil above and scattered clouds below the aircraft, topping the marine PBL.
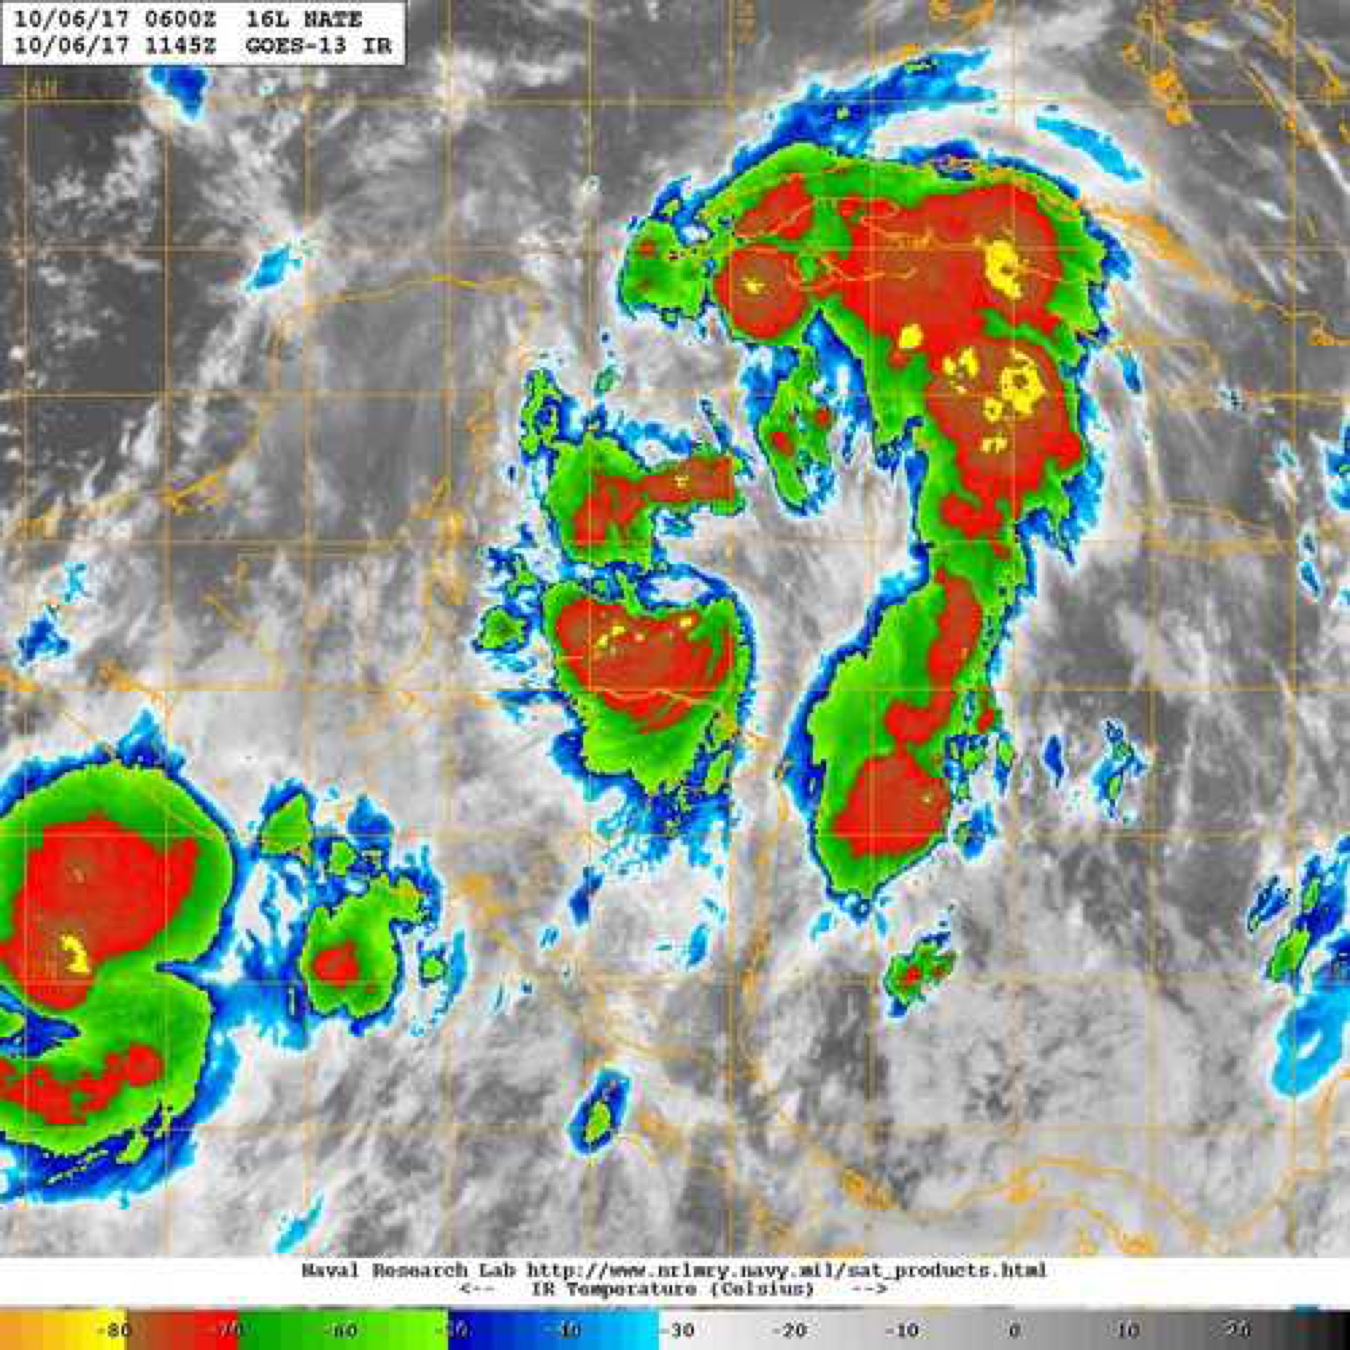
Figure 11. IR imagery at 1145 UTC 6 October, around the time of the second center pass (image courtesy the Naval Research Laboratory, nrlmry.navy.mil/TC.html) |
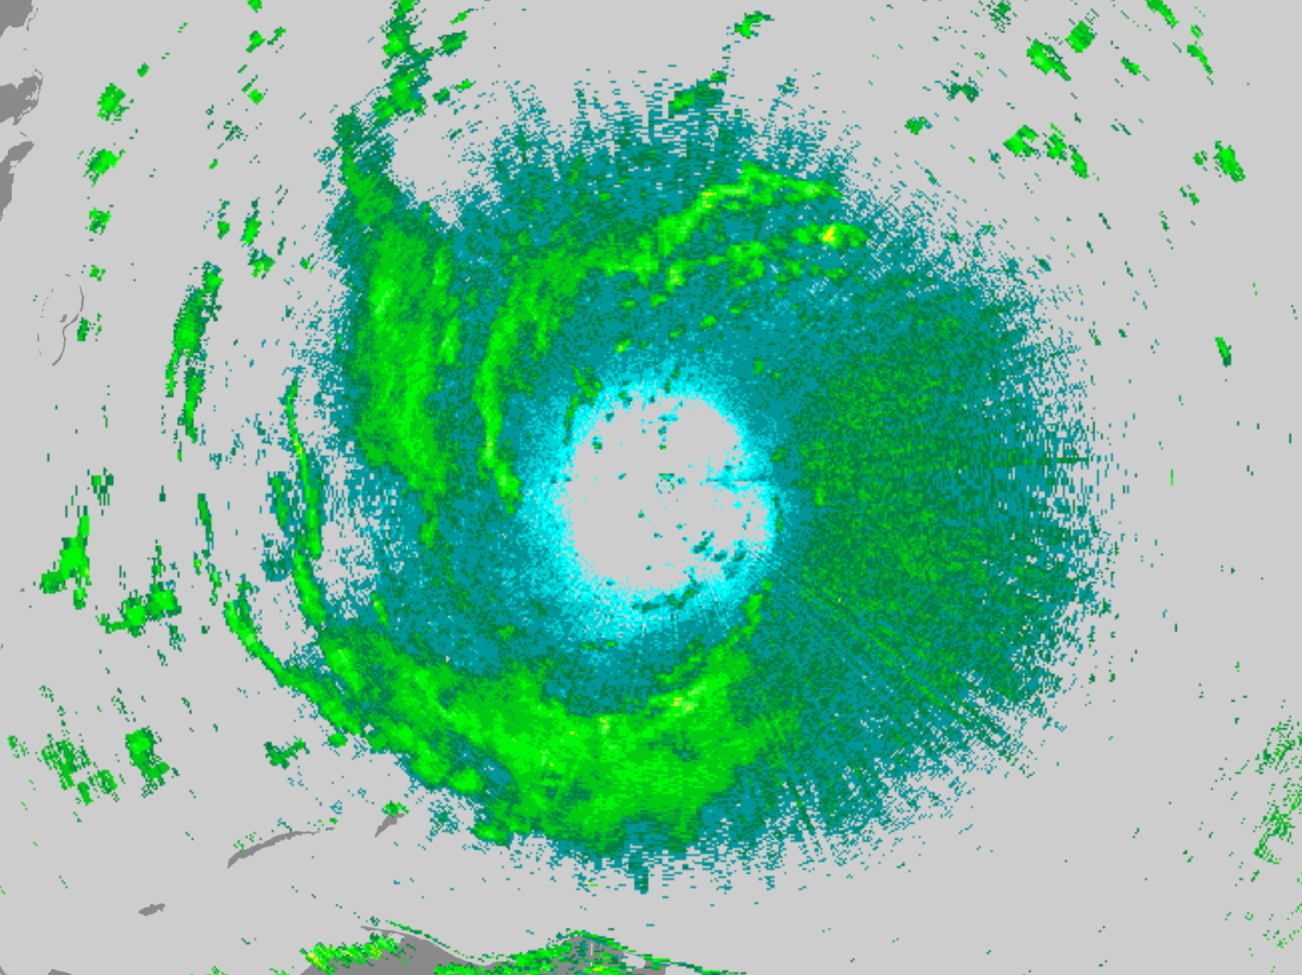
Figure 12. LF imagery at 1144 UTC 6 October |
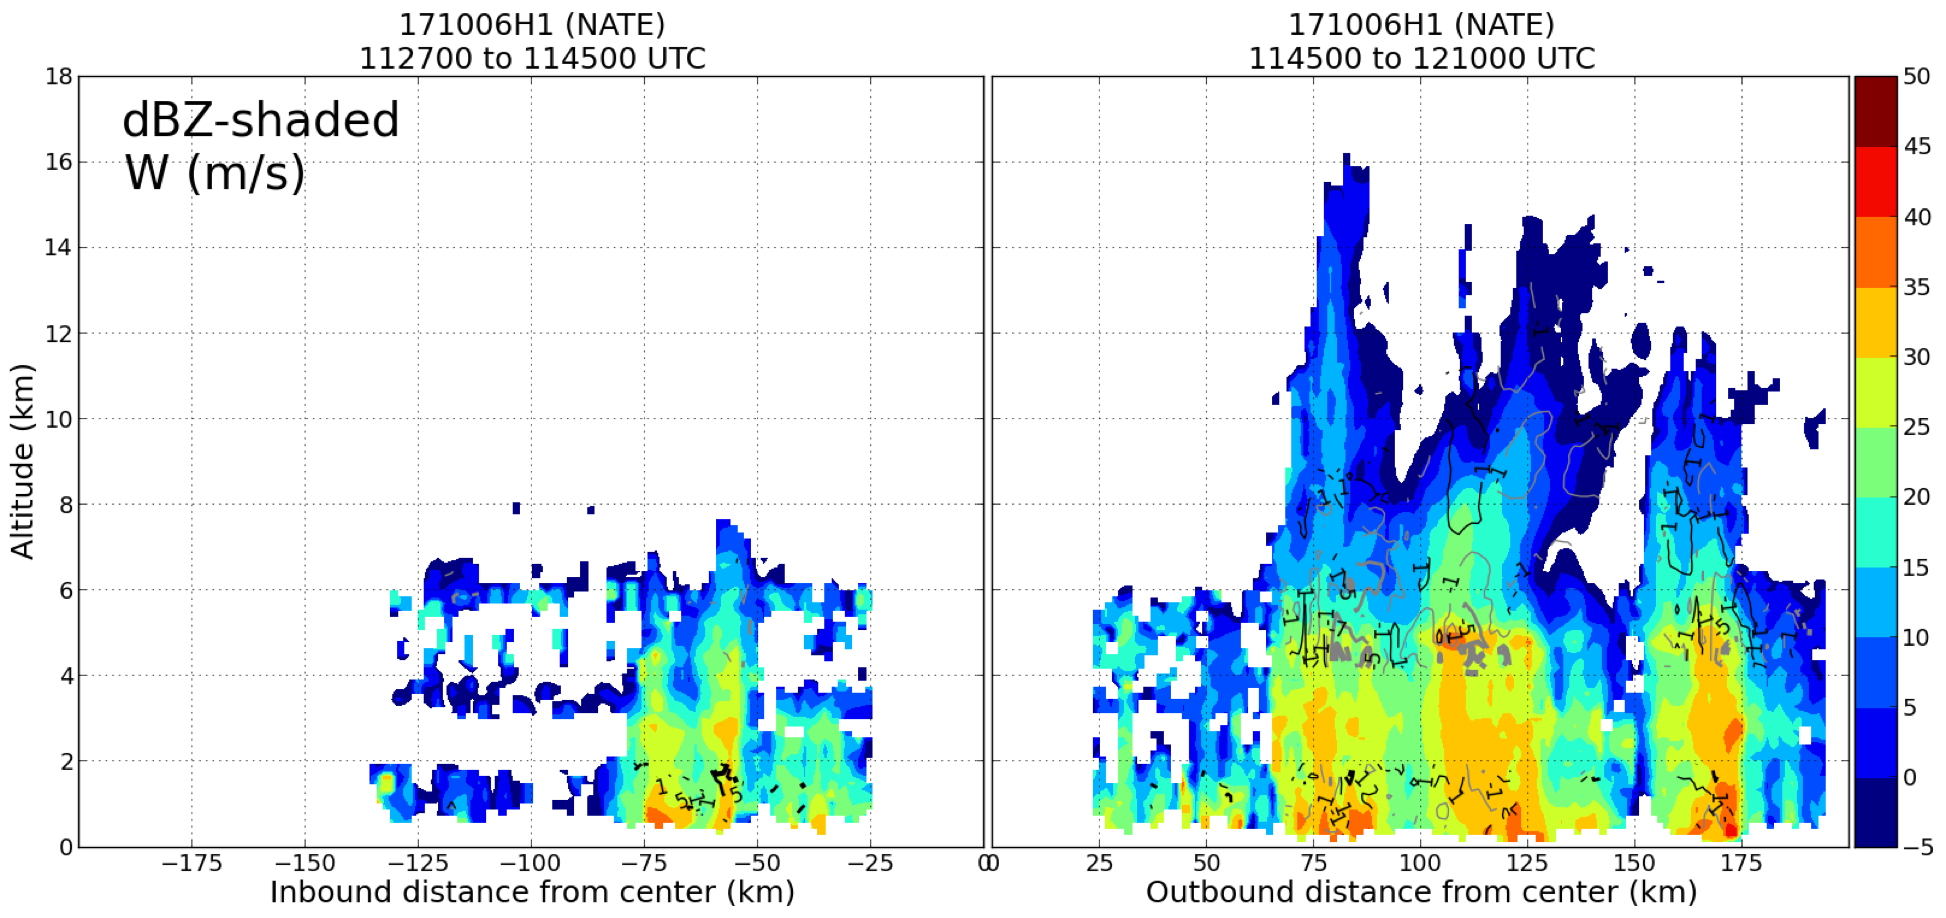
Figure 13. TDR vertical profile analysis of reflectivity (shaded, dBZ) and vertical velocity (contoured, m s-1) for the second pass (between the WP #3 to the E and WP #4 to the W), centered at 1145 UTC |
As we approached WP#3 to go inbound, we also decided that there was too much cloud coverage on the west and south sides of the storm to successfully complete the planned partial circumnavigation (it was becoming clear that the shear vector direction was likely from the northeast, instead of the southwest) . While, we considered the dry slot to the east for the location of a high-altitude partial circumnavigation later in the flight, it would likely require too much time, and it was possible that we could encounter building convection at that altitude. In place of the partial circumnavigation we proceeded on to our plan "B" to attempt to complete the rotated Fig. 4, thus still sampling the precipitation and vortex fully.
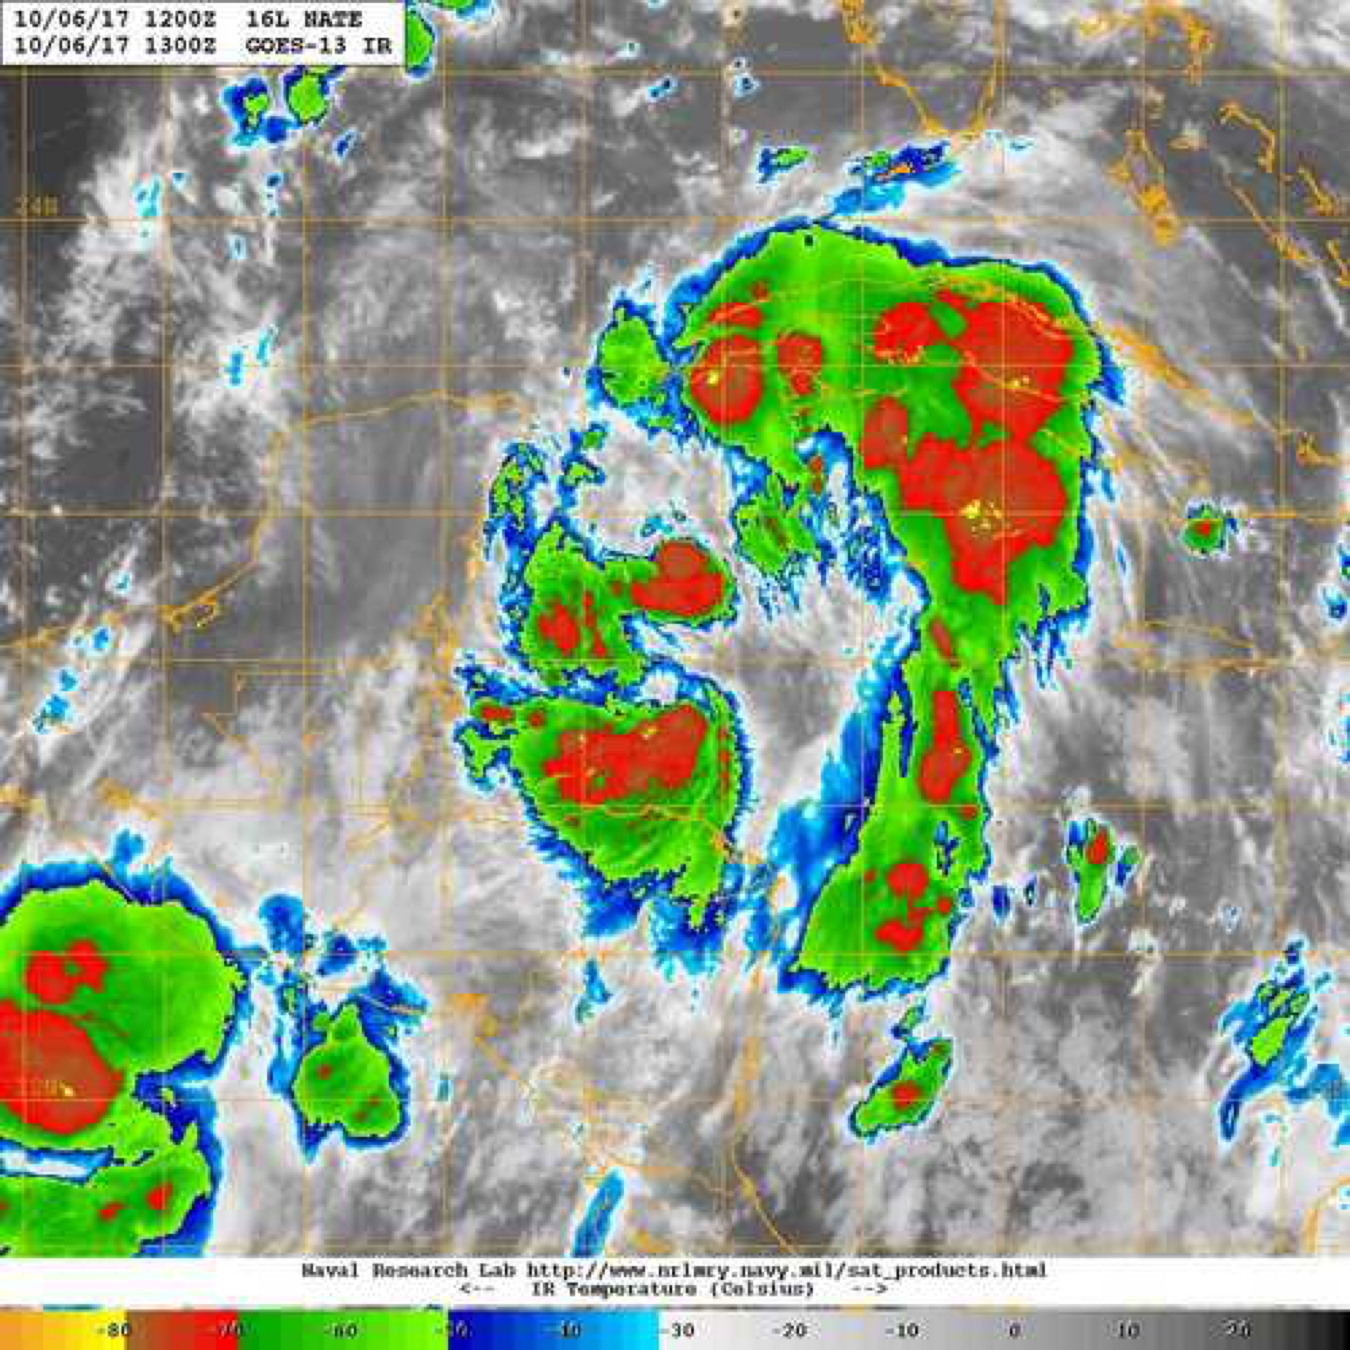
Figure 14. IR imagery at 1300 UTC 6 October, around the time of the third center pass (image courtesy the Naval Research Laboratory, nrlmry.navy.mil/TC.html) |
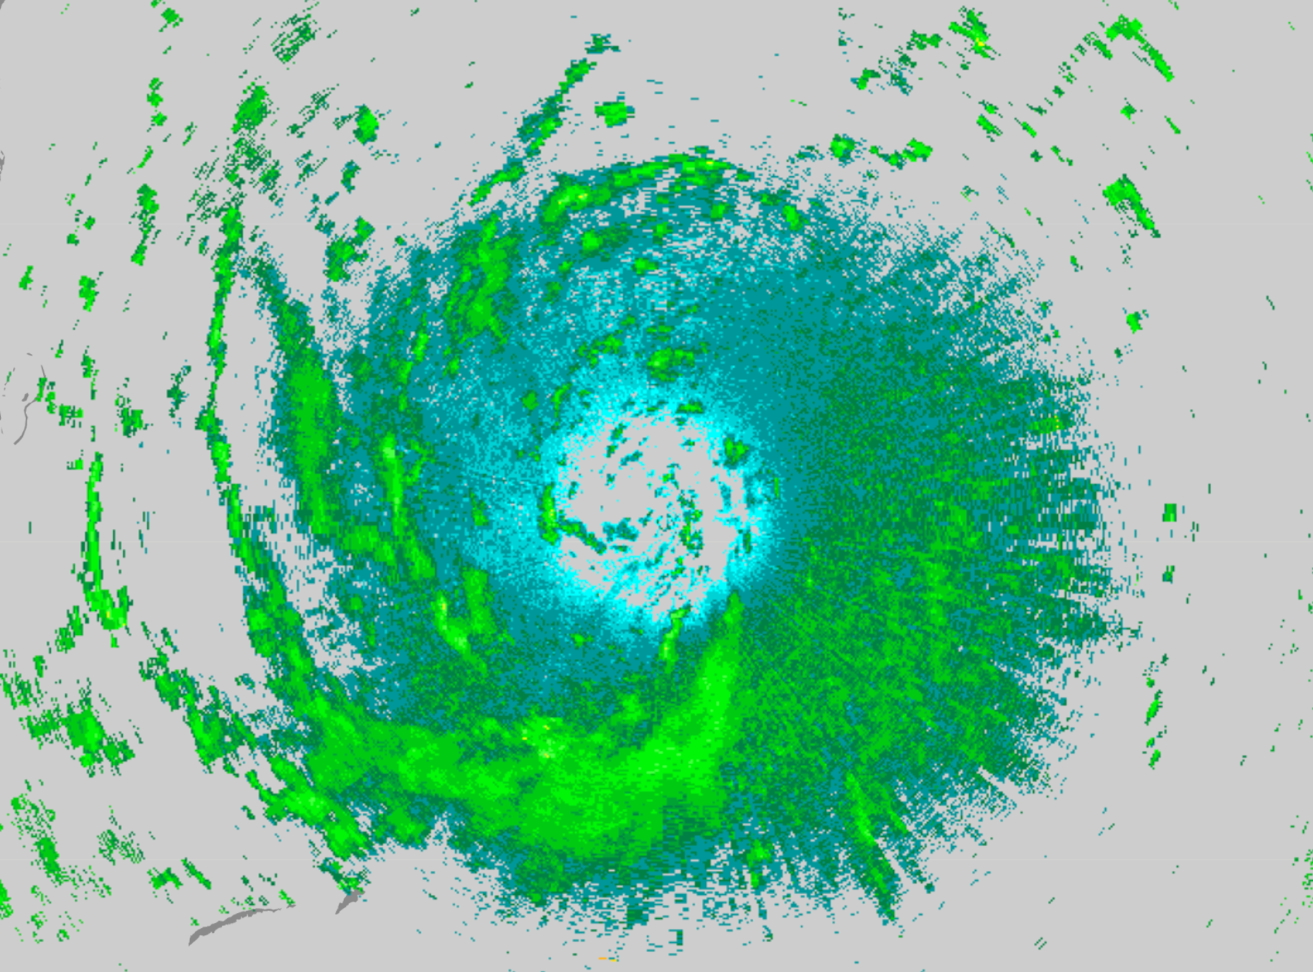
Figure 15. LF imagery at 1257 UTC 6 October |
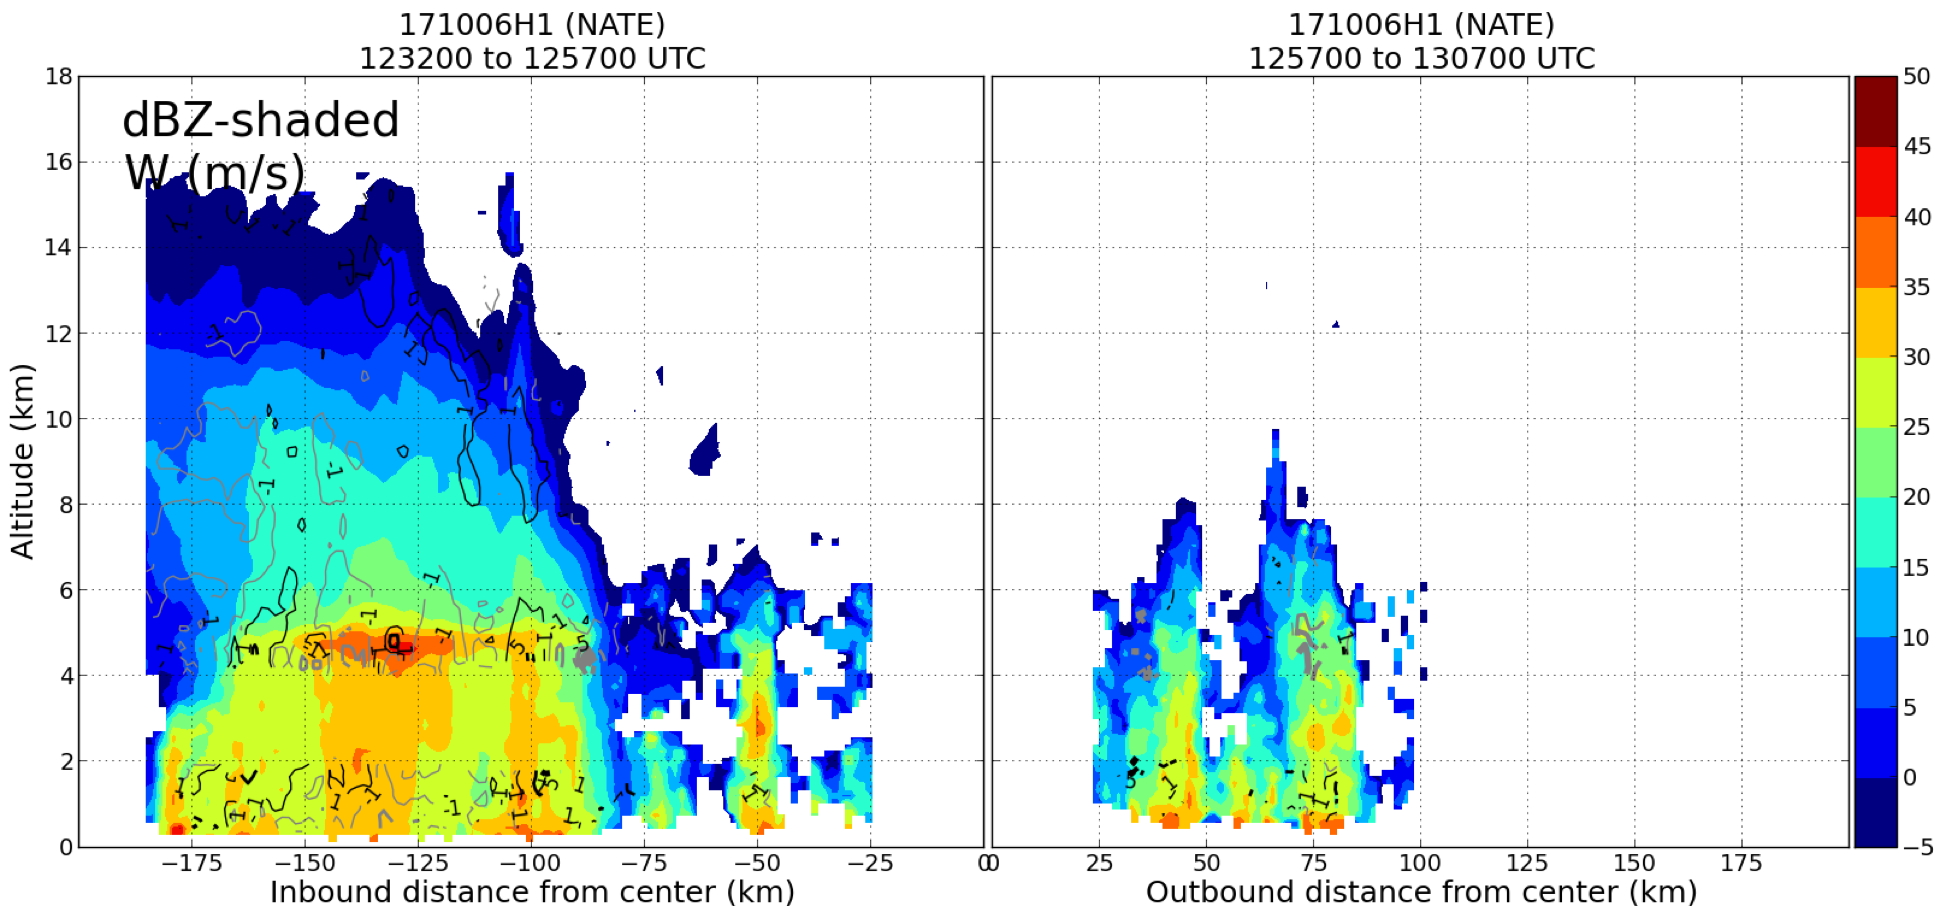
Figure 16. TDR vertical profile analysis of reflectivity (shaded, dBZ) and vertical velocity (contoured, m s-1) for the third pass (between the WP #5 to the SW and WP #6 to the NE), centered at 1257 UTC |
On the inbound leg for our second center pass, it did appear that there was some building congestus (at best, reaching the midtroposphere), but it was only fairly isolated in coverage (IR imagery, Fig. 11). We released a combo at the approximate midpoint at 1140 UTC (Sonde #8 / AXBT #7). The peak FL wind on the inbound leg was 57 kt, while the surface wind from SFMR was 38 kt. We shortly after arrived near the center (only about 25 nm west of the inbound midpoint drop), but unfortunately passed just to the north of the low-level center apparent on the LF (Fig. 12). We released our second "center" drop and AXBT combo at the closest approach at 1145 UTC (Sonde #9 / AXBT #8). The approximate center location estimated from the LF was 17°42'N / 84°41'W. On the outbound leg, we planned to release the midpoint combo a bit early to get the drop inside or just radially outward of the rainband just west of the center (Fig. 12). We released the "midpoint" sonde/AXBT combo at 1156 UTC, just radially outward of the band (Sonde #10 / AXBT #9). While outbound on the 270° azimuth, it was apparent that conditions were not going to be met for the SFMR circles (surface wind speed < 15 m/s according to the SFMR) on the west side, so after reaching WP #4 (Sonde #11 / AXBT #10) at 1209 UTC, went direct to our a new WP #5 to the SW of Nate. The reflectivity profile from the TDR for the second pass is shown in Fig. 13.
Upon reaching WP #5 (Sonde #12 / AXBT #11) at 1231 UTC we went inbound on 225° azimuth for a third pass of the center. We determined that we could nearly complete a second Fig. 4 by abbreviating the outbound to the NE to 50 nm, going downwind to do a 50 nm inbound leg at a 315° azimuth from the NW, and turning from the center out to the ENE to do the circles. We did a sonde only release at the midpoint of the inbound leg (Sonde #13) at 1245 UTC, just after we passed through a convective rainband. We arrived near the center (IR imagery, Fig. 14; LF, Fig. 15) around 1257 UTC. We missed the apparent low-level center in the LF just to the SE. We did a sonde/AXBT combo release near our closest approach (Sonde #14 / AXBT #12). The estimated center from the LF (Fig. 15) was 18°5'N / 84°40'W. We stayed heading 035° for the outbound leg and went out about 30-40 nm to WP #6 (Sonde #15 / AXBT #13 at 1307 UTC). The peak SFMR wind on the outbound leg was 46 kt. The conditions at WP #6 appeared to be the best so far to do the SFMR high-incidence angle circles module. The reflectivity profile from the TDR for this third pass is shown in Fig. 16.
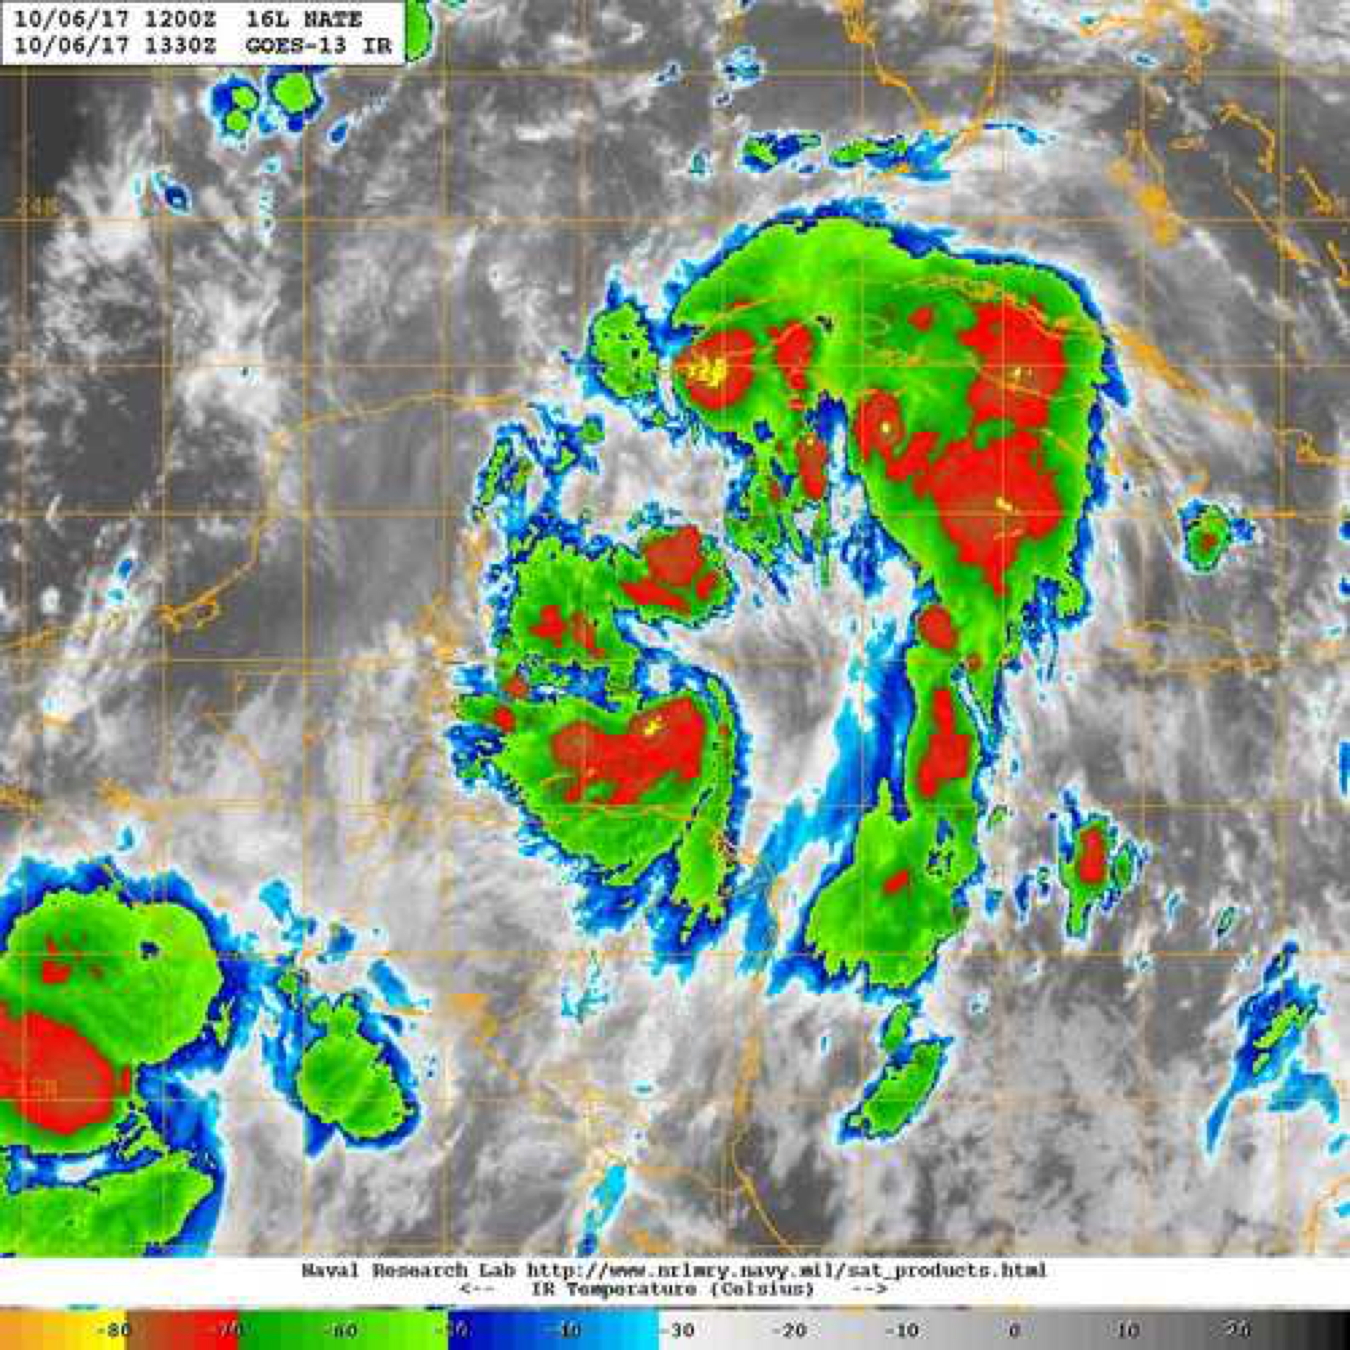
Figure 17. IR imagery at 1330 UTC 6 October, around the time of the fourth and final center pass (image courtesy the Naval Research Laboratory, nrlmry.navy.mil/TC.html) |
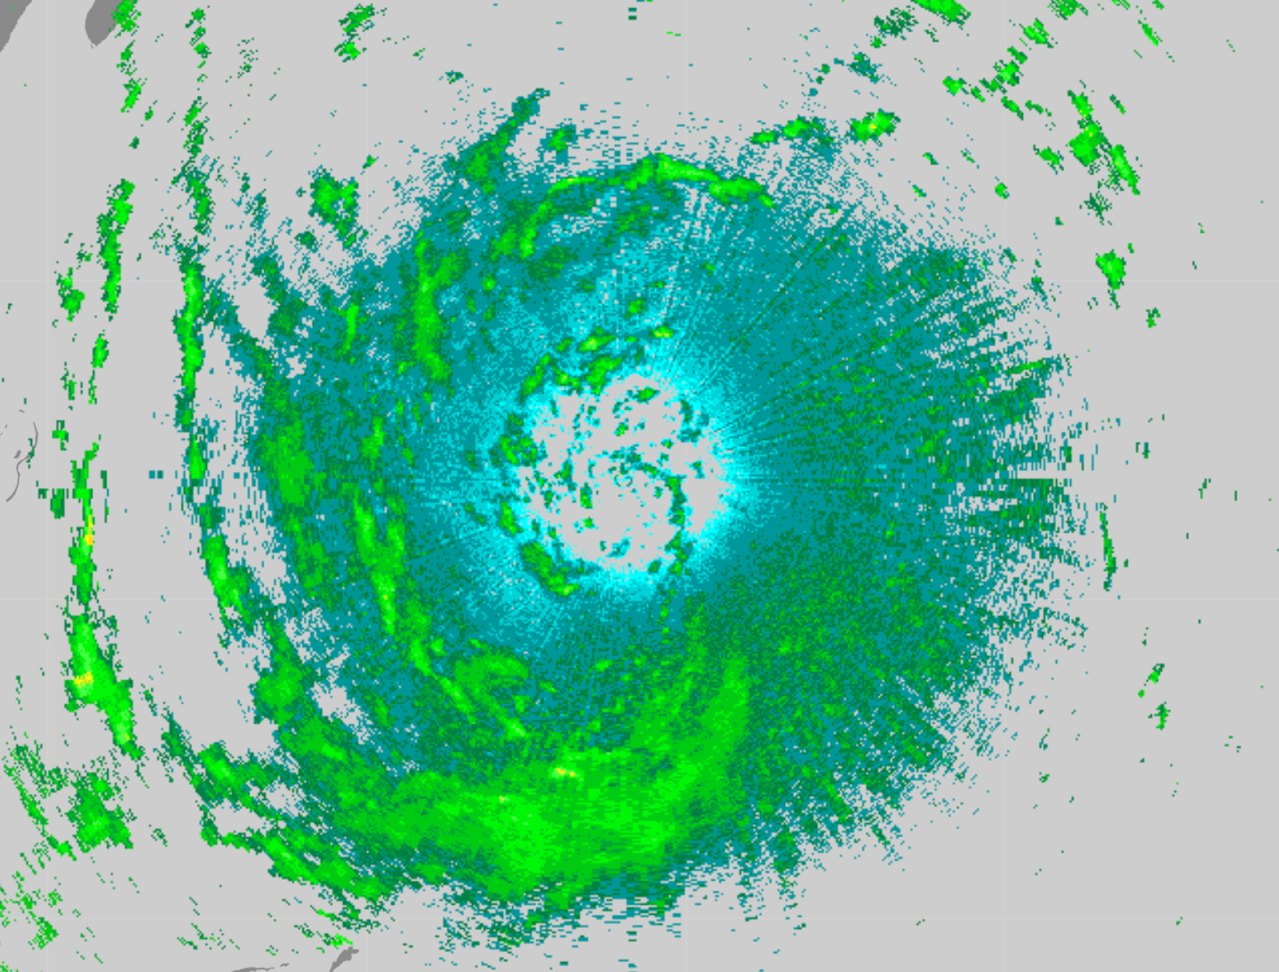
Figure 18. LF imagery at 1331 UTC 6 October |
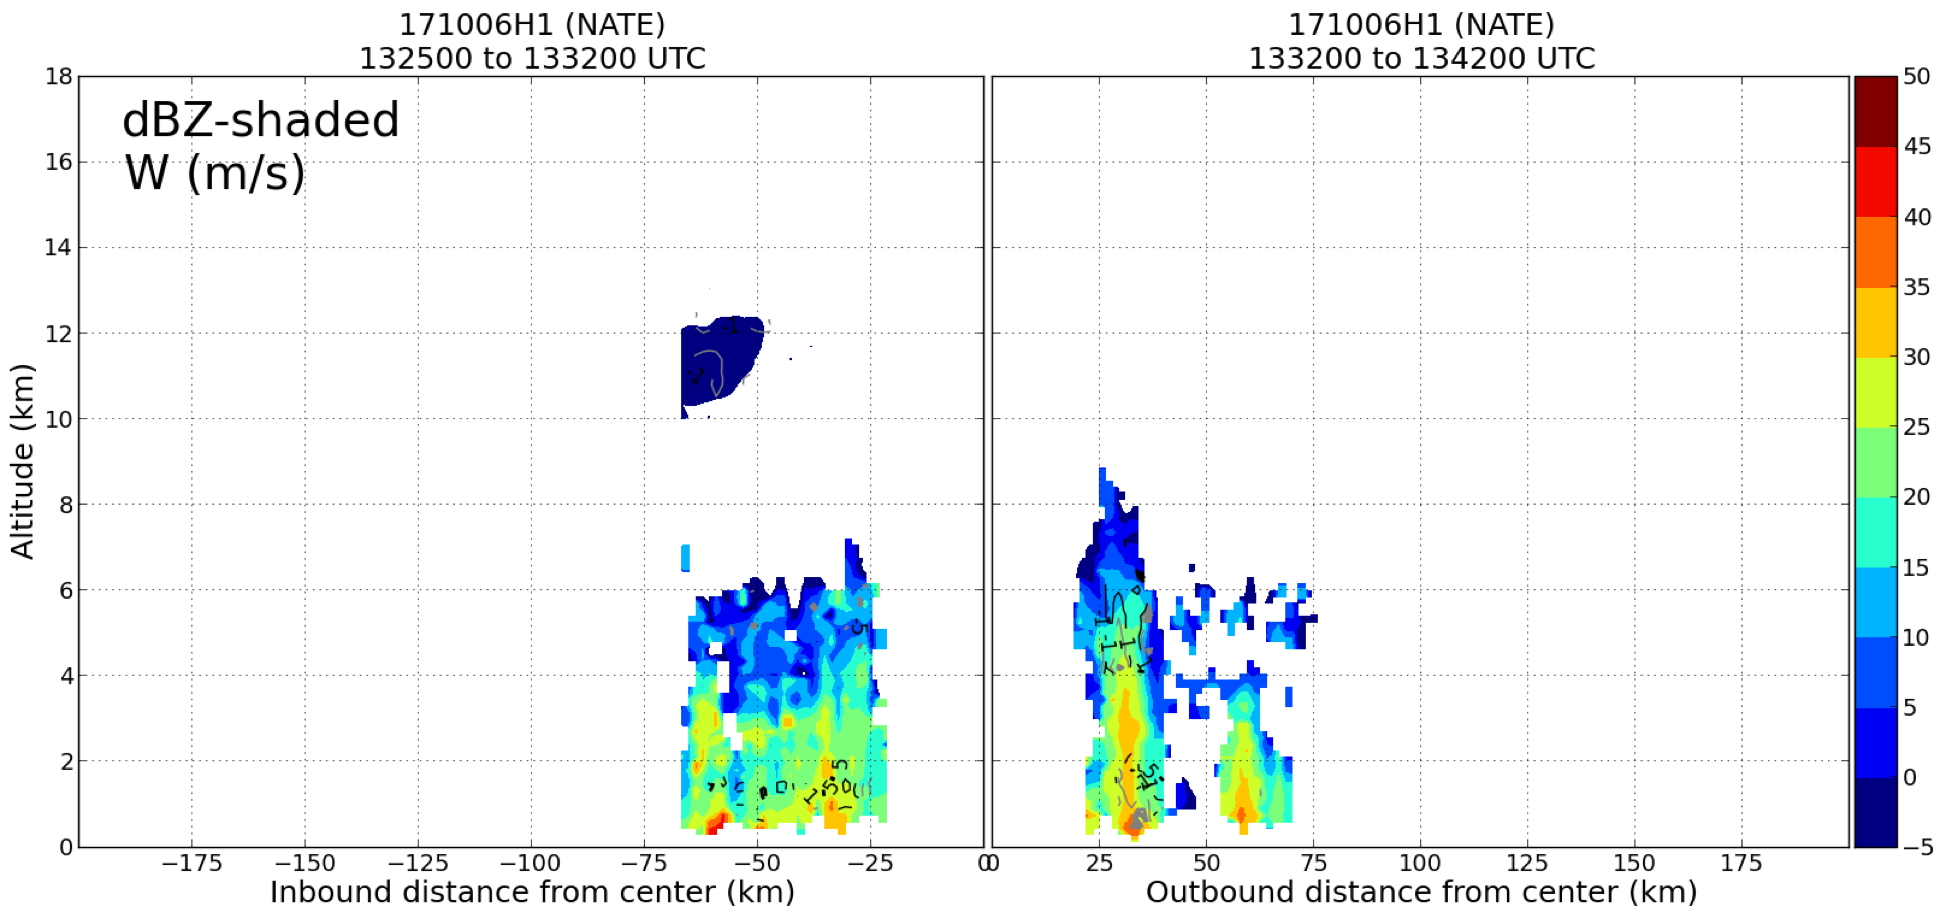
Figure 19. TDR vertical profile analysis of reflectivity (shaded, dBZ) and vertical velocity (contoured, m s-1) for the fourth and final pass (between the WP #7 to the NW and CTR), centered at 1332 UTC |
We proceeded on a short downwind to WP #7 (arrived at 1325 UTC, Sonde #16 / AXBT #14) to do an abbreviated inbound leg on the 315° azimuth. It appears from the satellite that while there is still quite a bit of shallow cloud to the NE, that the depth of the clouds on the NE and E sides of the storms is becoming deeper (IR imagery, Fig. 17). A convective band to the south is trying to wrap around from the S to SE (Fig. 17). It certainly appears that the apparent dry intrusion on the east side of the storm is not actually downshear, but actually upshear. After a short inbound leg (~30 nm), we passed just NE of the center, according to the LF (Fig. 18). The estimated center position from the LF was 18°24'N / 84°42'W. We did not release a combo for this center, as we reserved an AXBT for the SFMR high-incidence angle circles module. The reflectivity profile from the TDR for this fourth and final pass is shown in Fig. 19.
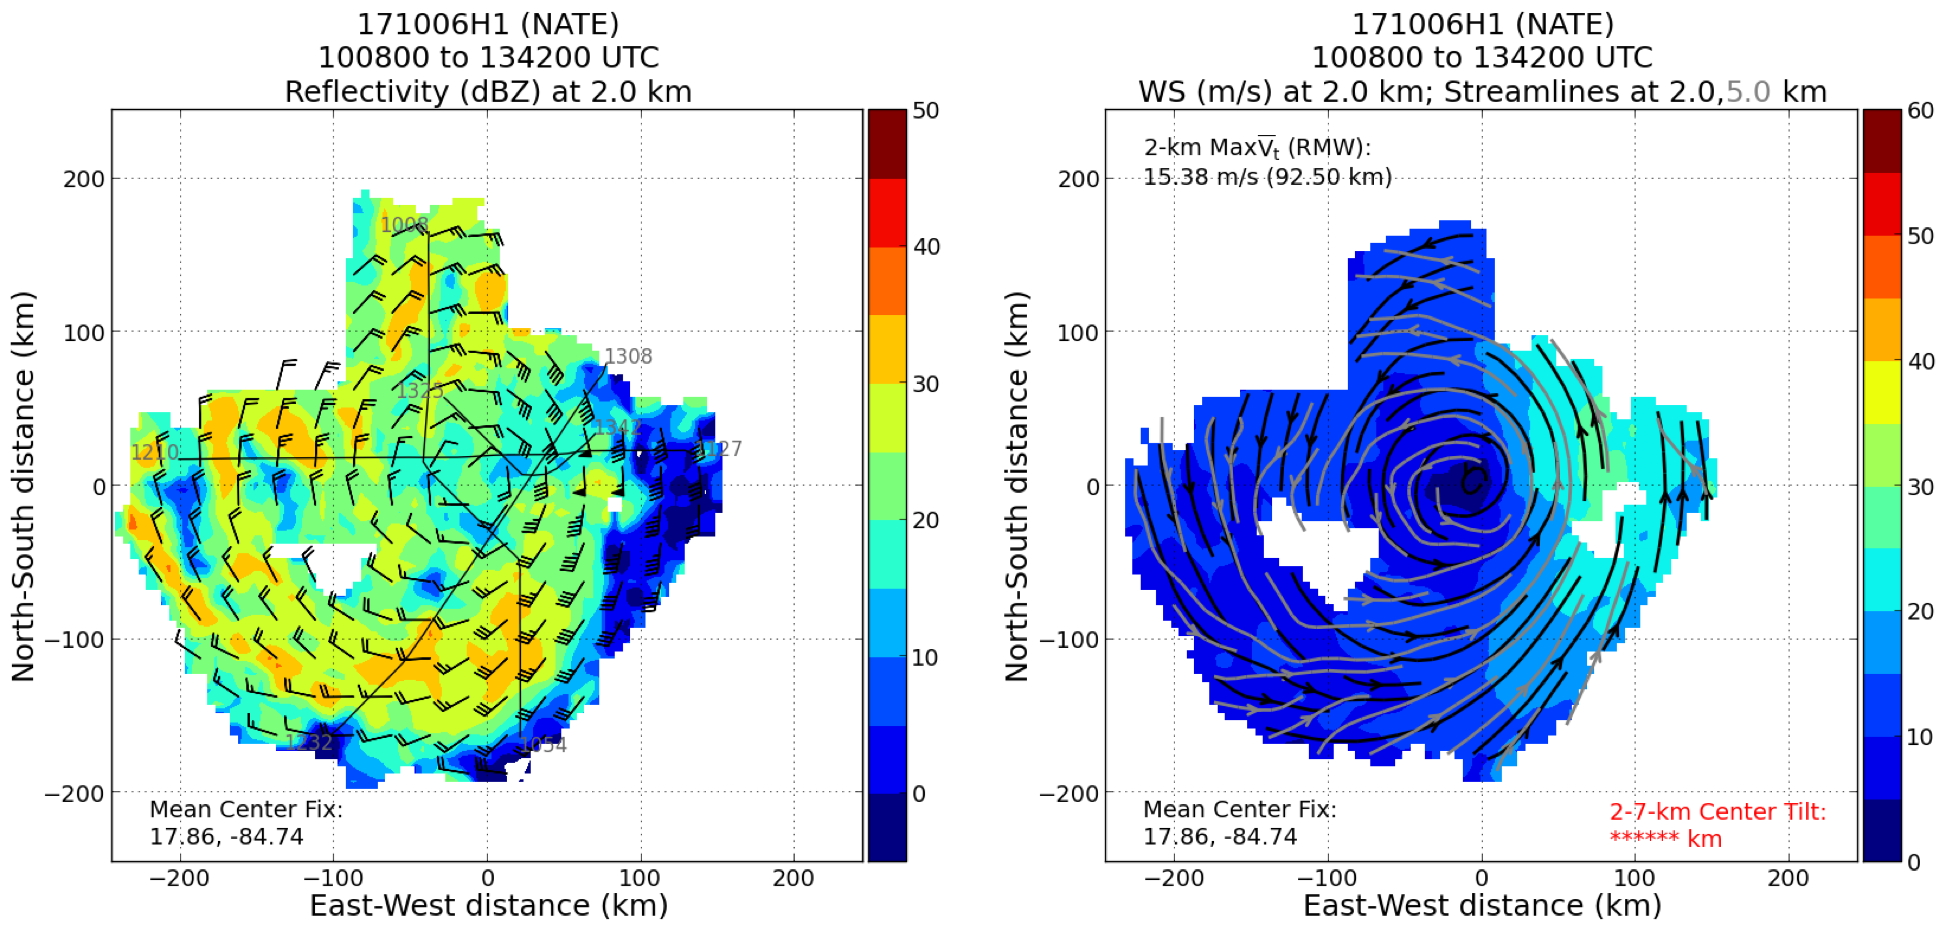
Figure 20. Plan view of reflectivity (dBZ, shaded) at 2 km (left image), as well as the windspeed retrieval at 2 km (shaded) and streamlines at 2 (gray) and 5 (black) km from the TDR |
After our closest approach, we decided that the area just NE of the center had the most ideal conditions (SFMR surface winds > 15 m/s, relative clear conditions below the aircraft FL) for the SFMR high-incidence angle circle module. We began the module around 1340 UTC near 18°34'N / 84°6'W, dropping a sonde (Sonde #17) prior to beginning the circles (the AXBT apparently did not get out of the aircraft). The winds were just greater than 15 m/s, and there were generally just scattered clouds below; the ocean was visible at all times. The AXBT may not have been dropped as a launch detect was not given (multiple attempts were made after the completion of the 30° circles, and after the 45° circles); however, an AXBT released at WP #6 should be adequate for the module. After completing three 30° circles and five 45° circles (left turns), we began our return ferry.
Mission Evaluation/Problems :
The mission successfully completed the first Figure-4 as planned, with the exception of some difficulty finding the initial center on the first inbound leg from the north, and having to shorten the southward outbound leg near the coast, so as to remain at 10 kft (we could have gone higher, 12500 kft, to go over terrain in Honduras, but we decided that it was not worth going that far south as there was not much precipitation, and we would not be able to drop a sonde or AXBT). Although we did not overfly the low-level center on any pass, each pass was close enough (within ~10-15 nm) to the signature on the LF to get a center estimate.
Unfortunately, we were not able to complete the partial circumnavigation in the upshear quadrants (due to potential hazards and time available on station). In fact, while the 0000 UTC SHIPS indicated that the shear direction was from the southwest, the precipitation asymmetry observed would suggest that it was actually from the northeast. Future research into this case, therefore, should place a focus on determining what the actual shear direction was, and the most representative calculation for it. Instead of the partial circumnavigation, we opted instead to proceed at 10 kft in an attempt to complete a full rotated Fig. 4. The wind speed was too low (< 15 m/s) to the west of the storm for the SFMR high-incidence angle module, so we decided not to do the circles in that location. We completed a full 105 nm inbound leg on 225° and an abbreviated 50 nm outbound leg on 035°. We then turn downwind to do an abbreviated (ended up about 30-40 nm) leg from the northwest to southeast. Once reaching our closest approach to the center on that fourth pass, we flew to NE of the center to where we had previously found > 15 m/s SFMR surface winds and only scattered clouds below the aircraft. There we successfully completed (with the exception of the AXBT part of the combo release at the beginning) the SFMR module (three circles at 30° bank angle, five circles at 45°).
So while we did not do the circumnavigation upshear, we were still able to get good radar coverage of the vortex and the azimuthal precipitation distribution in all quadrants (Fig. 20). TDR data was transmitted to EMC. We dropped 17 sondes (the IP had a late launch detect, so that one was backed up), as well as 14 AXBTs (one AXBT was unable to be launched from the aircraft). So that was 14 AXBT/sonde combo releases, distributed well azimuthally and radially around the storm. This should permit a full thermodynamic analysis of the boundary layer in a potentially developing storm.
Overall the storm did not strengthen much while we were on station (perhaps 5 kt, according to NHC advisories). The peak FL wind was about 57 kt, and the peak SFMR surface wind was 46 kt (this was observed to the northeast of the center) (Fig. 7). Deep convection was predominantly observed to the south, west and north; the northeast to eastern regions of the storm lacked any significant deep convection (Fig. 13). In fact, this region (which was presumably upshear, not downshear, as would be the case for the 0000 UTC SHIPS analysis) had little mid-congestus coverage either. We observed mostly shallow cloud tops below the aircraft. This relatively dry region could be a dry air intrusion from the south (with a heavy rainband to the east of it, ~300-400 km from the center), or could be an indication of subsidence if the shear direction is, in fact, from the northeast. As we left the storm, there was some suggestion visually and through satellite that perhaps some mid-congestus was developing just to the east and northeast of the center, which could bode well for increasing the precipitation symmetry of Nate.
The main issue encountered was that we were not able to get power to the DWL computer prior to departure. Attempts were made to get power to it prior to takeoff, but those were not successful. It was assumed to be an issue with the power supply or motherboard.
Jon Zawislak
Oct. 16, 2017
| NetCDF SFMR data | |
Timeseries wind, rain rate, and pressure plots |
|
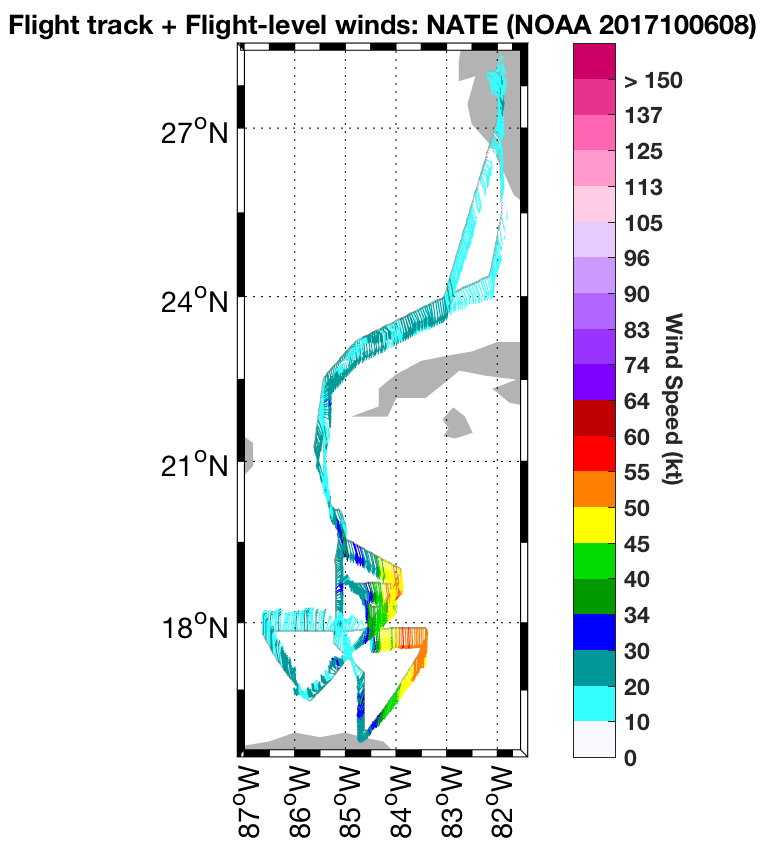
Flight level wind plots full flight |
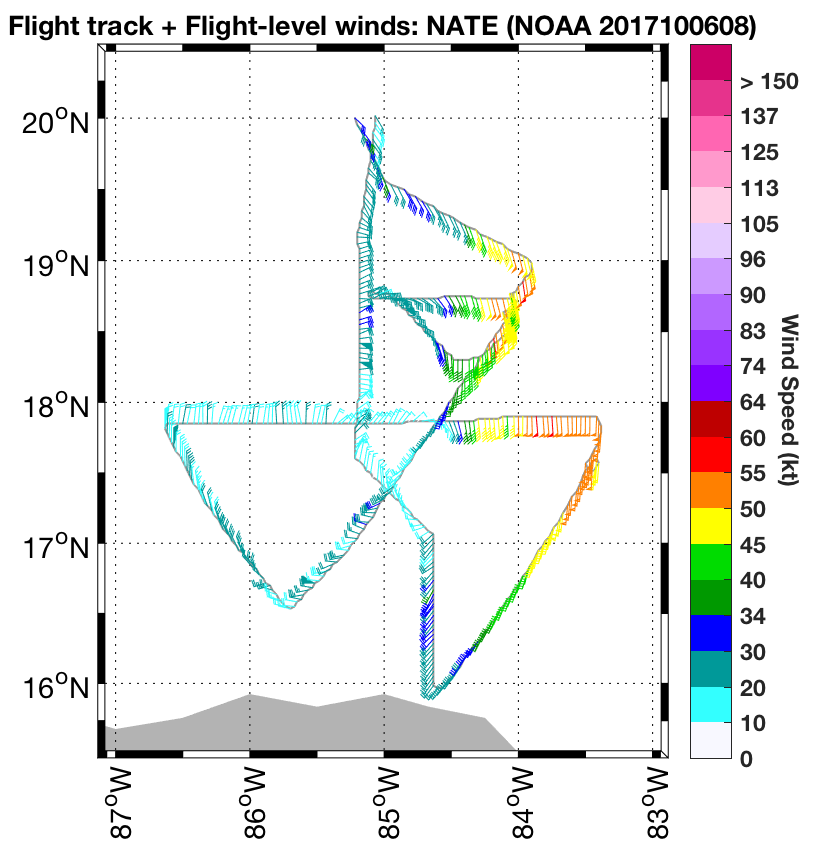
Flight level wind plots in storm |
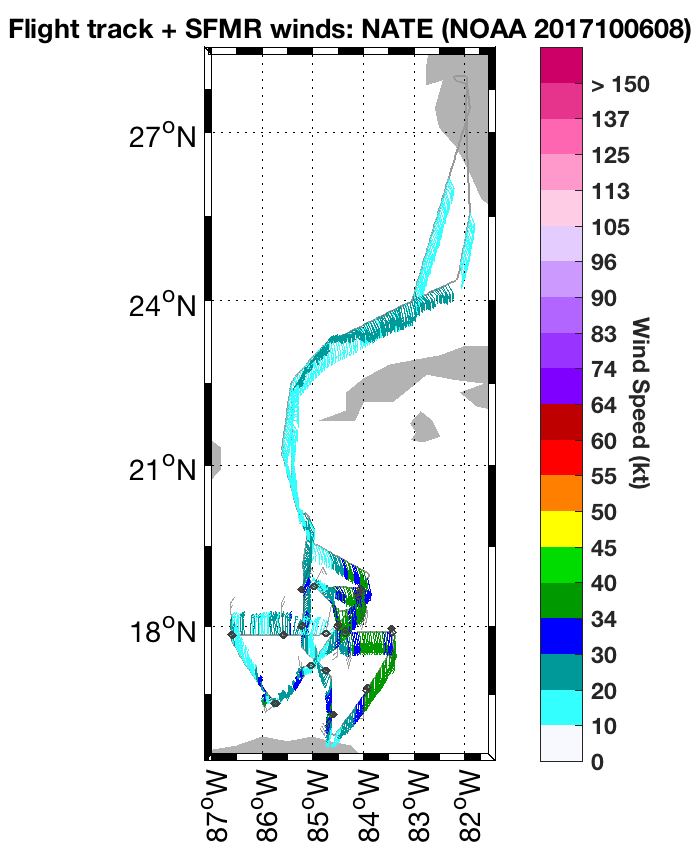
SFMR wind plots full flight |
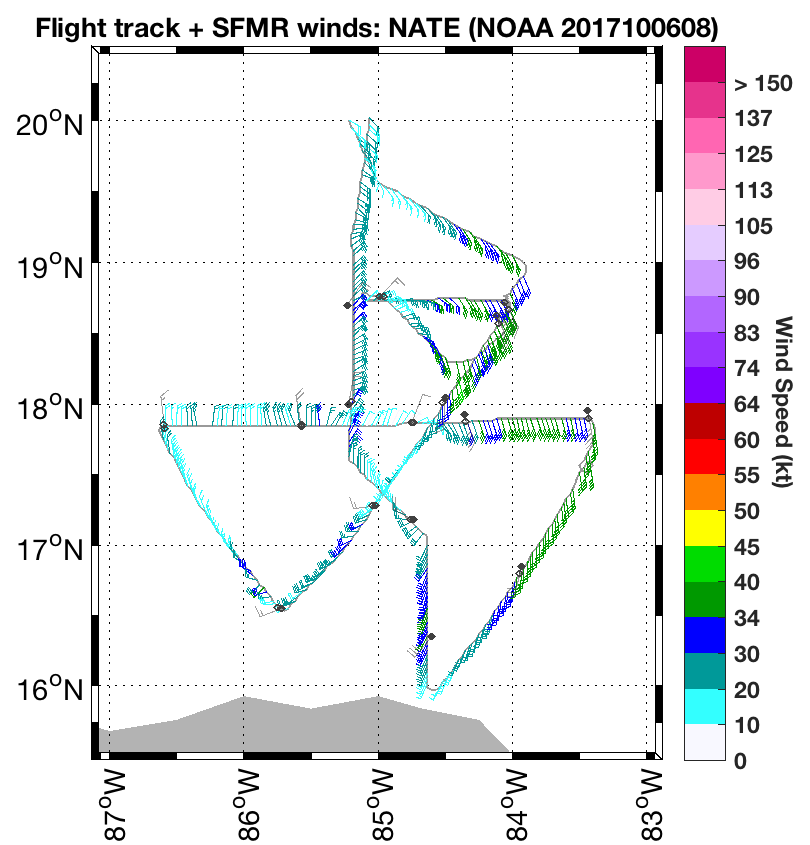
SFMR wind plots in storm |
 Flight track |
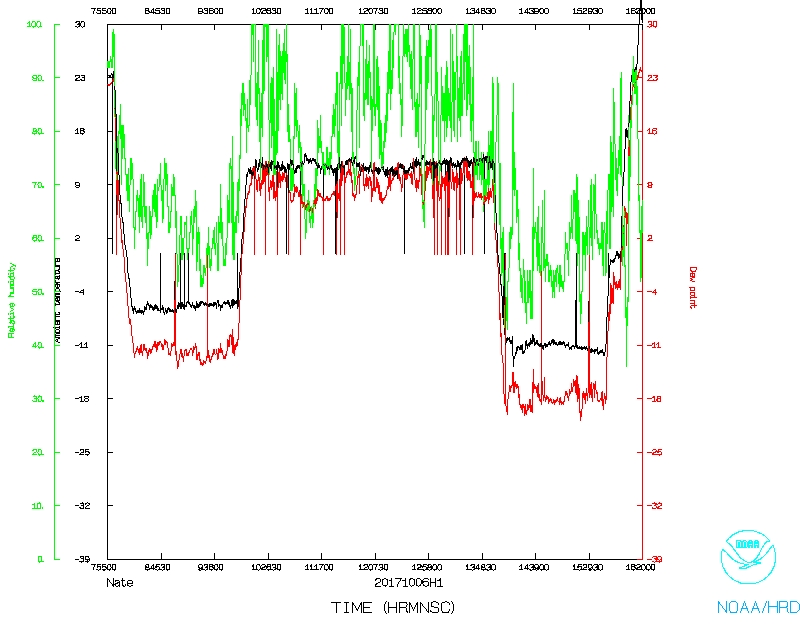 Temperature and Moisture |
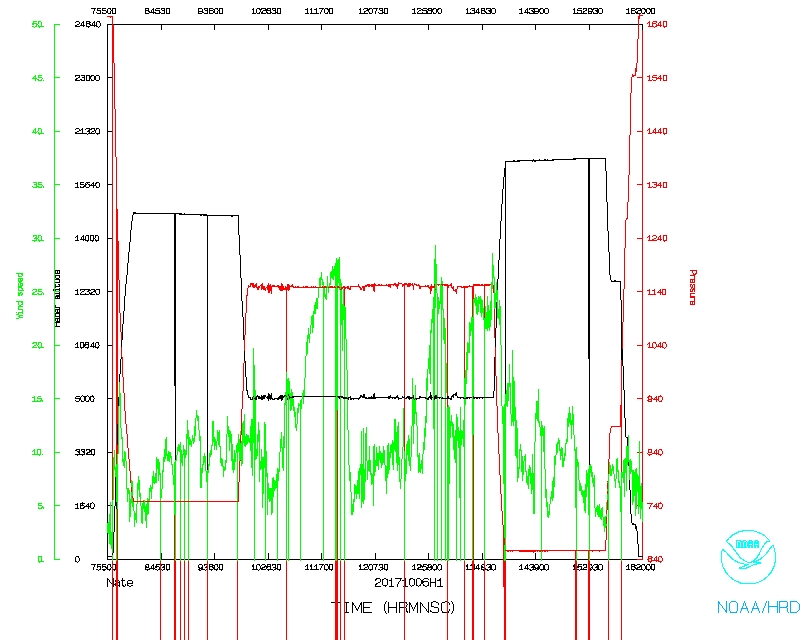 Wind and Atlitude |
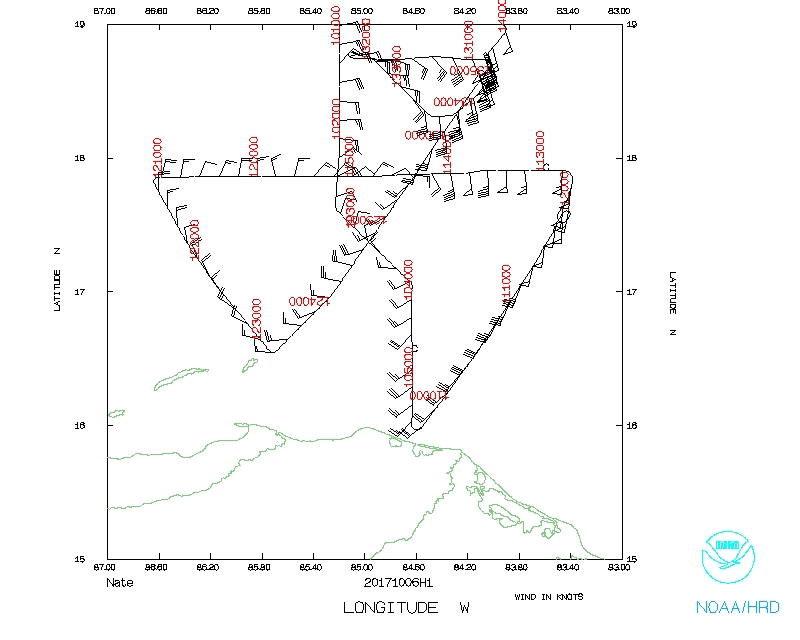 Flight track detail |
Flight Director's manifest
Flight Director's log |
serial data
LPS log |
Radar log |
Drop log |
AXBT log |
DWL log