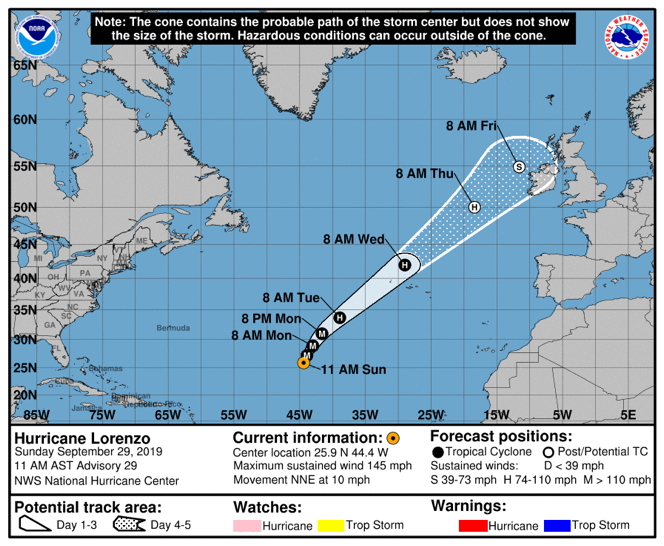
Figure 1: NHC forecast graphic issued at 15Z September 29, 2019. (source: www.nhc.noaa.gov) |
| Aircraft Commander | Pat Didier |
| Co-pilot | John Rossi |
| Co-pilot | Dean Legidakes |
| Flight Engineer | Josh Sanchez |
| Flight Engineer | Chris Lalonde |
| Navigator | Pete Freedman |
| Flight Director | Ashley Lundry |
| Flight Director | Paul Flaherty |
| System Engineer | Joe Greene |
| Data Technician | Dana Naeher |
| Data Technician | Damon Sans Souci |
| AVAPS | Todd Richards |
| LPS | Heather Holbach | HRD |
| Radar | Kelly Ryan | HRD |
| Radar | James Hiywiak | RSMAS |
| Observer | Jezabel Sanchez | NESDIS |
| Radar | John Gamache | HRD |
Mission Plan :
NOAA 43 will fly a NESDIS-tasked Ocean Winds mission in coordination with NOAA 42 into major Hurricane Lorenzo in the Atlantic Ocean. The goal of these missions is to collect data for cross-calibration of the instruments on the two P-3 aircraft. This is the first time in many years that both P-3s will be flying in the same storm at the same time and will provide a complete suite of observations between the two aircraft (TDR, dropsondes, SFMR, UMASS SFMR, IWRAP, WSRA, microphysics).
|
Figure 1: NHC forecast graphic issued at 15Z September 29, 2019. (source: www.nhc.noaa.gov) |
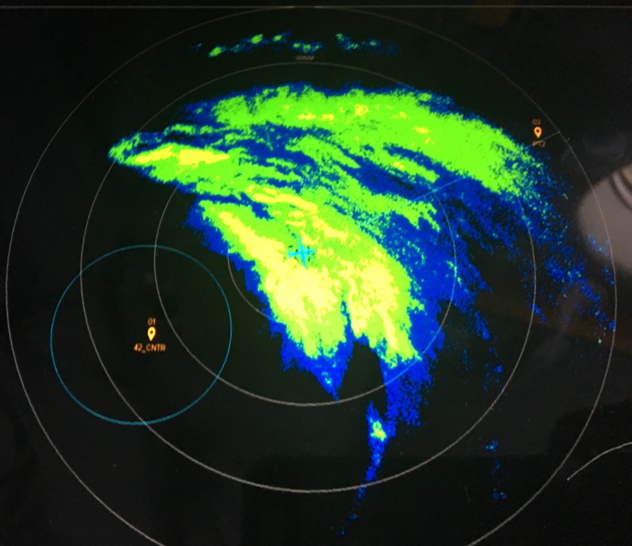
As of 11am AST (1500Z), Lorenzo is a category 4 hurricane with maximum sustained winds estimated at 125kts, minimum central pressure of 938mb, and moving north-northeast (15°) at 9 kts (Fig. 1). Lorenzo underwent rapid intensification (RI) to a category 5 hurricane overnight with the RI possibly beginning during our flight yesterday. Since then, Lorenzo has weakened and its appearance on satellite has degraded. It appears to have a dry slot on the north and west, and the eye is not as distinct. Microwave imagery (Fig. 2) shows that the eyewall may be open on the southwest and that there is a strong convective rainband on the north.
The planned flight track (Fig. 3) is to follow about 15 to 20 minutes behind NOAA 42. We will fly a butterfly pattern with 60 nmi legs. We will be at 10,000 ft radar altitude while NOAA 42 will be at 8,000 ft radar altitude. NOAA 42 will be dropping all of the dropsondes. If we have to deviate, we will choose the path that is closest to NOAA 42’s path or, if we are in the eyewall, we will deviate downwind.
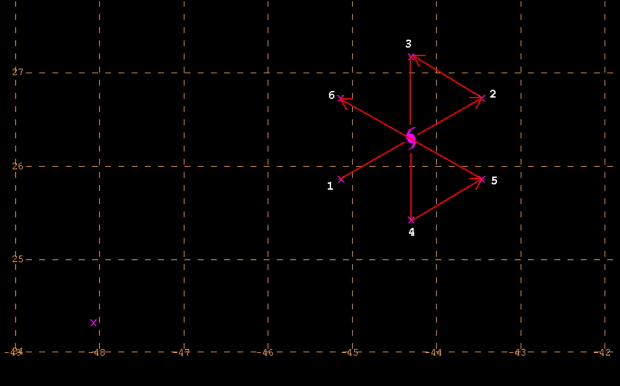
Figure 3: Planned flight track. |
Mission Summary :
| Take off | Landing
| Barbados, BWI
| 14:50 UTC
| Barbados, BWI
| 23:57 UTC
| Penetrations
| 3
| | ||||
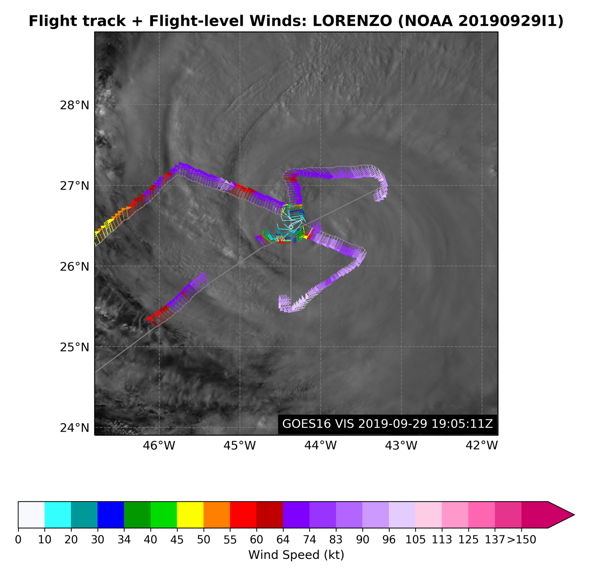
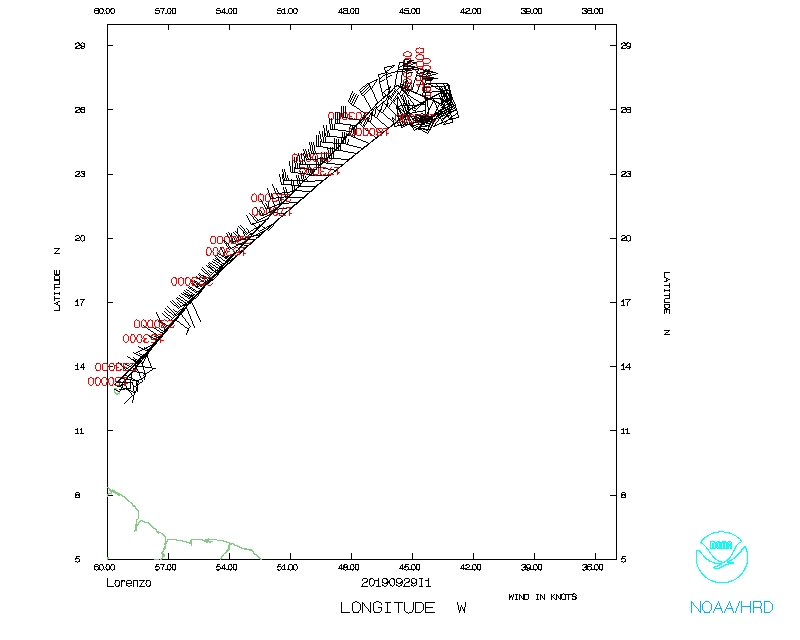
We successfully flew a butterfly pattern coordinated with NOAA 42. The first downwind leg was flown in stratiform precipitation (Fig. 4), so we had to turn slowly and NOAA 42 was having a rough ride at 8,000 ft, which made it difficult to fly the same track as NOAA 42 on that leg. We did not fix any centers, but instead tried to get as close to the center that NOAA 42 passed over. The coordination between the aircraft to line up the flight legs was primarily done via a Xchat channel where the navigators and flight directors were passing coordinates back and forth. This method worked extremely well. Our flight director was then able to add locations to the MMR display, which allowed the LPS to get a better idea of how well the two aircraft were lined up. The last leg was extended to 80 nmi in order to get through a rainband and maximize our data collection in storm. The actual flight track is shown in Figure 5. We did not deploy any dropsondes as NOAA 42 was deploying all of them.
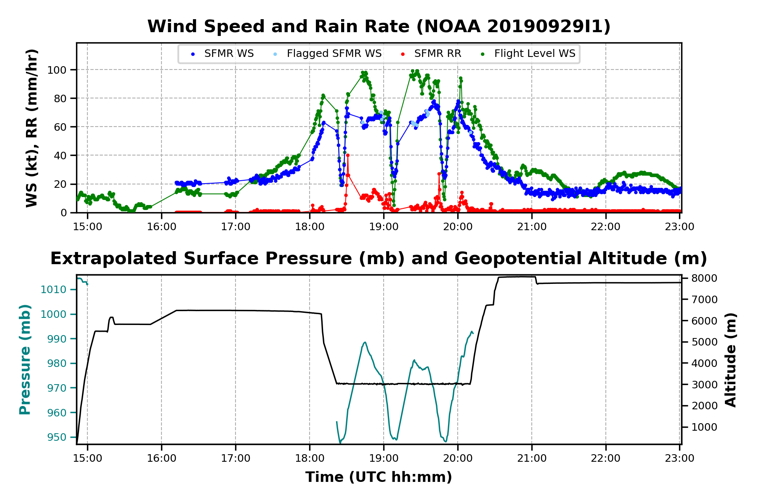
We found maximum flight level winds of 99 kts and SFMR surface winds of 78 kts (Fig. 6). The structure of Lorenzo changed drastically from the previous flight. The flight level wind field was very broad while the surface wind field was weaker than expected suggesting that the boundary layer was decoupling from the mid-level vortex. TDR data was successfully sent to EMC. WSRA data was successfully transmitted to NHC and the significant wave heights are shown in Figure 7.
Mission Evaluation :
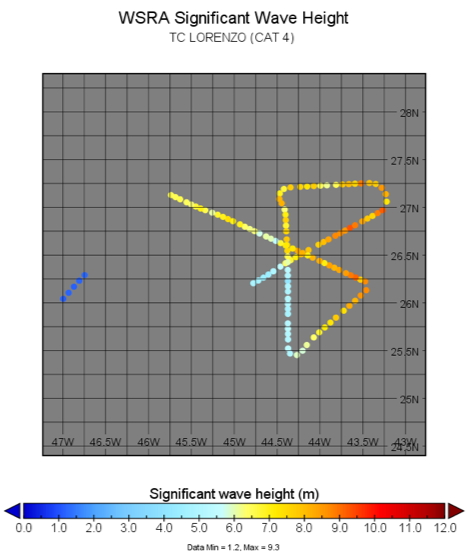
Figure 7: WSRA significant wave height data. (Source: Ivan PopStefanija) |
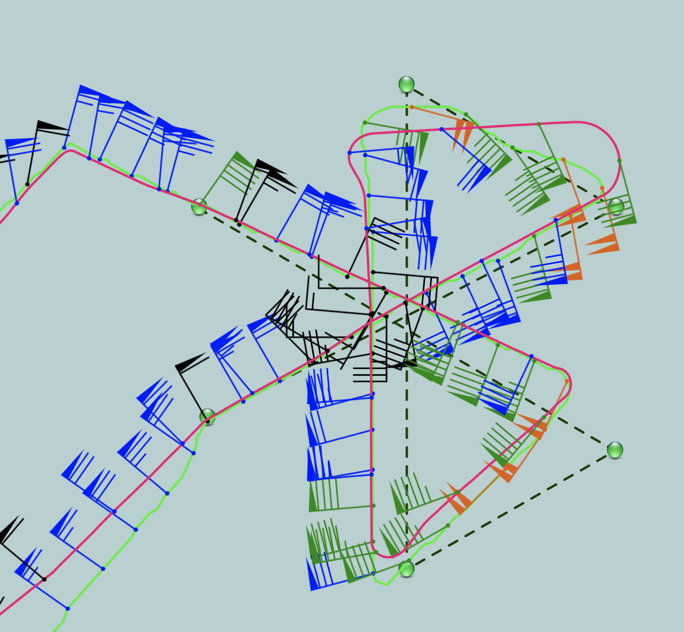
Figure 8: Screenshot from Karma showing how well the tracks from NOAA 42 (green) and NOAA 43 (pink) overlapped. |
Overall, the experiment went very well. All three legs were coordinated extremely well (Fig. 8). The first downwind leg was slightly off from NOAA 42’s track, but the second downwind leg was very close. We maintained about a 17 minute separation from NOAA 42 throughout the entire mission while in the storm. The communication between the two aircraft was excellent and allowed for mission to succeed. This mission helped identify a difference in the measured reflectivities for the two TDRs on the P-3s. NOAA 43’s TDR was measuring lower reflectivities than NOAA 42’s TDR (Fig. 9).
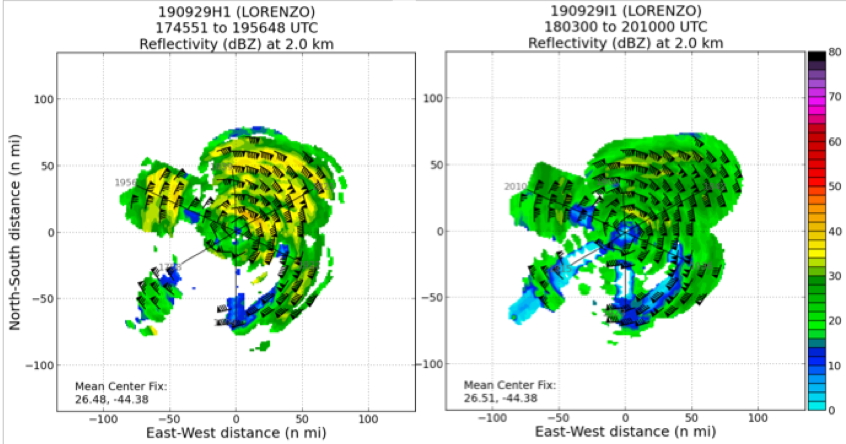
Figure 9: TDR planview reflectivity analyses for NOAA 42 (left) and NOAA 43 (right.) |
Problems :
During the ferry, the SFMR flow to the data systems required troubleshooting. The data flow was fixed at 1612Z. The WMM app wasn’t receiving data every 7-10 seconds, although all of the data was being recorded on the aircraft. This only affected the data going into the averages for the HDOBs. There were never enough missing data points to cause errors with the HDOBs.
Heather Holbach
Dec. 18, 2019
 Flight track |
 Temperature and Moisture |
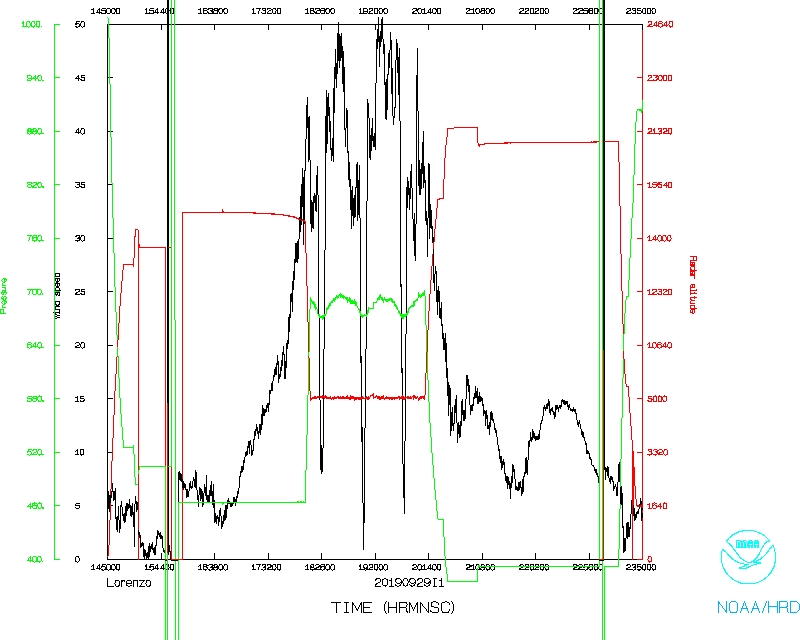 Wind and Atlitude |
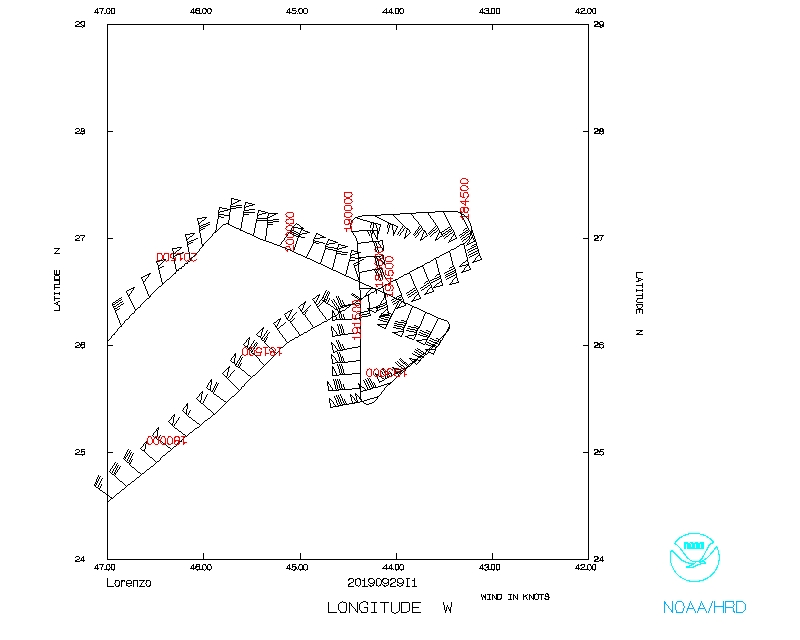 Flight track (detail) |