Mission Summary
20190928I1 Aircraft 43RF
Ocean Winds
Aircraft Crew (43RF)
| Aircraft Commander | Pat Didier
|
| Co-pilot | John Rossi
|
| Co-pilot | Dean Legidakes
|
| Flight Engineer | Josh Sanchez
|
| Flight Engineer | Chris Lalonde
|
| Navigator | Pete Freedman
|
| Flight Director | Ashley Lundry
|
| Flight Director | Paul Flaherty
|
| System Engineer | Mac McAlister
|
| Data Technician | Dana Naeher
|
| AVAPS | Todd Richards
|
Science crew (43RF)
| LPS/Radar | Heather Holbach | HRD
|
| Dropsonde | Kelly Ryan | HRD
|
| LPS | Paul Chang | NESDIS
|
| Observer | Zorana Jelenak | NESDIS
|
| Observer | Jezabel Sanchez | NESDIS
|
| Observer | James Hiywiak | RSMAS
|
Science crew (Ground)
| Radar | John Gamache | HRD
|
Mission Plan :
NOAA 43 will fly a NESDIS-tasked Ocean Winds/SFMR Validation mission into major Hurricane Lorenzo in the Atlantic Ocean. This season NOAA 43 is instrumented with the WSRA and the UMASS Simultaneous-Frequency Microwave Radiometer in addition to the operational suite of instruments. After undergoing numerous upgrades over the past several years, this will be NOAA 43’s first science flight since Hurricane Matthew in 2016! The flight will be conducted at 10,000 ft radar altitude, which is within the optimal operating altitude of the WSRA and the use of radar altitude will minimize any changes in pitch angle for the SFMRs.
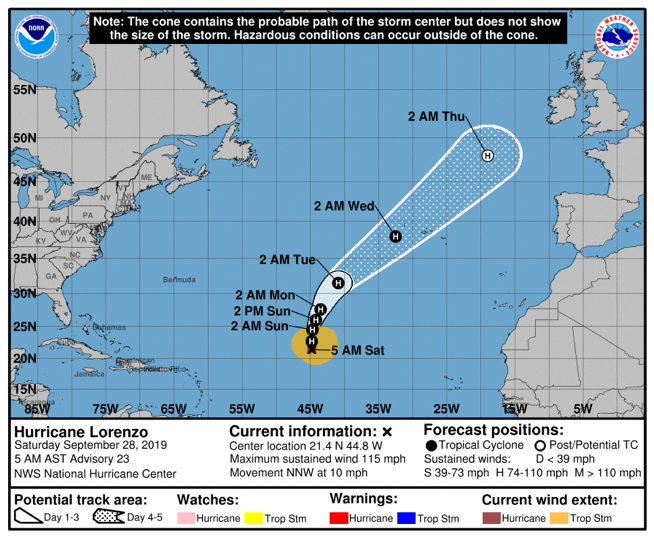
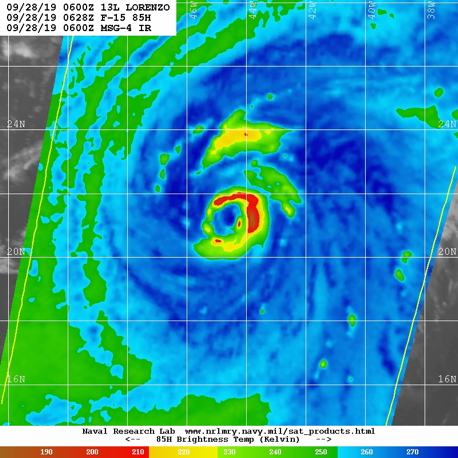
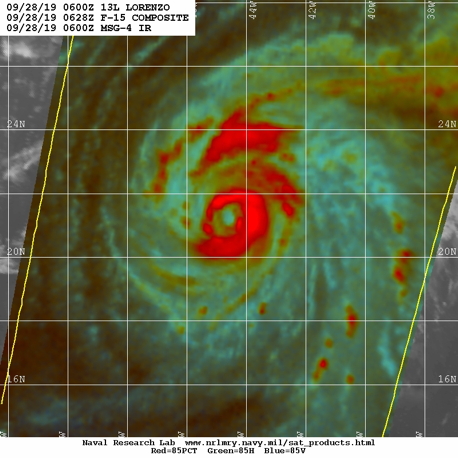
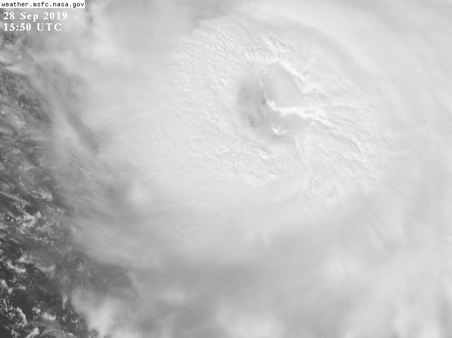
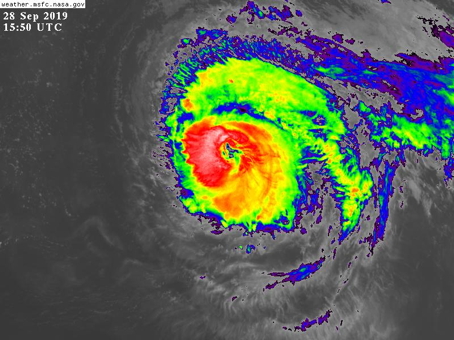
As of 5am AST (0900Z), Lorenzo is a category 3 hurricane with maximum sustained winds estimated at 100kts, minimum central pressure of 957mb, and moving northwest (330°) at 9 kts (Fig. 1). NHC noted that the various satellite intensity estimates ranged from 77 to 110 kts, so there is quite a bit of uncertainty in the intensity estimate. This flight will provide the first aircraft measurements of Lorenzo. Microwave imagery indicates that Lorenzo may just be completing an ERC and the new eyewall is estimated to be about 40-45 n mi wide (Fig. 2). The eye appears quite ragged in IR and visible imagery (Fig. 3), which is likely another indicator of the reorganization of the inner core. Lorenzo is in a region of light west - southwest shear, but satellite imagery suggests that is not hindering it too much. Lorenzo is currently making its forecasted northward turn and is expected to slowly weaken.
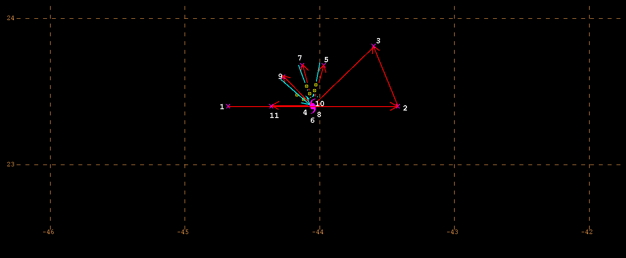
The planned flight track is to come inbound from the west for 70 n mi then fix the center for NHC and continue outbound for 50 n mi (Fig. 4). A dropsonde will be released at the IP and center. After the initial pass through the storm, we will begin a sequence of in-out legs through the eyewall rotating downwind. Dropsondes will be released in rapid succession through the high-gradient region of the eyewall on the inbound leg and then the splash locations will be overflown on the outbound legs. The plan is to alternate these legs in length between 50 and 30 n mi. We will fly as many in-out legs as possible in the time available for the in-storm portion of the mission.
Mission Summary :
| Take off
| Landing
| Barbados, BWI
| 14:04 UTC
| Barbados, BWI
| 23:25 UTC
|
| Penetrations
| 4
| |
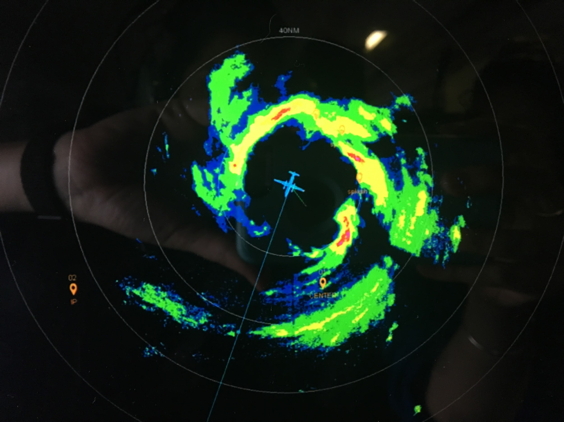
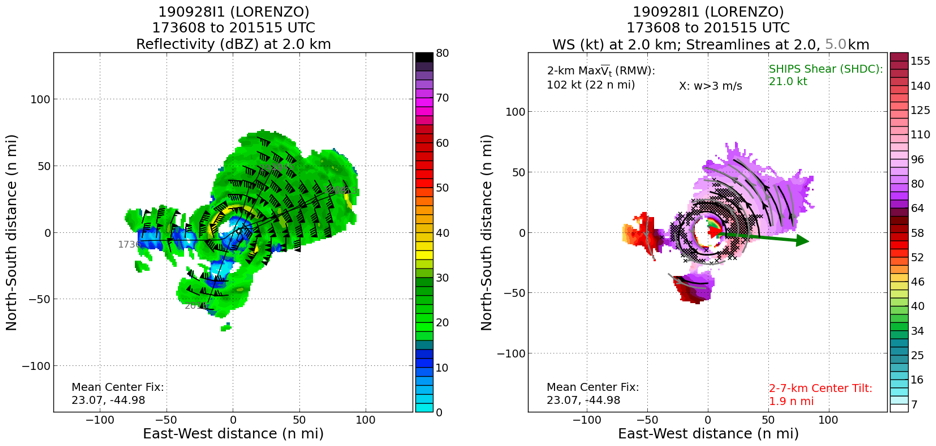
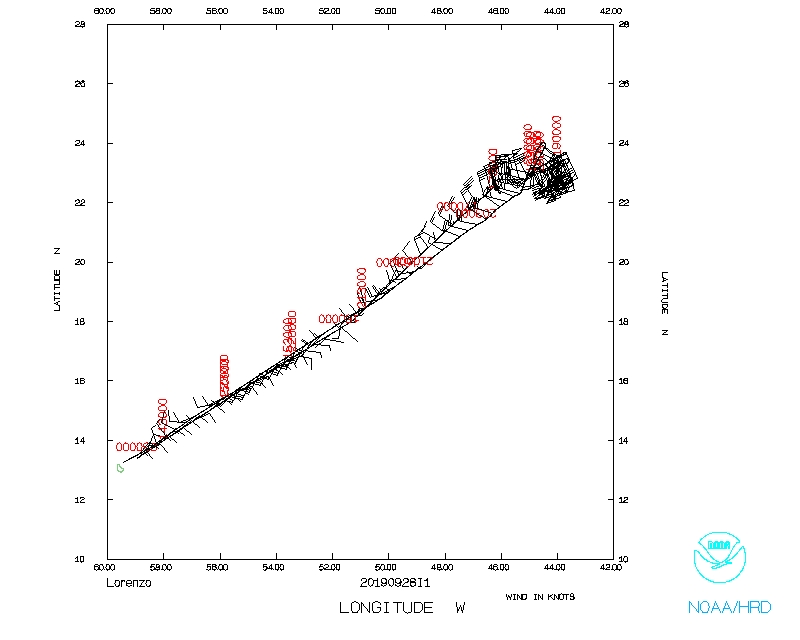
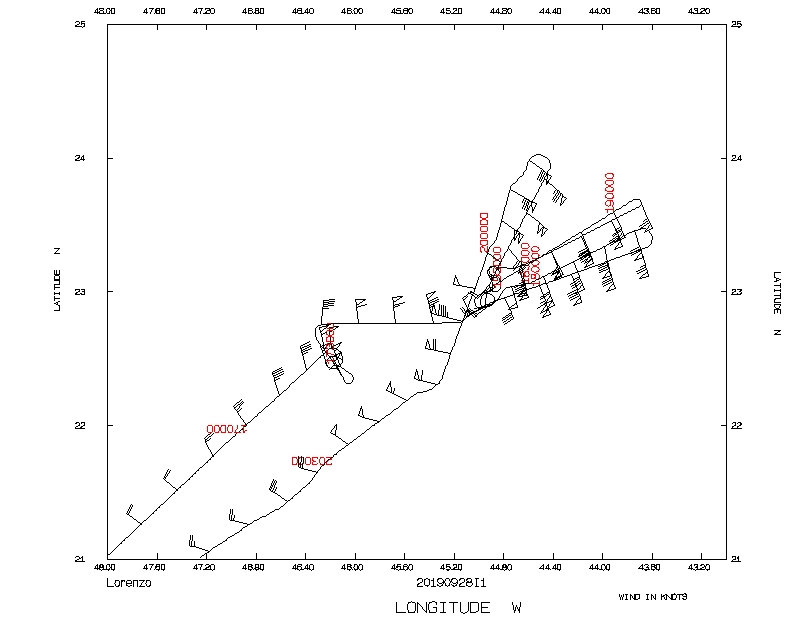
The mission began with a 70 n mi inbound leg from the east-southeast to the center where we fixed the center for NHC. A dropsonde was deployed at the IP and in the center. The eye was estimated to be 34 n mi wide. Following the center fix, we proceeded outbound to the north-northeast until we reached a region that was safe to turn back inbound. On the next inbound leg, we released 2 mini-sondes outside of the eyewall and then 4 regular dropsondes in rapid succession through the high gradient region of the eastern eyewall. Upon re-entering the eye, we orbited until obtaining the splash locations for the dropsondes released in the eyewall. We then flew outbound through the eyewall to overfly the splash locations of the dropsondes released on the previous inbound leg. We then repeated the in-out sequence releasing 2 mini-sondes outside of the eyewall and 4 regular dropsondes in rapid succession. Given the time constraints, we decided to launch 4 more dropsondes in the eyewall on the next outbound leg, while overflying the previously launched dropsondes. We then overflew the splash locations for the final sequence of rapid release dropsondes on our last inbound leg from the north. On the final inbound leg, we also released a sequence of 4 mini-sondes and then 2 more mini-sondes on the final outbound leg to the southeast. The actual flight track is shown in Figure 5. The MMR indicated that there may have been several meso-vorticies forming in the eyewall on the last pass through (Fig. 6).
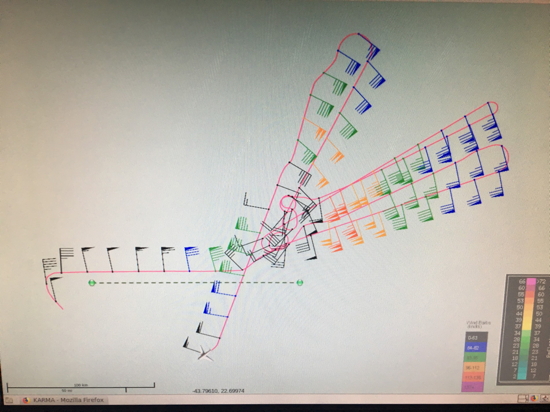
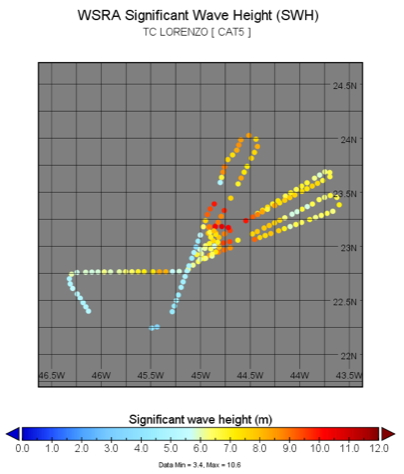
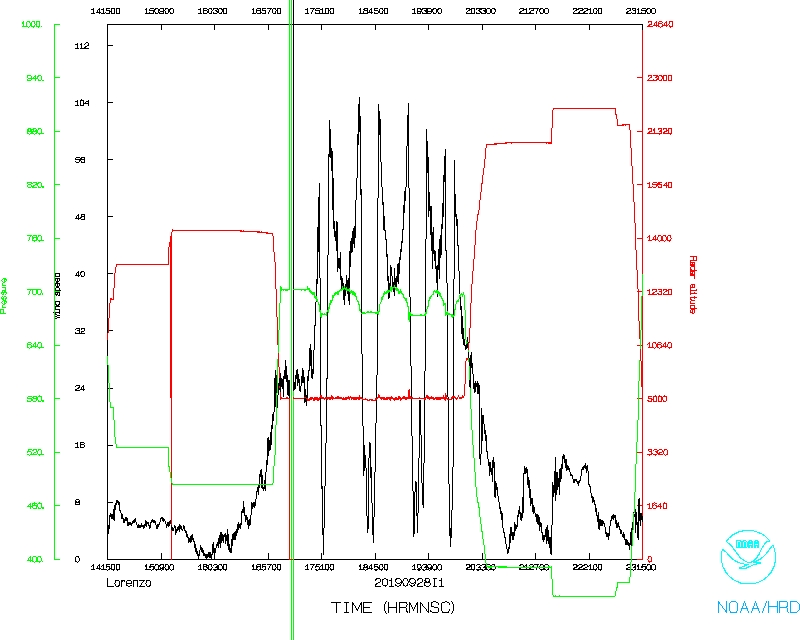
In total, 14 regular dropsondes and 10 mini dropsondes were deployed. All dropsondes were good and 11 of the 14 regular dropsondes were transmitted. TDR data was successfully sent to EMC. Figure 7 displays the final planview analysis from the TDR. WSRA data was successfully transmitted to NHC and the significant wave heights are shown in Figure 8.
We found maximum flight level winds of 126 kt and SFMR surface winds of 112kts (Fig. 7). NHC used this data to increase Hurricane Lorenzo’s intensity to 115 kt (category 4) with a minimum central pressure of 950 mb.
Mission Evaluation :
Miss Piggy’s first science mission since 2016 was extremely successful! For the first time, we were able to collect coincident SFMR, UMASS SFMR, dropsonde, and WSRA data to help validate the SFMRs. These data are incredibly important given the recent concern of the SFMR performance in major hurricanes.
Problems :
There was an issue with the data systems that forced us to loiter at the IP for a short time before beginning our inbound leg. ASPEN had some minor issues and the new iPad displays were freezing up.
Heather Holbach
Dec. 19, 2019
Mission Data :
Flight Director's log |
Flight Director's manifest |
NetCDF data
LPS log |
Radar log |
Drop log
1 second data
Page last updated January 17, 2020
Return to Mission page.