| Aircraft Commander | Nate Kahn |
| Co-pilot | Adam Abitol |
| Co-pilot | Pat Didier |
| Flight Engineer | Ken Heystek |
| Flight Engineer | Mike Sanchez |
| Navigator | Sam Urato |
| Flight Director | Rich Henning |
| System Engineer | Joe Greene |
| Data Technician | Mike Mascaro |
| Dropsonde Operator | Akshar Patel |
| Heather Holbach | LPS | HRD |
| Kelly Ryan | Radar | HRD |
| Lisa Bucci | DWL | HRD |
| Kathryn Sellwood | Dropsonde | HRD |
| Hayley Betker | Observer | NOAA Corps |
| Caleb Brown | Observer | US Navy |
| Tina Samll | Observer | NWS Honolulu |
| Radar | John Gamche | HRD |
Mission Plan :
NOAA 42 will fly a rotated Fig-4 pattern for an EMC-tasked mission into Major Hurricane Lane in the Central Pacific. Additional research goals of this mission are to collect Doppler Wind Lidar (DWL) data and high-incidence angle SFMR data. The flight will be conducted at 8,000 ft pressure altitude, which is the optimal altitude for the Wide-Swath Radar Altimeter (WSRA) and to remain unpressurized for internal AXBT drops.
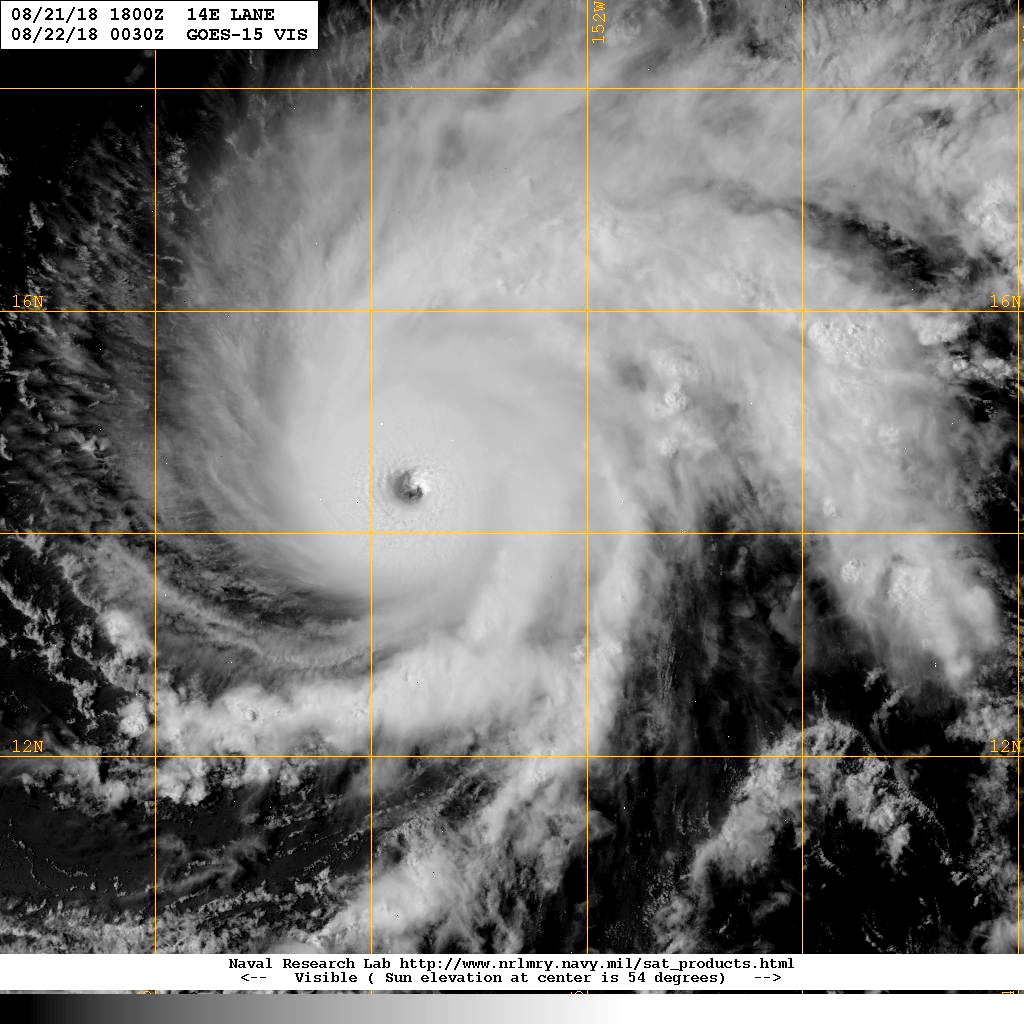
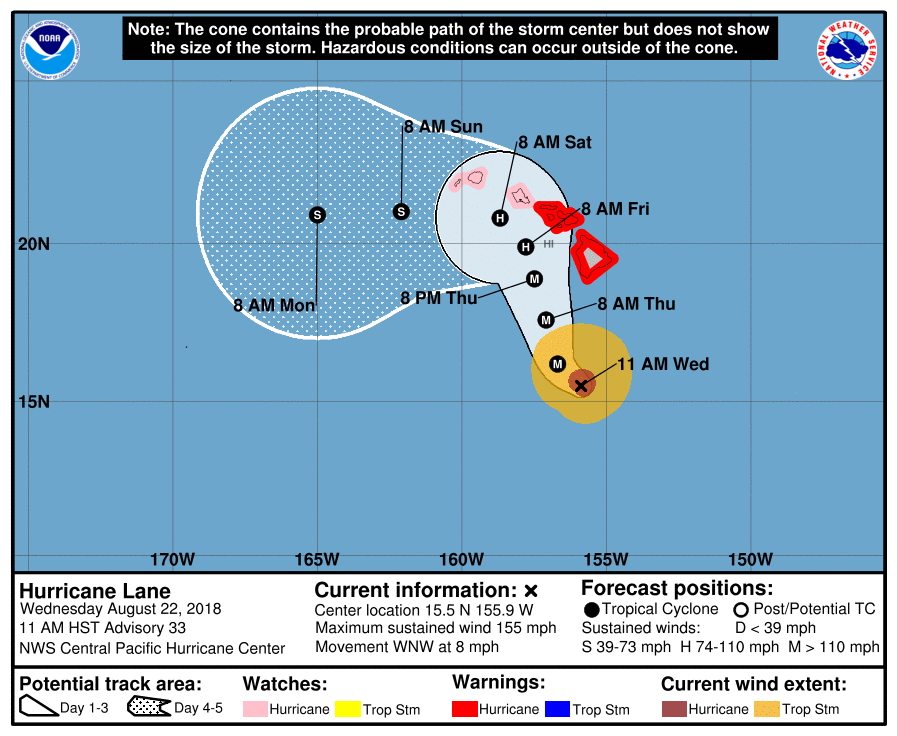
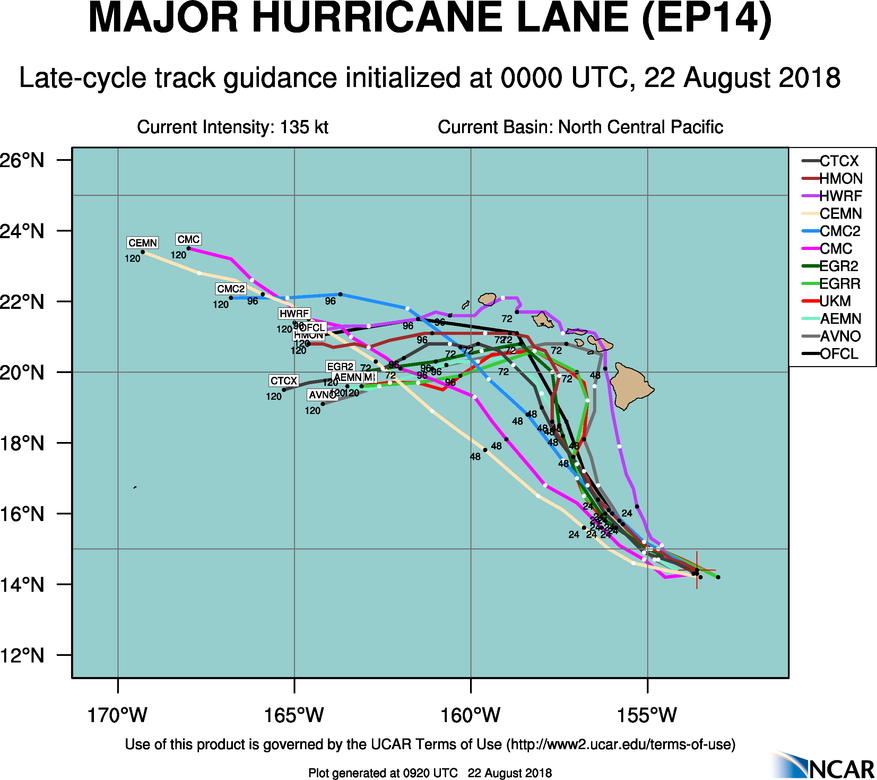
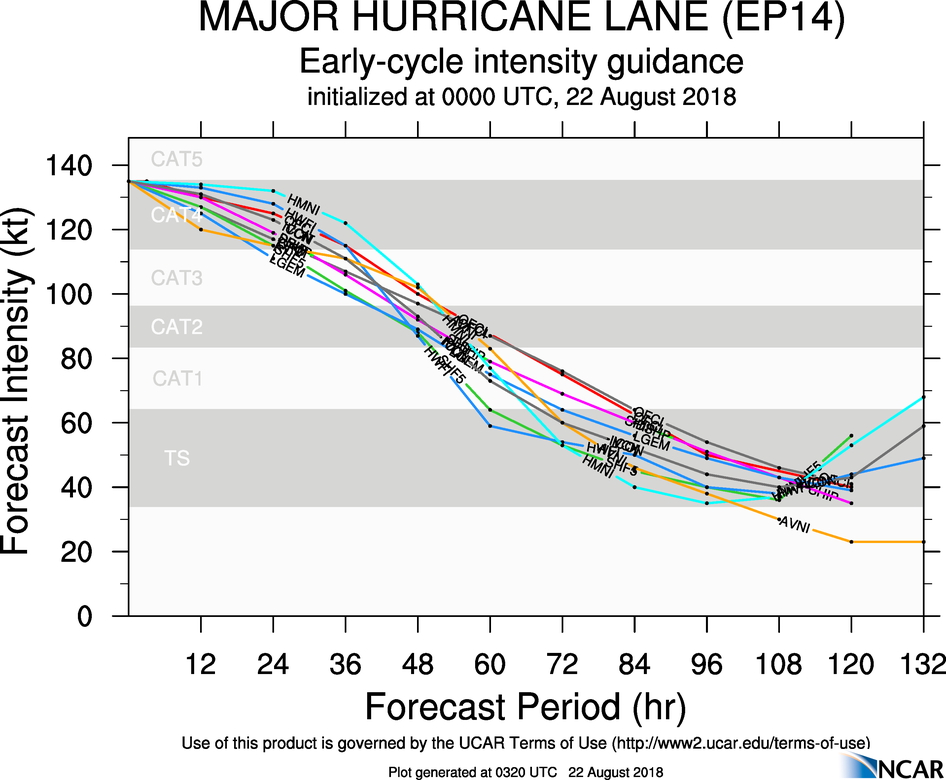
As of 11AM HST (2100 UTC) CPHC forecast advisory has Hurricane Lane with maximum sustained winds of 135kts and minimum surface pressure of 929 mb centered at 14.3N 153.2W moving 295° at 7 knots. Lane has been intensifying (possibly rapidly) for the past 24+ hours and has a clear stadium eye on visible imagery (Fig. 1). The state of Hawai'i is in the forecast cone (Fig. 2) and at 0300 UTC, a hurricane warning was issued for Hawai'i and Maui counties and a hurricane watch was issued for Oahu county. However, there is still quite a bit of uncertainty in the forecast track and to what extent Lane will impact Hawai'i (Fig. 3). The intensity forecast for Lane is for it to begin weakening over the next 36 hours and continue to weaken after that (Fig. 4).
The planned flight plan is a rotated Fig-4 (Fig. 5) with the possibility of SFMR circles and a partial circumnavigation for the DWL. Dropsondes at endpoints, midpoints, RMW. AXBTs for SFMR circles and as close as possible to 15.1°N 153.7°W and possibly RMW.
|
Prepared by the Hurricane Research Division August 21, 2018 2:30 PM Aircraft: N42RF Proposed takeoff: 22/0200Z
DROP LOCATION TABLE
| #
| LAT
| LON
| RAD/AZM
| Time
|
| deg min
| deg min
| nm/deg
| hr:min
| 1S | 14 42 | 155 42 | 105/270 | 1:18
| 2S | 14 42 | 152 06 | 105/090 | 2:13
| 3S | 16 27 | 153 54 | 105/000 | 2:52
| 4S | 12 57 | 153 54 | 105/180 | 3:48
| 5S | 13 28 | 152 38 | 105/135 | 4:09
| 6S | 15 56 | 155 11 | 105/315 | 5:05
| 7S | 13 28 | 155 10 | 105/225 | 5:44
| 8S | 15 56 | 152 37 | 105/045 | 6:39
| | ||||||||||||||
Mission Summary :
| Take off | Landing
| Honolulu, HI
| 01:54 UTC
| Honolulu, HI
| 09:34 UTC
| Penetrations
| 3
| | ||||
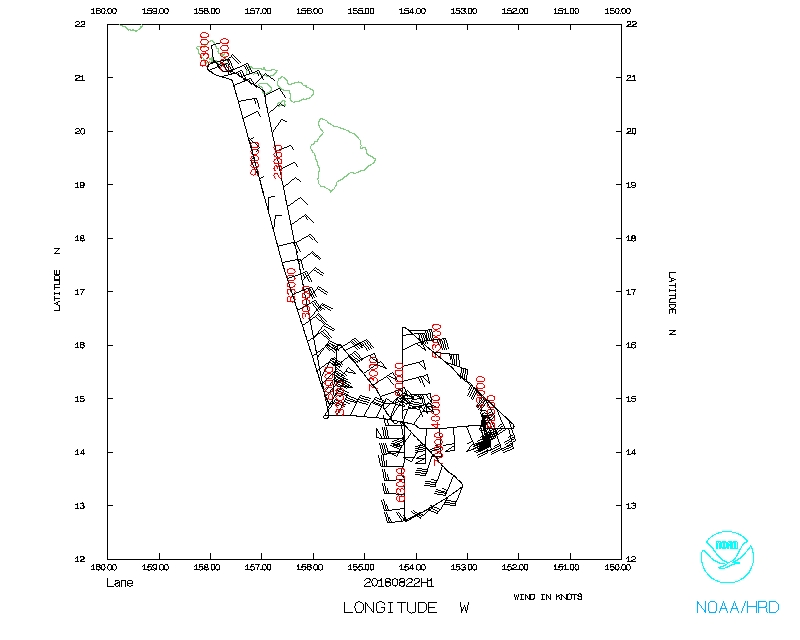
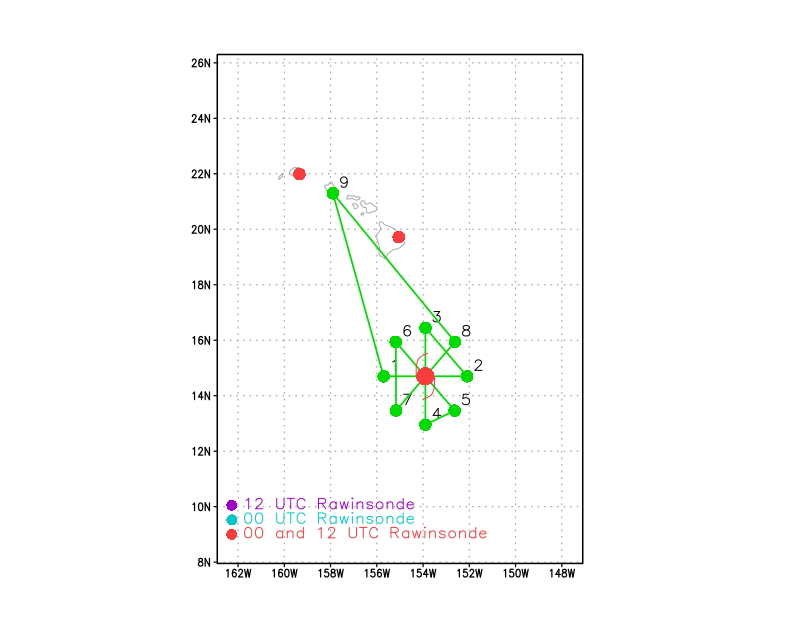 Figure 5: Proposed flight track for mission 20180822H1. |
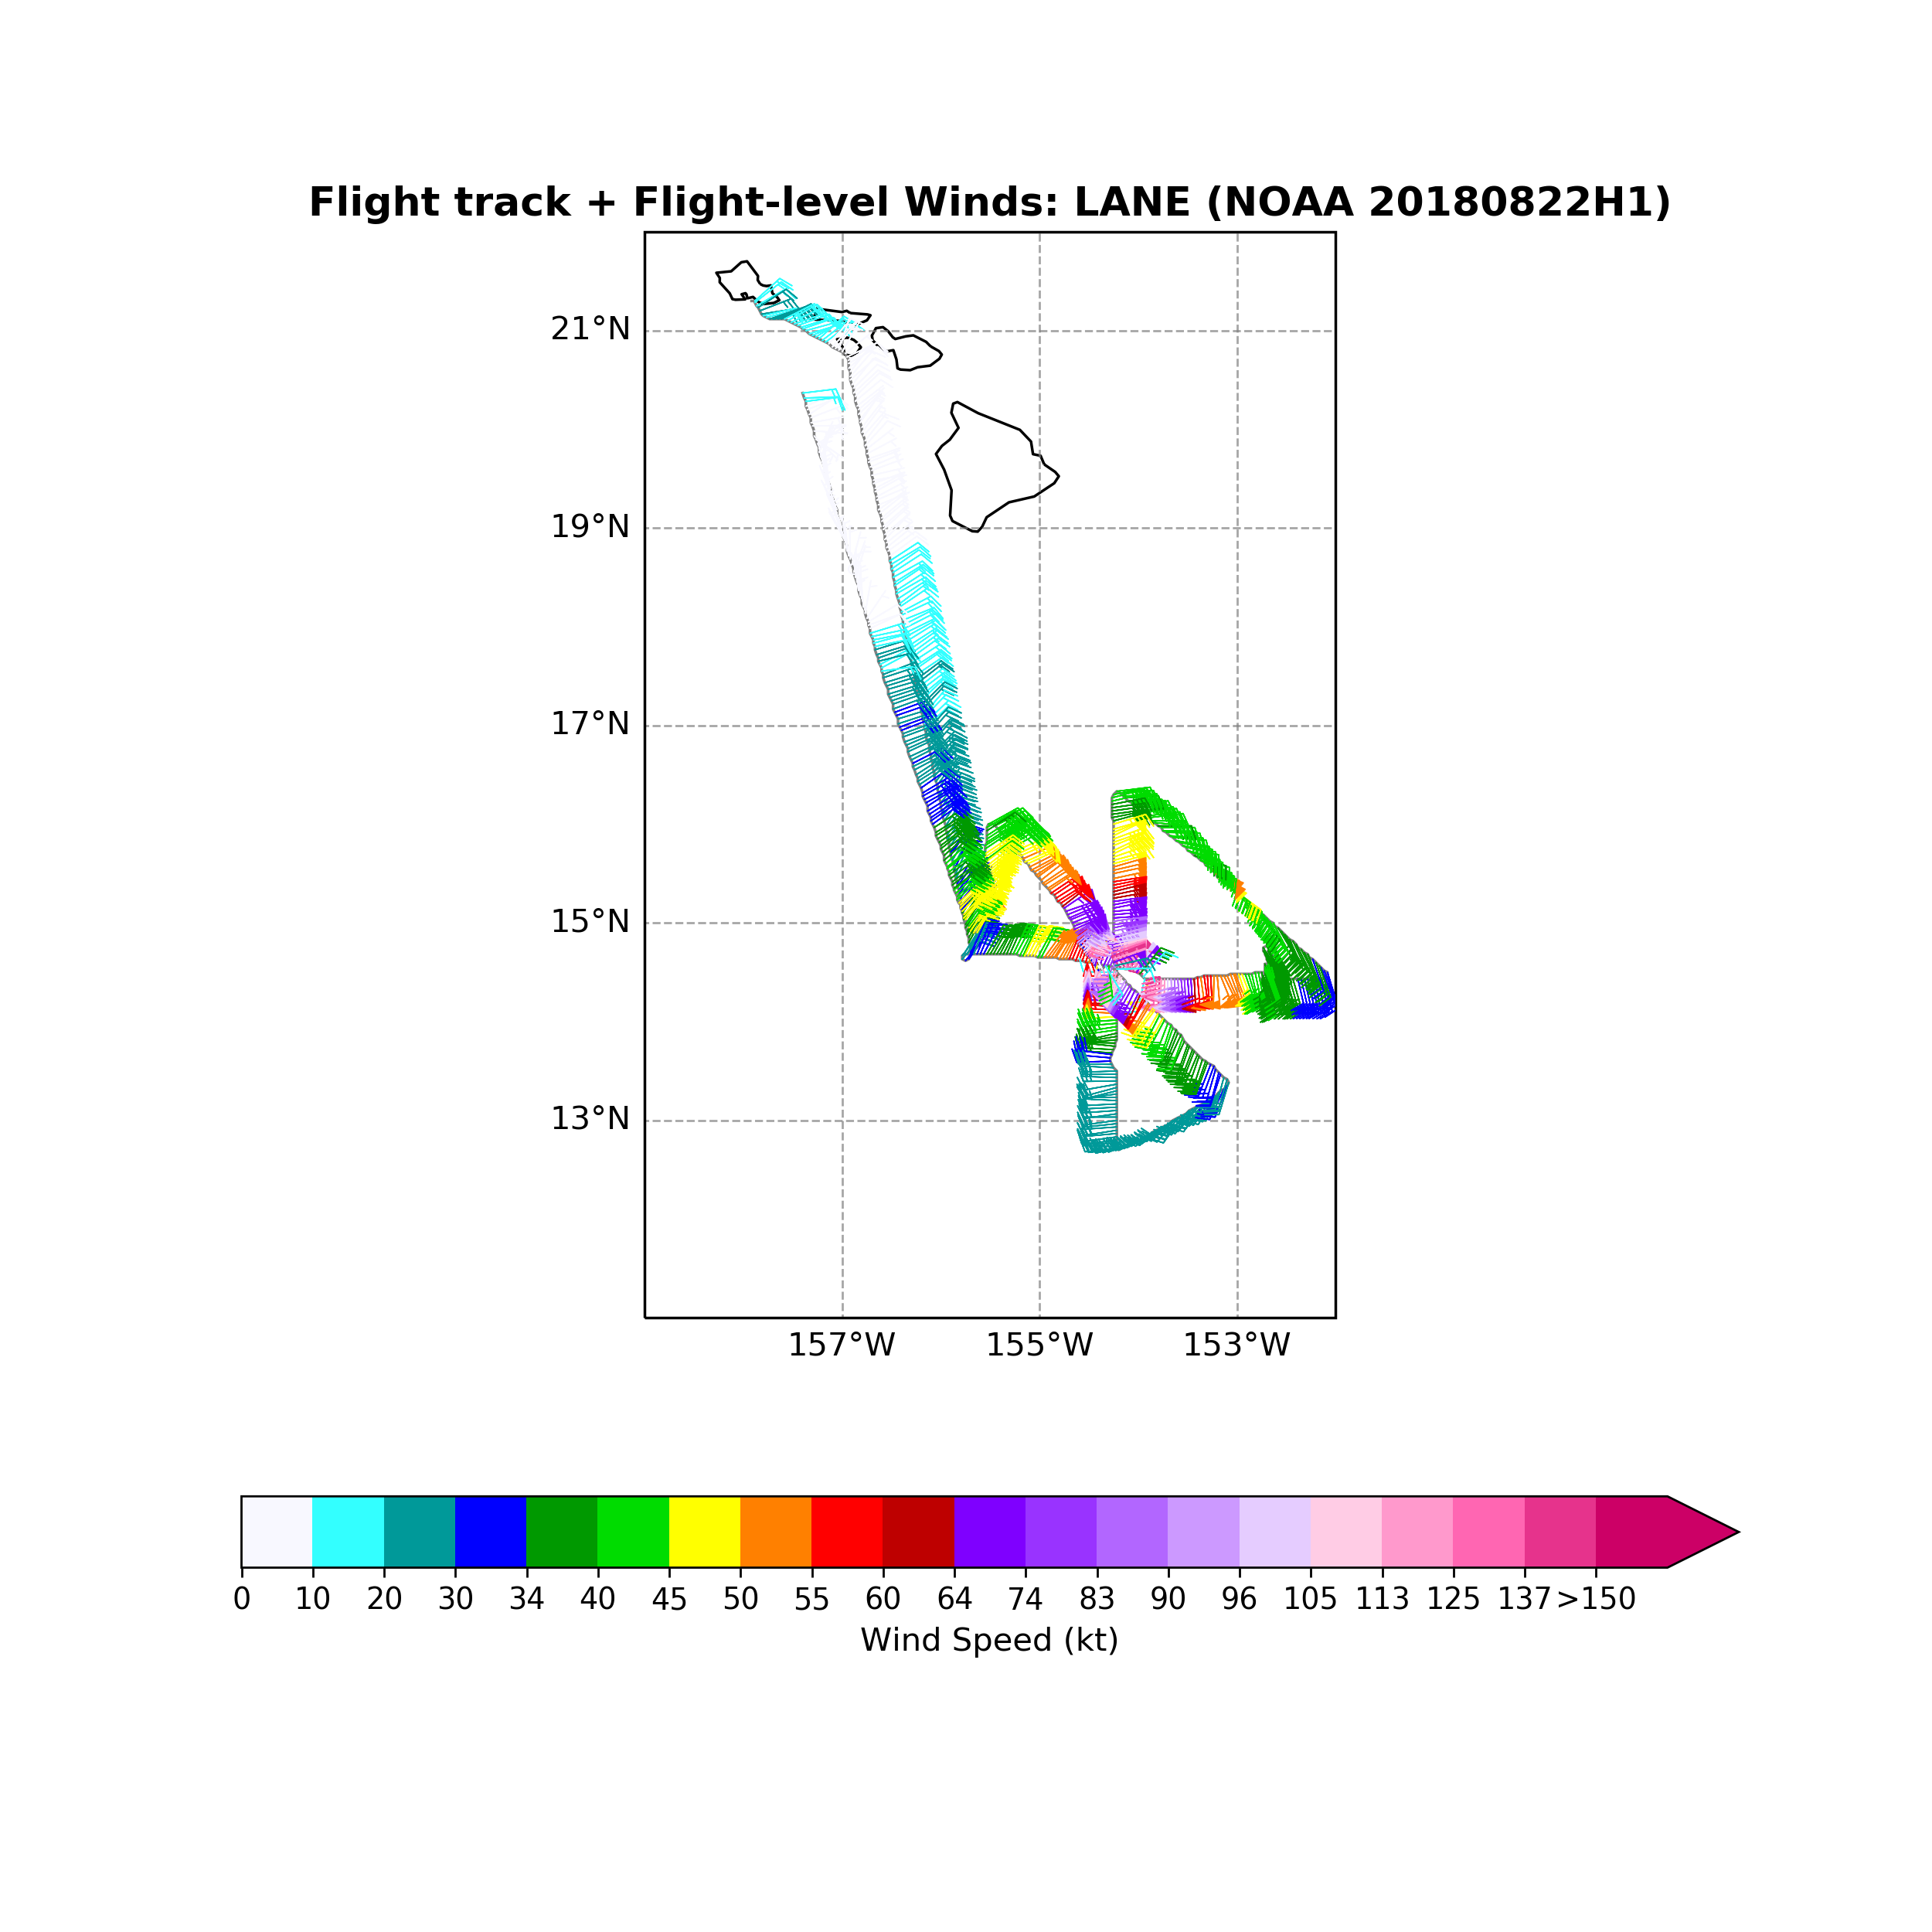
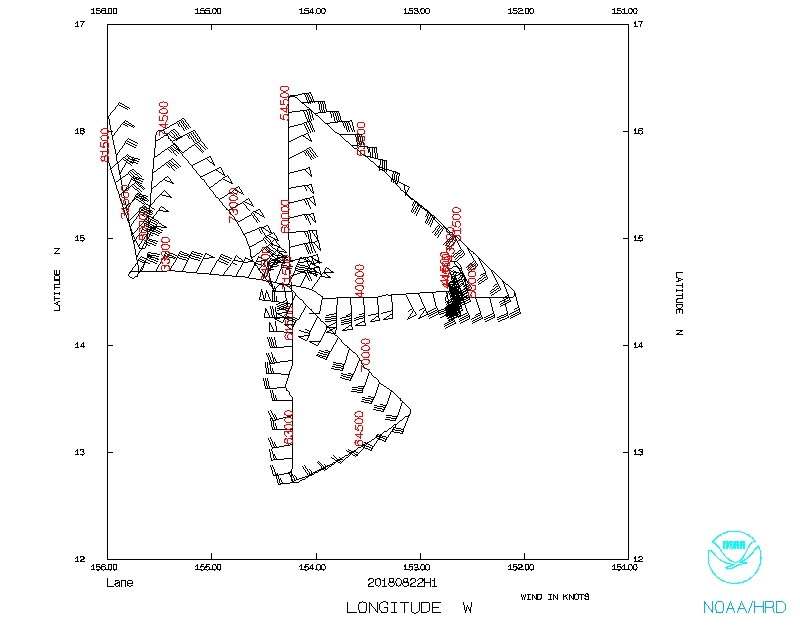
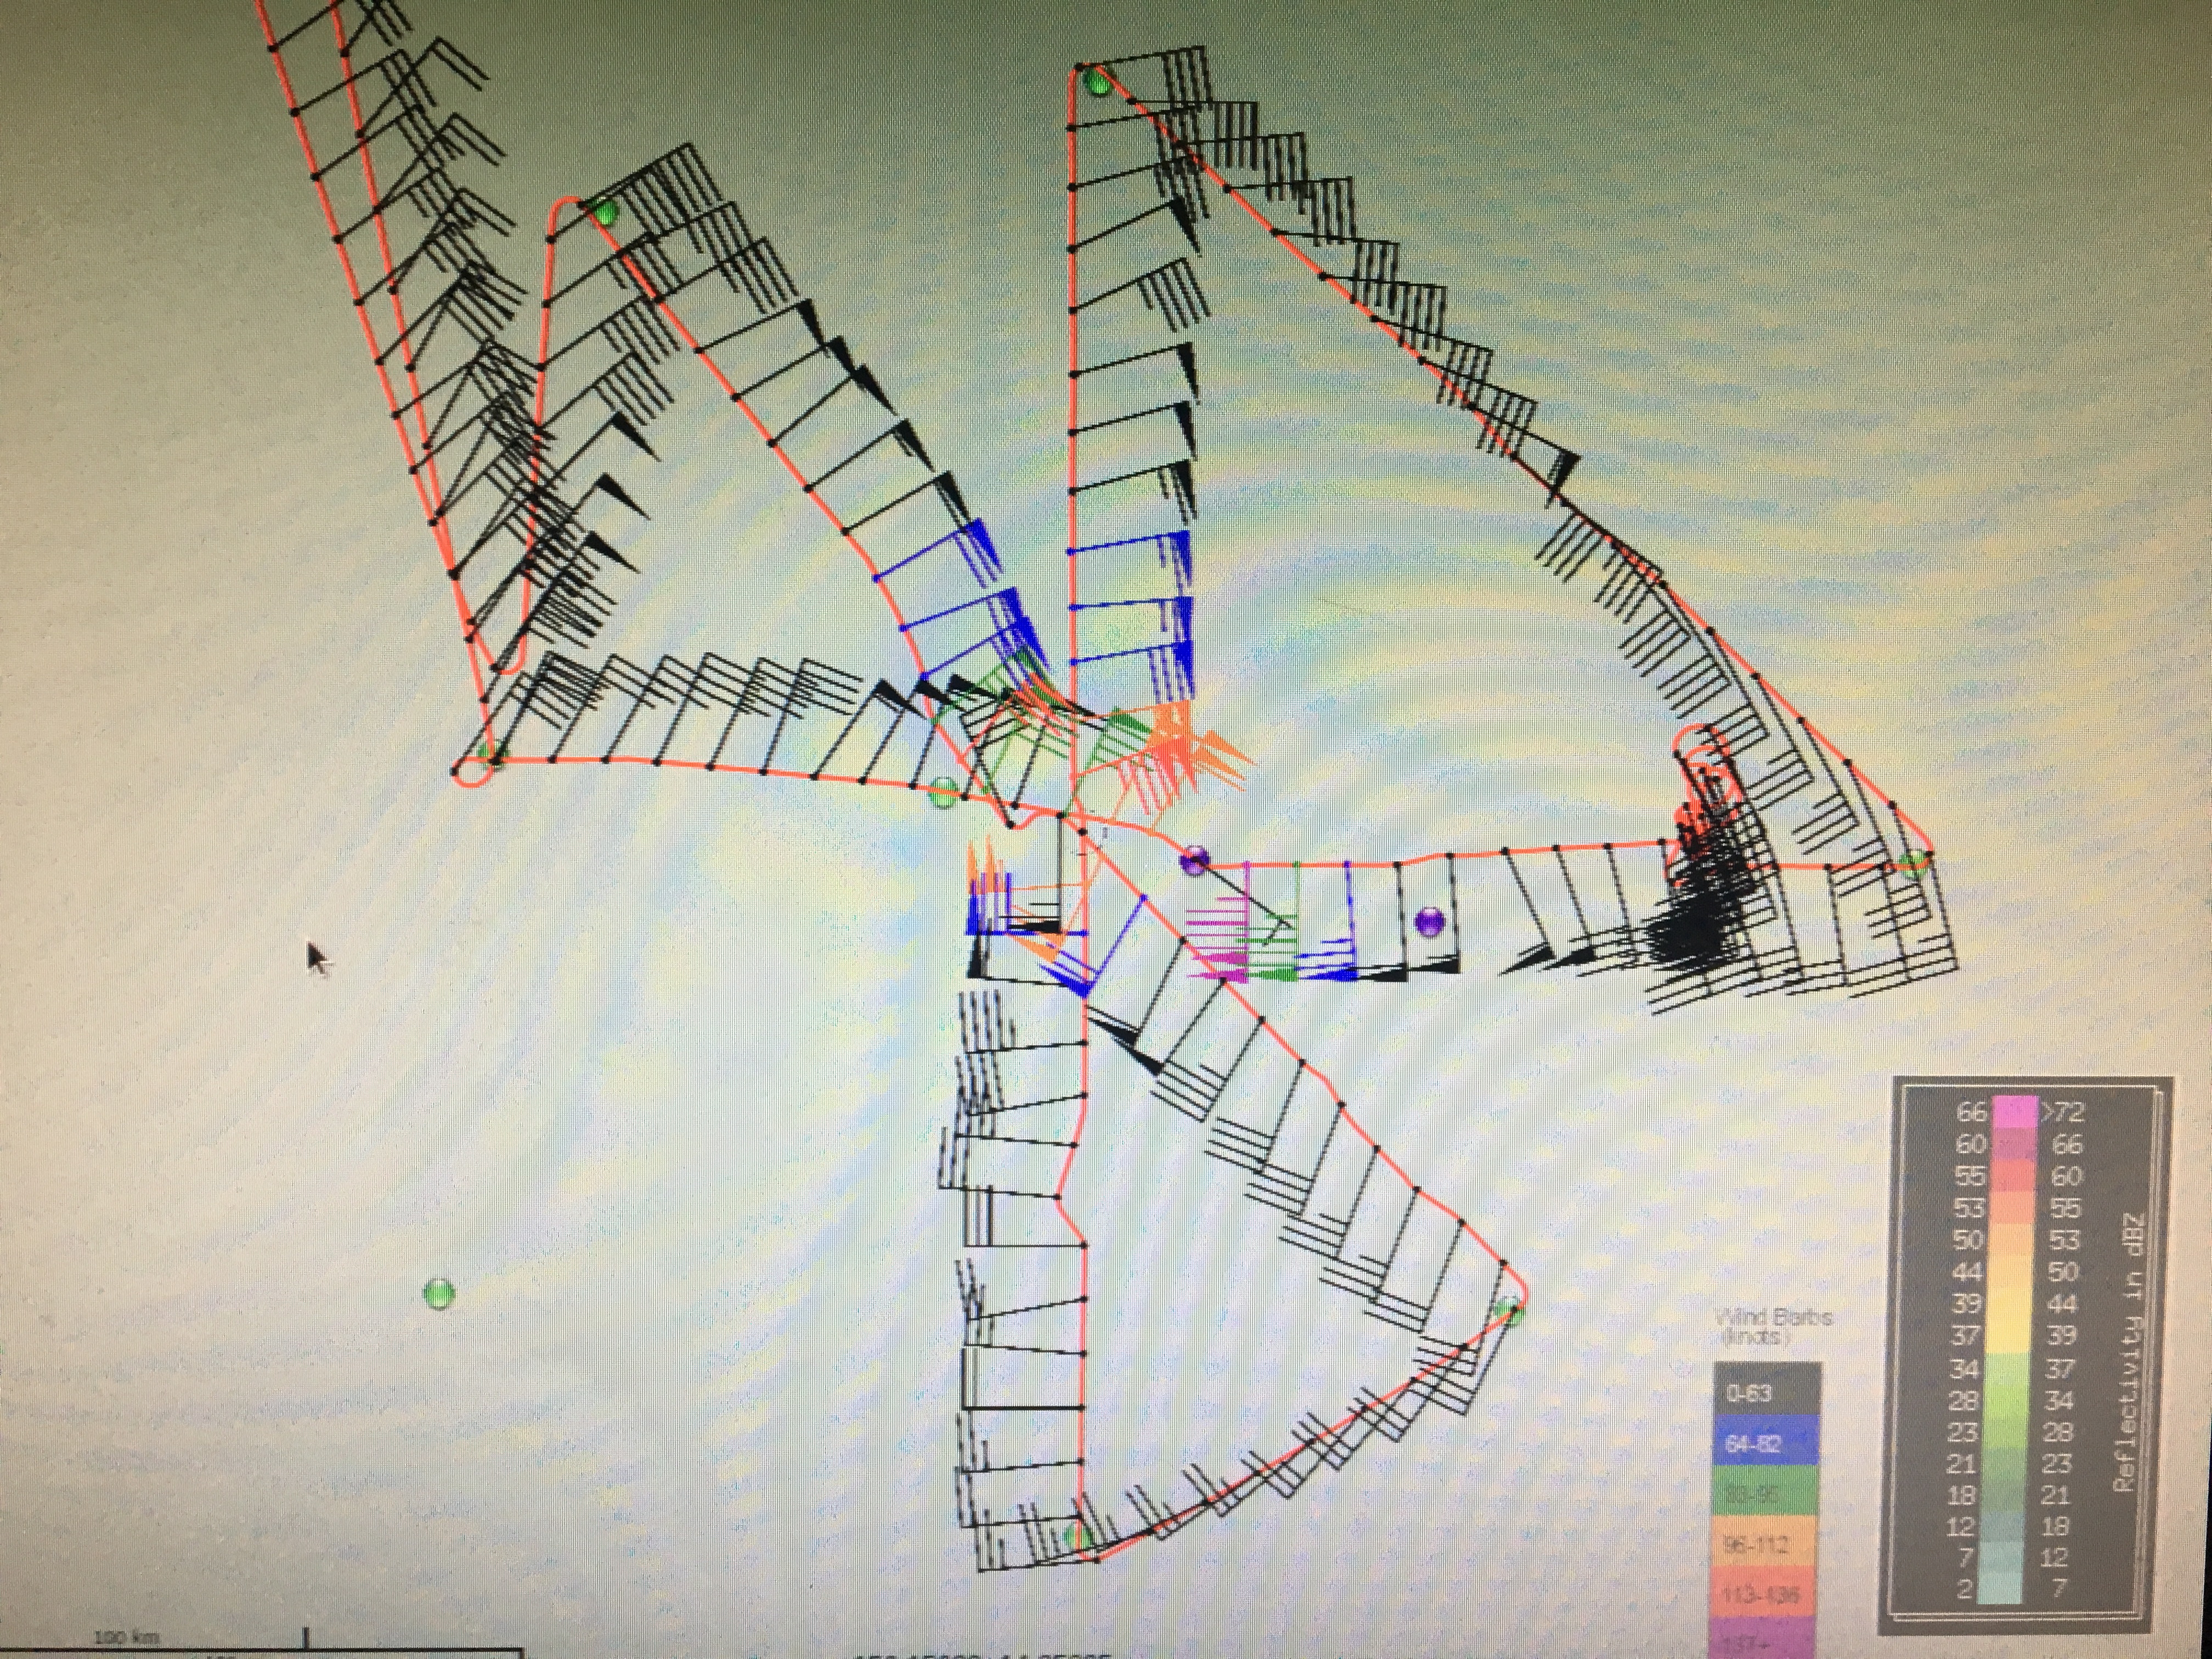 Figure 6: Actual flight track for mission 20180822H1. |
The inspection of the P-3 required after the 20180821H1 mission was successfully completed and we were able to takeoff on-time for this final mission into Lane. We accomplished the first Fig-4 and a third pass through the storm before having to abort the mission halfway through the final downwind leg of the pattern due to vibrations emanating from the rear of the aircraft near the Doppler wind Lidar. Despite aborting the mission before completing the second Fig-4 we were still able to successfully complete three TDR analyses and transmit them to EMC along with collecting DWL and SFMR high-incidence angle (15°, 30°, and 45°) data.
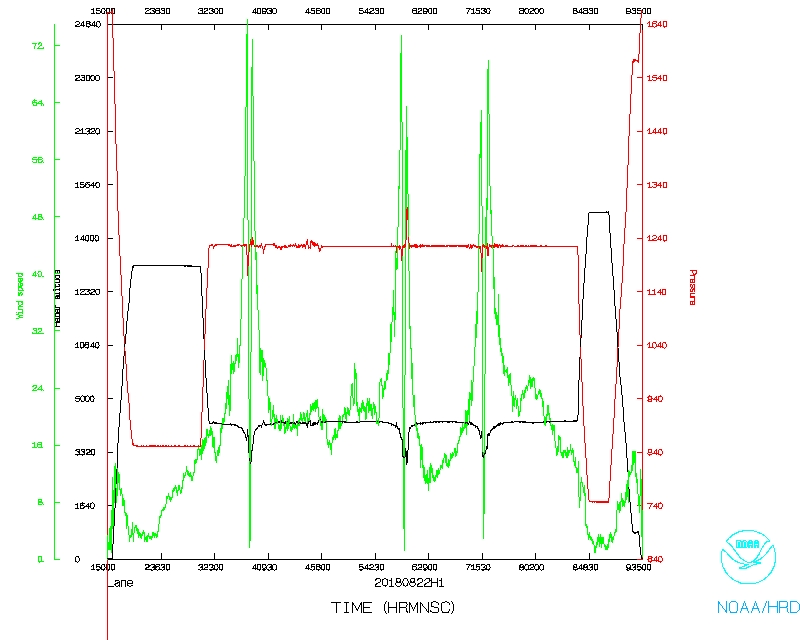
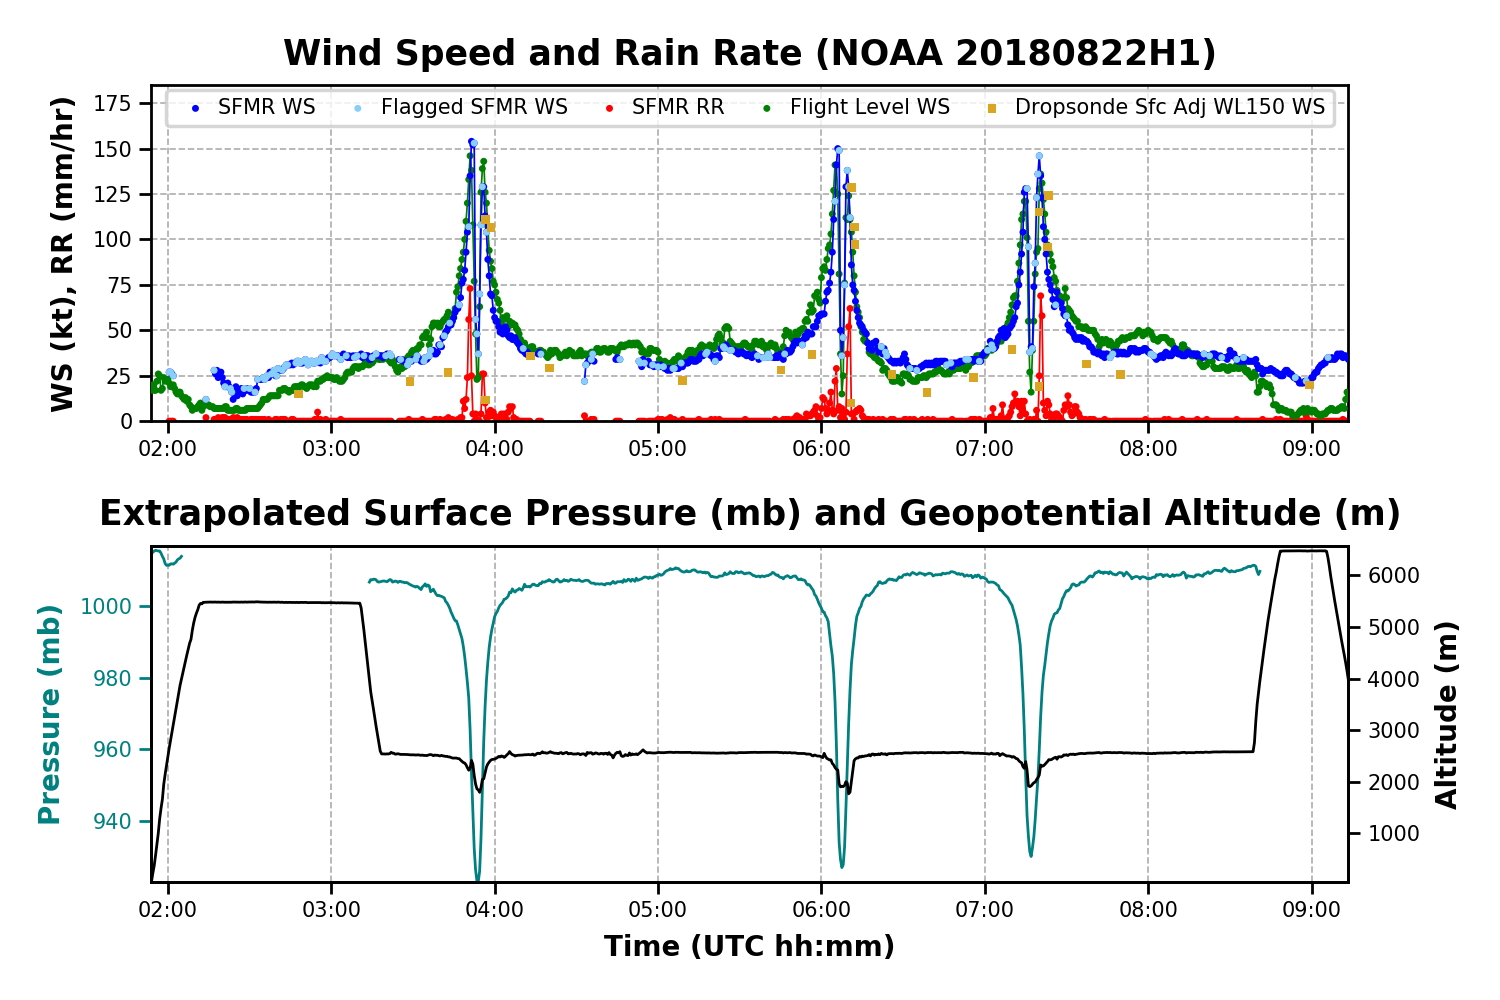 Figure 7: SFMR and flight level data from the HDOBs. |
The actual flight pattern flown is shown in Figure 6. A dropsonde was released on the ferry out to the IP for DWL validation. On outbound of first leg the SFMR high-incidence angle module was flown. The pilots had requested to fly the module on an outbound leg and in daylight and this location had winds that were high enough. After the module we tried to get back on the same outbound track to avoid disrupting the TDR analysis as much as possible for that leg.
After the second pass through the eye in which we encountered strong turbulence, a vibration was noticed to have increased near the DWL. It appeared to emanate from the fairing and be amplified by the DWL rack. The vibration was maximized on the floor between the DWL rack and the lavatory. It also was not very apparent on the port side of the aircraft. It could be felt about 10 feet in front of and behind the DWL rack, decreasing in strength with distance away from the rack. We encountered more strong turbulence after our third pass through the eye and the vibration increased in strength some more. At this point, it became apparent that the vibration would continue to increase each time we encountered strong turbulence. Therefore, on the final downwind leg the pilots decided that it was not safe to perform our final eyewall penetration and the mission was aborted.
We were slightly delayed in climbing to our transit altitude for the return ferry due to the Air Force aircraft's block. However, once we began climbing on the return transit, the vibration near the DWL strengthened even more. A final dropsonde was released on the return transit for additional DWL validation.
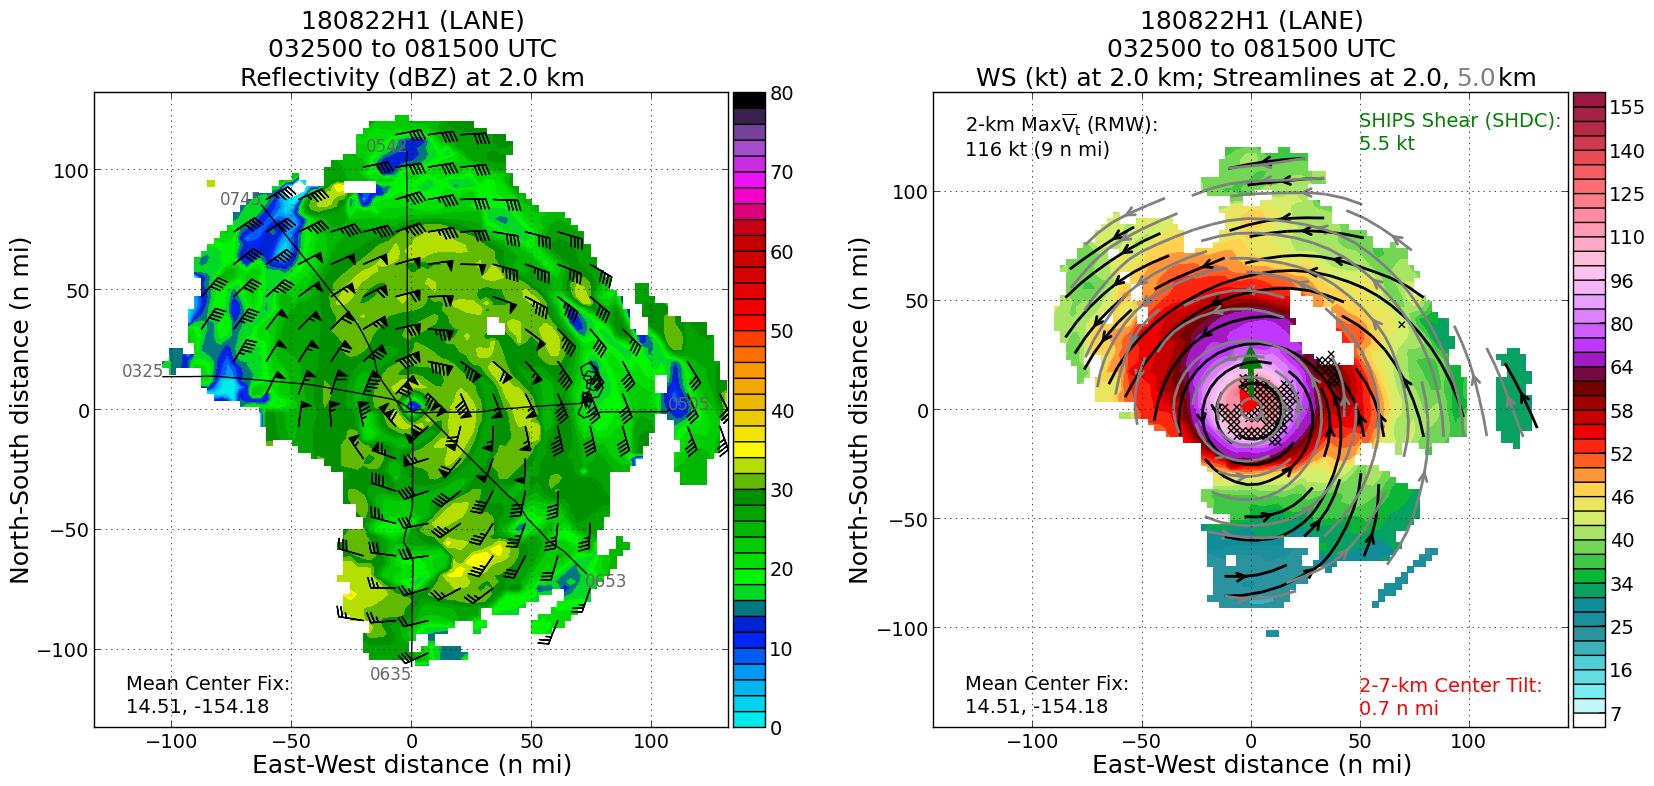
The maximum observed flight level winds were 146 kts and the maximum SFMR winds were 154 kts (Fig. 7), which provided CPHC with the data needed to increase Lane's intensity to category 5. The minimum central pressure observed was 927 mb with a flight level temperature of 31° C and dew point of 8° C in the eye on the first pass through.
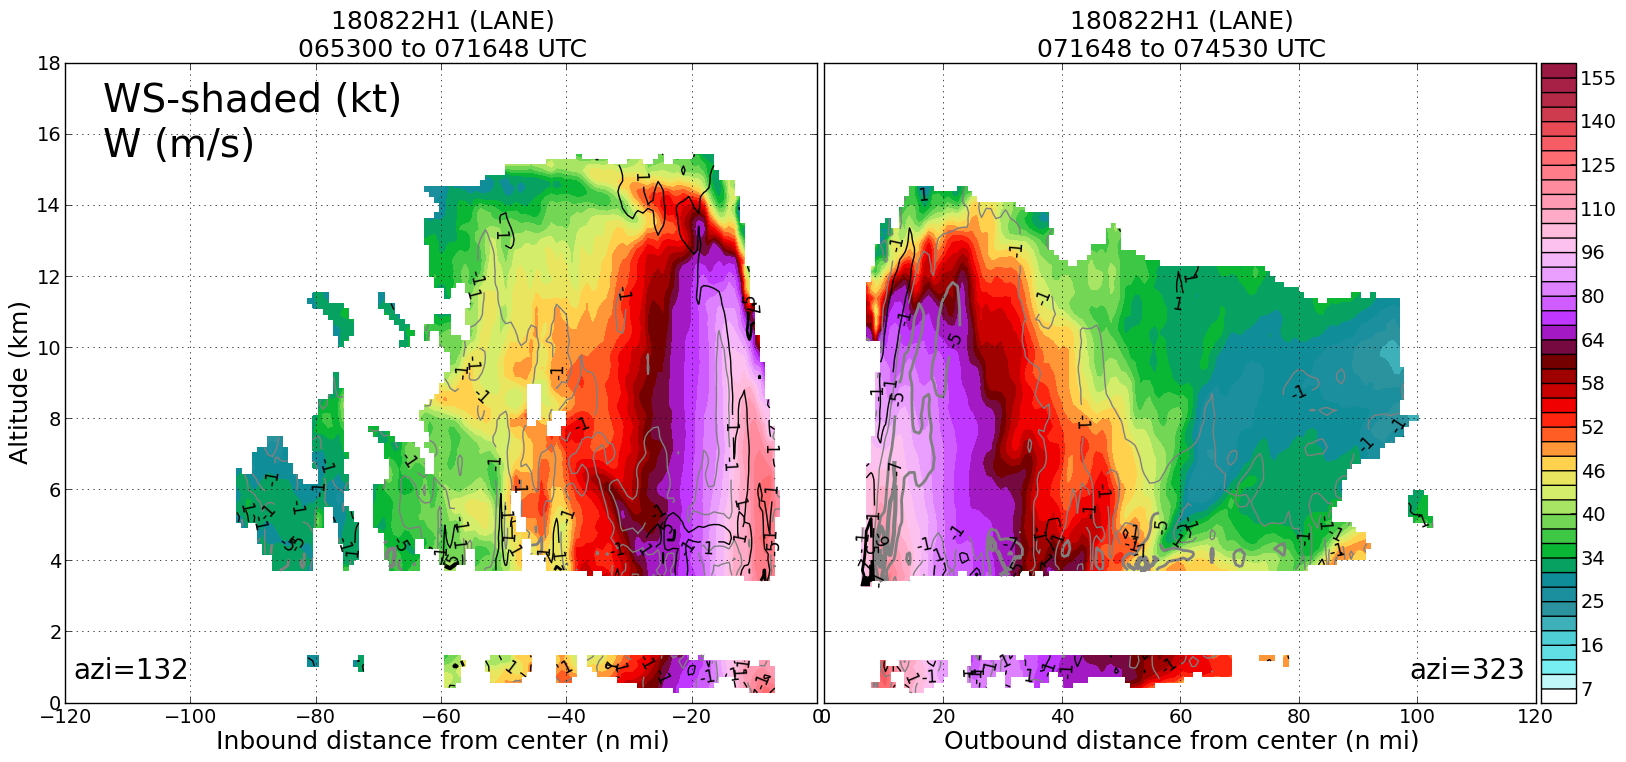
We were able to get TDR coverage of most of the storm despite not completing the final leg (Fig. 8). The TDR depicted a very strong and well-organized hurricane with echo tops nearing 16 km in height (Fig. 9). 27 dropsondes were released and the transit dropsondes depicted dry environmental air present ahead of Lane (Fig. 10). Of the four AXBTs deployed, only two of them recorded data.
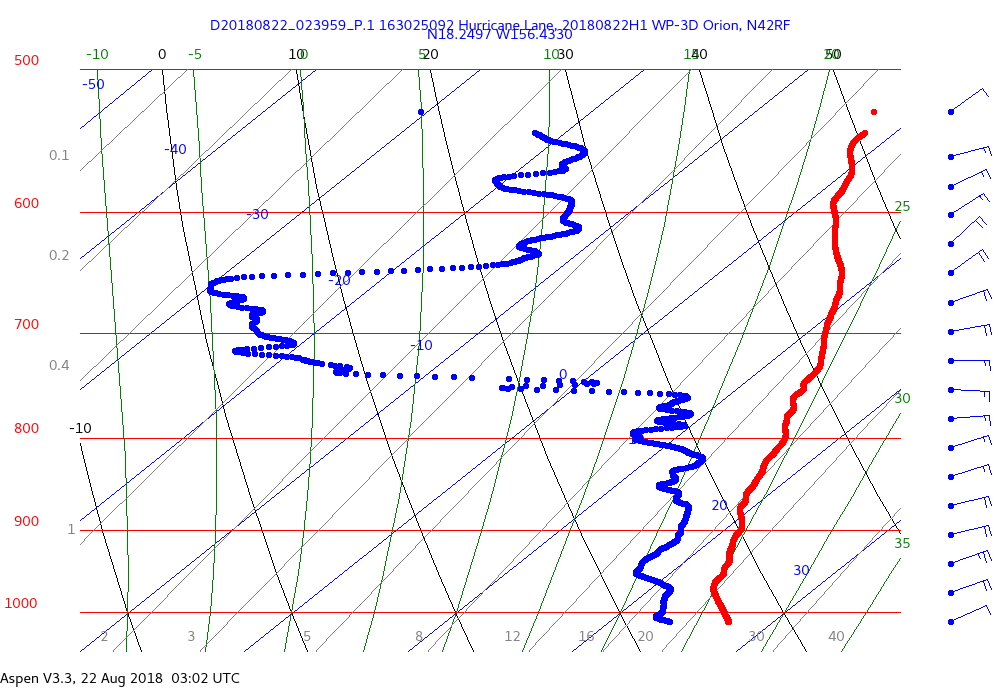 Figure 10: Skew-T plot of temperature (red) and dew point temperature (blue) from dropsonde deployed at 0239Z on August 22, 2018. |
Mission Evaluation/Problems:
Overall, the mission was a success in that we were able to collect and transmit TDR data to EMC and CPHC was able to view the data in AWIPS2. We also collected DWL and SFMR high-incidence angle data. Unfortunately, the WSRA was not operating properly and we were unable to communicate with ProSensing Inc. to try and get it functioning during the flight. The vibration near the DWL also prevented us from fully completing our planned pattern, but we were still able to sample all four quadrants of the storm. Slow data transmission was also encountered on this flight likely due to poor satellite coverage at times.
Heather Holbach
Oct. 5, 2018
Flight track with winds |

Timeseries wind, SFMR wind, rain rate, altitude and pressure plots |
 Flight track |
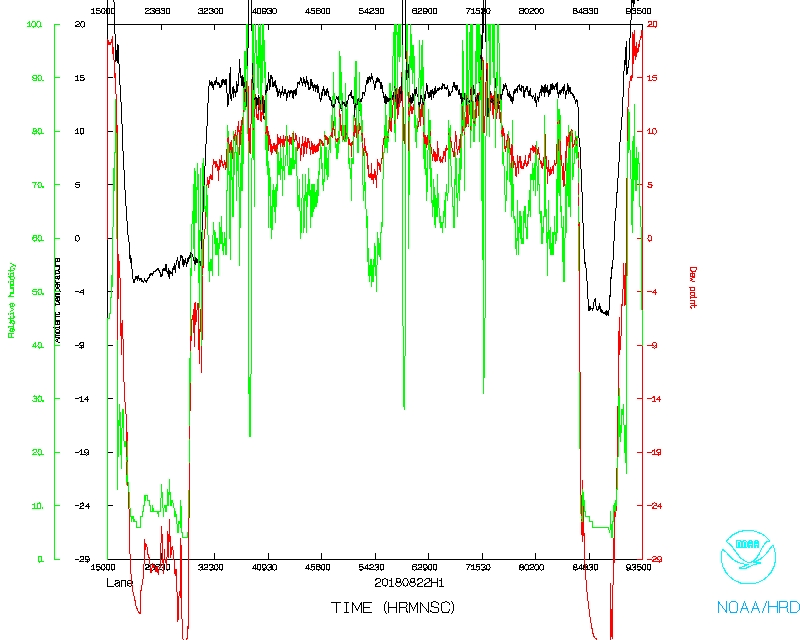 Temperature and Moisture |
 Wind and Atlitude |
 Flight track |
Flight Director's log |
Flight Director's manifest |
SFMR data |
NetCDF data |
serial data |
1 second data
LPS log |
Radar log |
DWL log |
Drop log