Mission Summary
20180820H2 Aircraft 42RF
Hurricane Lane (EP14)
Tail Doppler Radar (TDR)
| Aircraft Commander | Justin Kibby |
| Co-pilot | Robert Mitchell |
| Co-pilot | John Rossi |
| Flight Engineer | Paul Darby |
| Flight Engineer | Chris Lalonde |
| Flight Director | Mike Holmes |
| Navigator | Brian Richards |
| Navigator | Chris Sloan |
| System Engineer | Todd Richards |
| Data Technician | Bobby Peek |
| Dropsonde Operator | Steven Paul |
| Heather Holbach | LPS | HRD |
| Rob Rogers | Radar | HRD |
| Lisa Bucci | Drops/DWL | HRD |
| Taylor Peschacek | Guest | NWS intern |
| Radar | Paul Reasor | HRD |
NOAA 42 will fly a butterfly pattern for an EMC-tasked mission into major Hurricane Lane in the Central Pacific. Additional research goals of this mission are to collect Doppler Wind Lidar (DWL) data and high-incidence angle SFMR data. The flight will be conducted at 8,000 ft pressure altitude, which is the optimal altitude for the Wide-Swath Radar Altimeter (WSRA) and to remain unpressurized for internal AXBT drops.
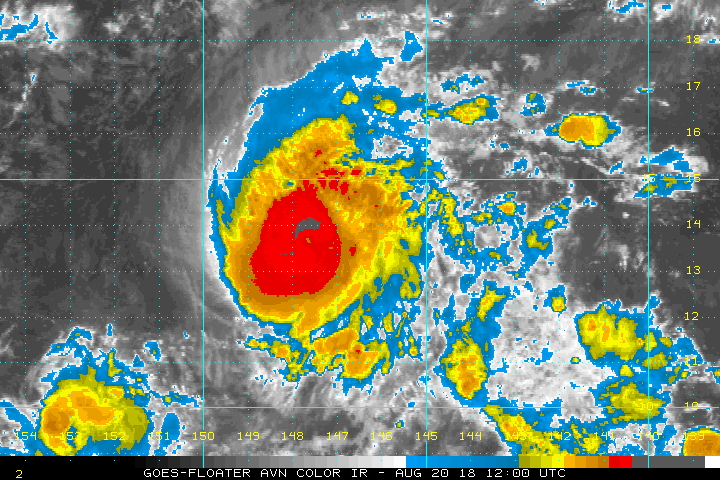
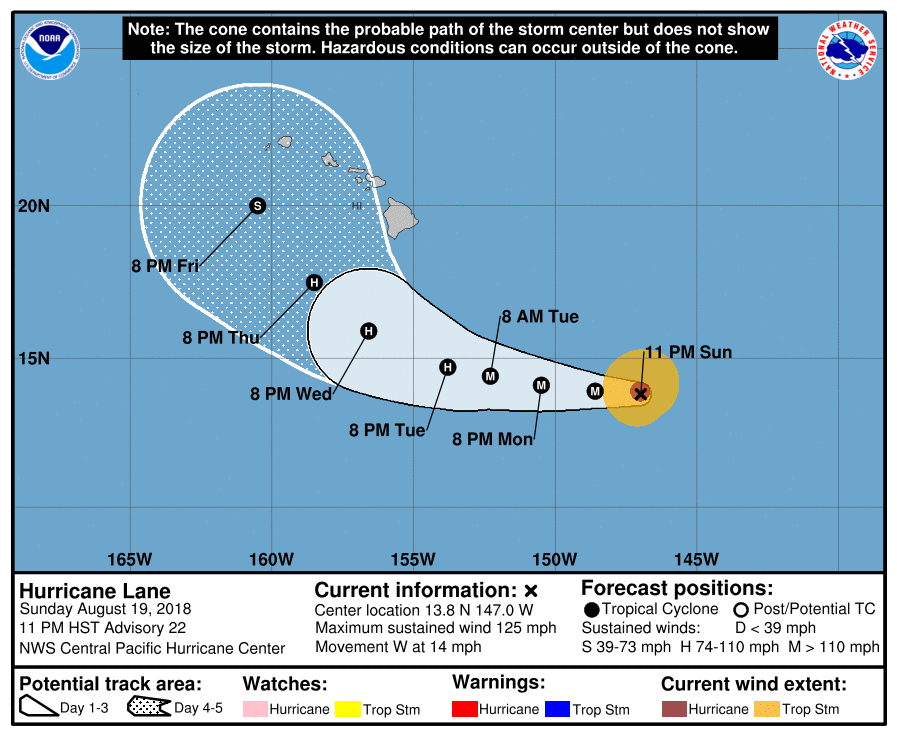
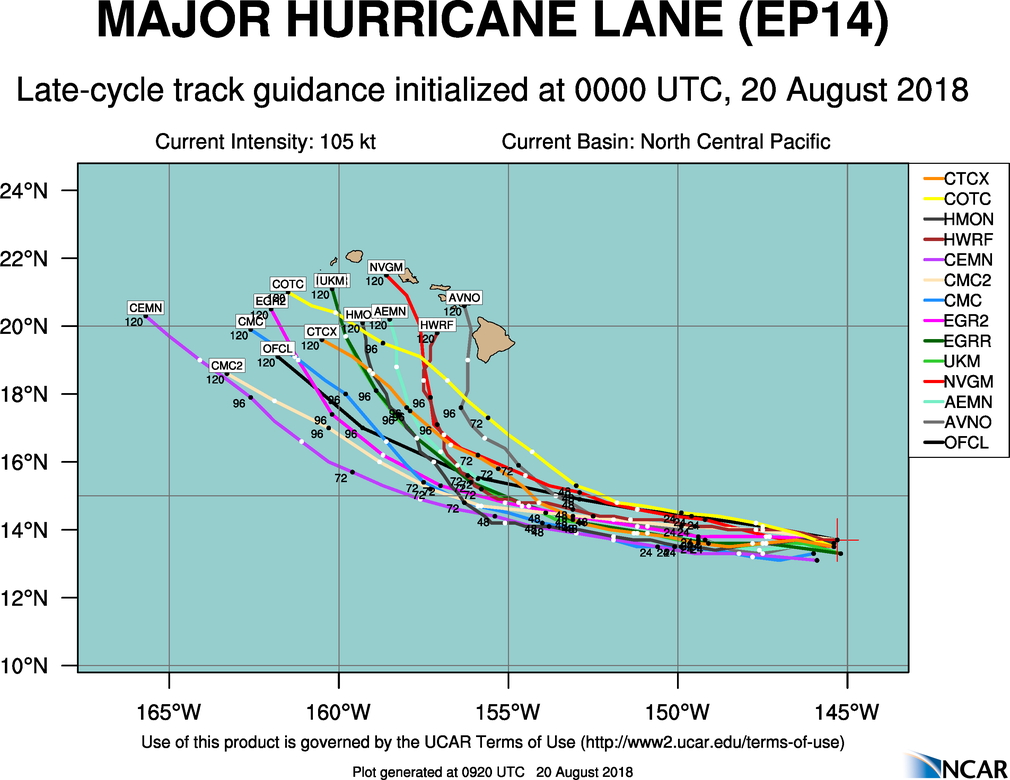
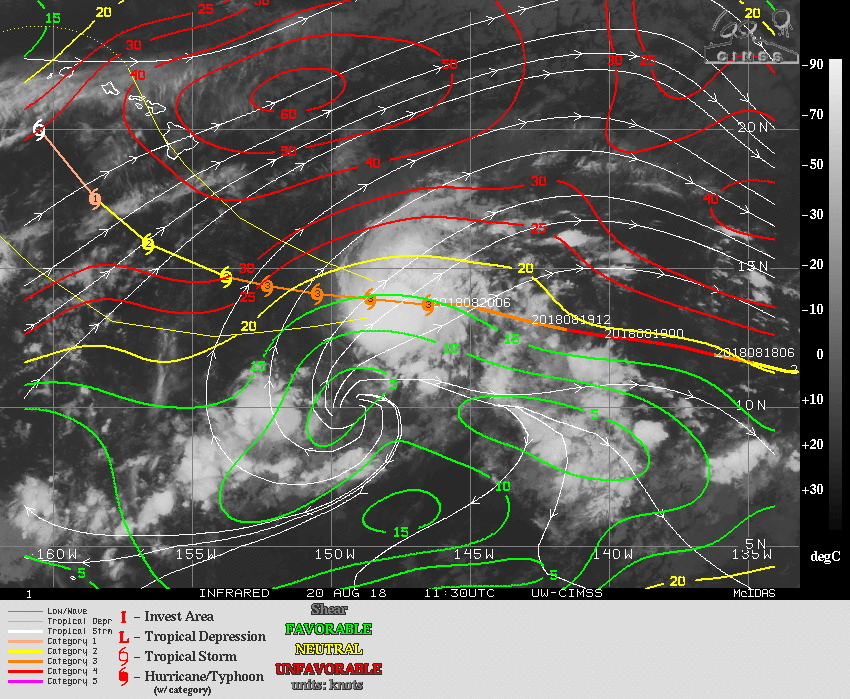
As of 11pm HST (0900 UTC), Lane is a category 3 hurricane with maximum sustained winds of 110 kts, minimum central pressure of 961 mb, and moving west (275°) at 12 kts. In IR imagery, Lane has a large cloud shield, but no clear eye feature (Fig. 1). CPHC forecasts it to maintain its current intensity for the next 24-36 hours and then slowly weaken (Fig. 2). There is a lot of spread in the model guidance for the 3-5 day forecast with Hawai'i still under threat (Fig. 3). The main source of uncertainty in the track forecast is the erosion of the western side of the ridge to the north of Hawai'i. There is also strong vertical wind shear over Hawai'i that will likely cause Lane to weaken as it approaches the islands (Fig. 4).
The planned flight track is a butterfly pattern with 105 nm legs (Fig. 5). An AXBT will be deployed out ahead of the storm at the 24-hour forecast position. Dropsondes are planned at the endpoints and midpoints with combo max wind drops if the surface winds are >= 100 kts. With the possibility of additional missions, if there is a max wind drop there will be no midpoint drop in order to conserve sondes. If the high-incidence SFMR module is flown, there will be a combo drop at the beginning of the circles. Planned 12 sondes and 5 AXBTs.
|
Prepared by the Hurricane Research Division August 19, 2018 2:35:19 PM Aircraft: N42RF Proposed takeoff: 20/1400Z
DROP LOCATION TABLE
| #
| LAT
| LON
| RAD/AZM
| Time
|
| deg min
| deg min
| (nm/dg)
| hr:min
| 1 | 14 06 | 151 24 | 1:46
| 2S | 13 42 | 149 42 | 105/270 | 2:13
| 3S | 13 42 | 146 06 | 105/090 | 3:08
| 4S | 15 13 | 147 00 | 105/030 | 3:37
| 5S | 12 11 | 148 47 | 105/210 | 4:32
| 6S | 12 11 | 147 01 | 105/150 | 5:00
| 7S | 15 13 | 148 48 | 105/330 | 5:55
| | |||||||||||||||
Mission Summary :
| Take off | Landing
| Honolulu, HI
| 14:24 UTC
| Honolulu, HI
| 22:35 UTC
| Penetrations
| 3
| | ||||
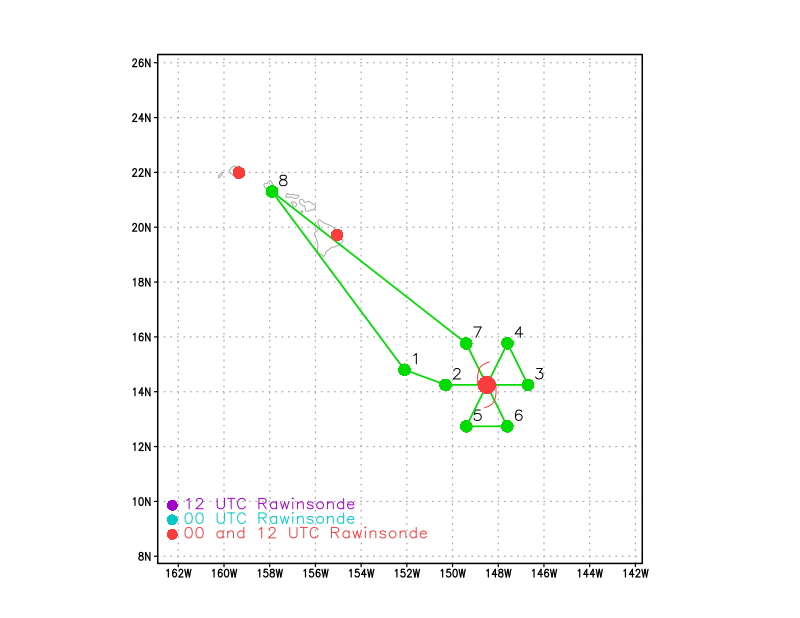 Figure 5: Proposed flight track for mission 20180820H2. |
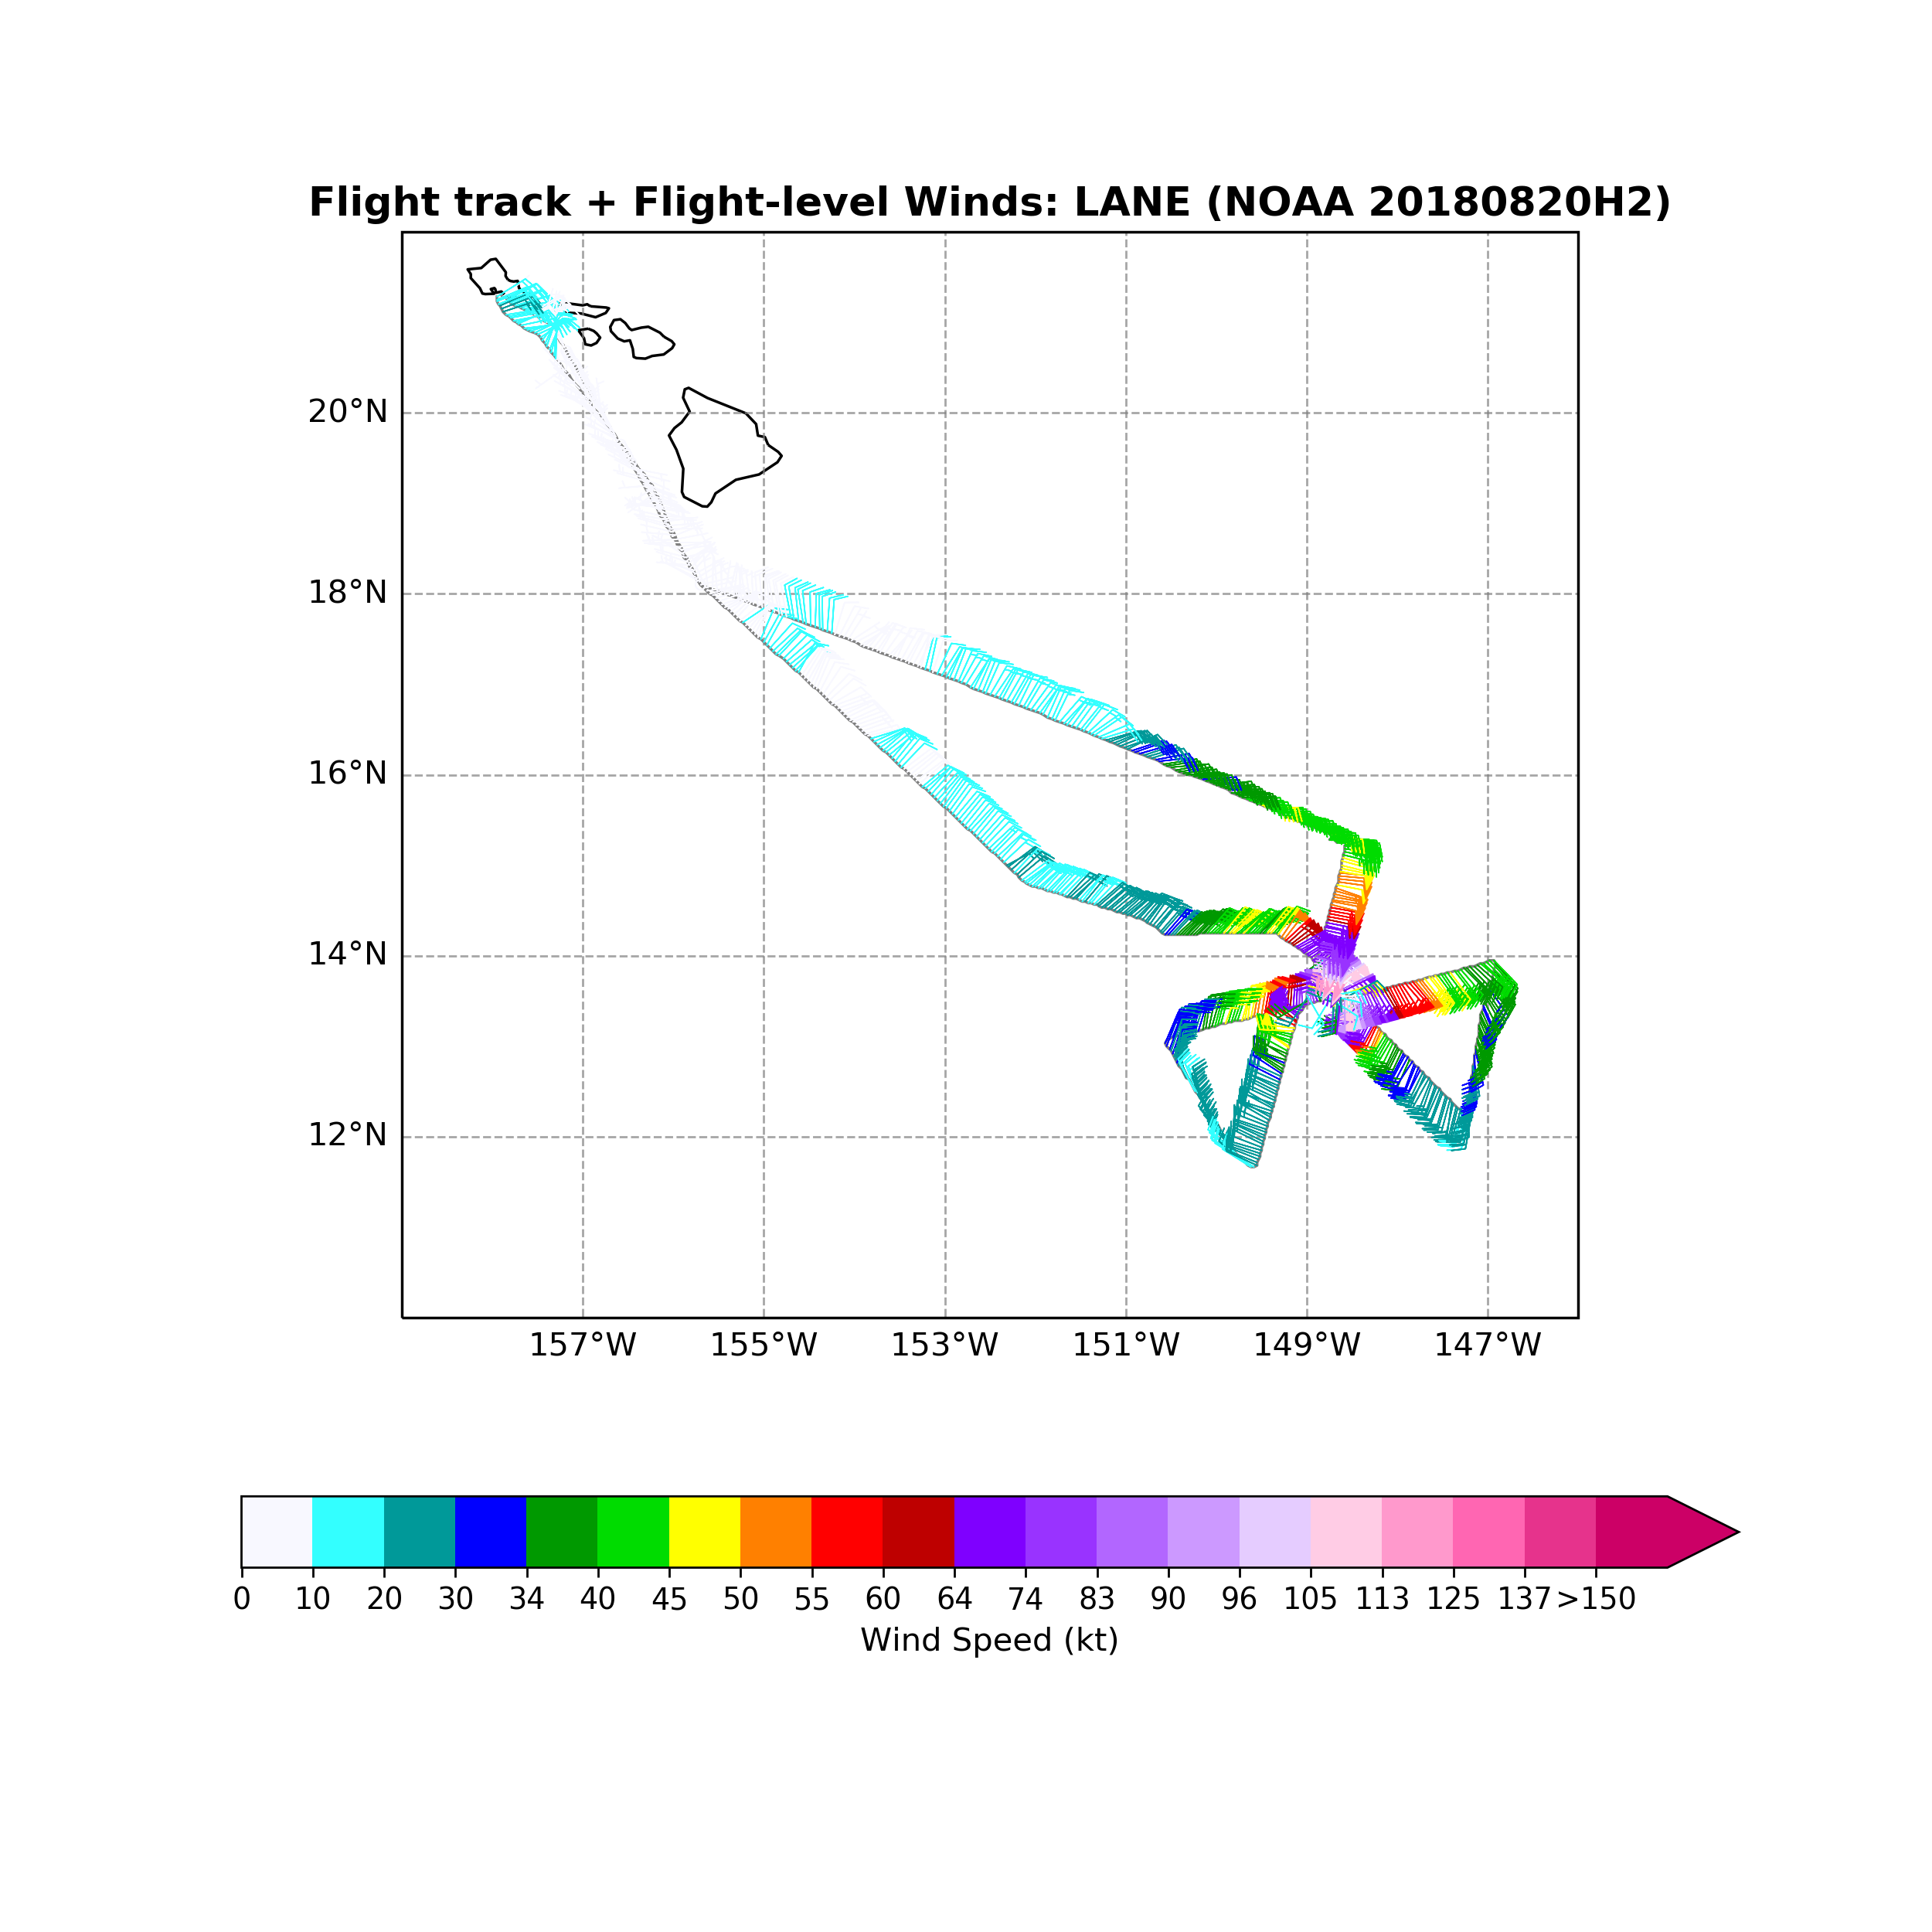
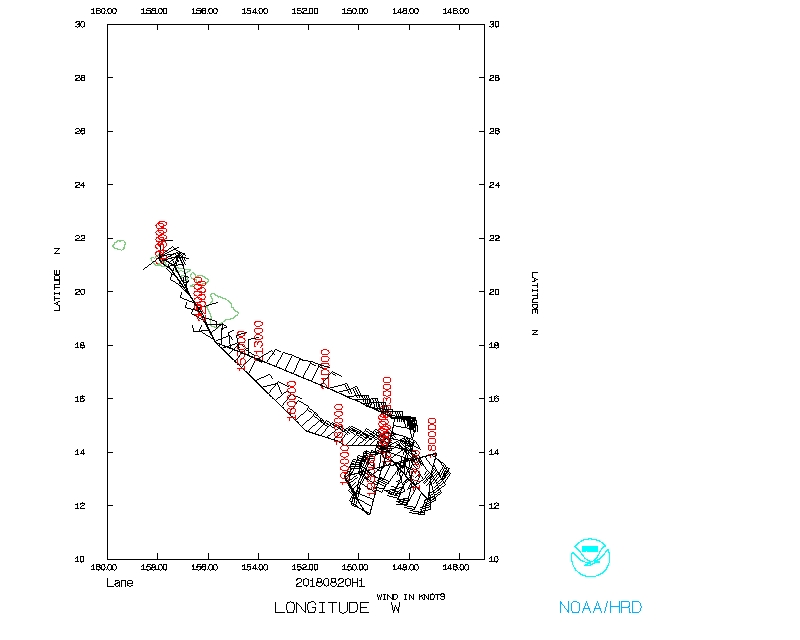
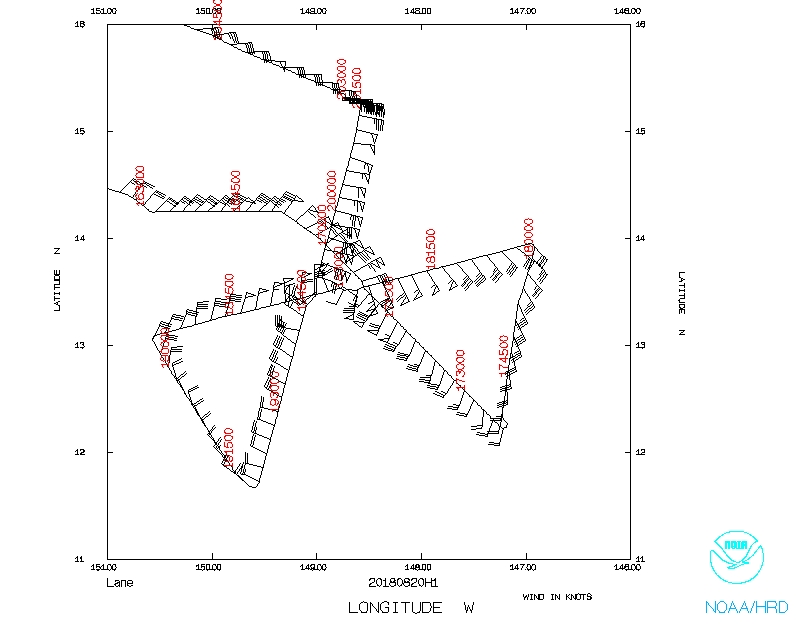
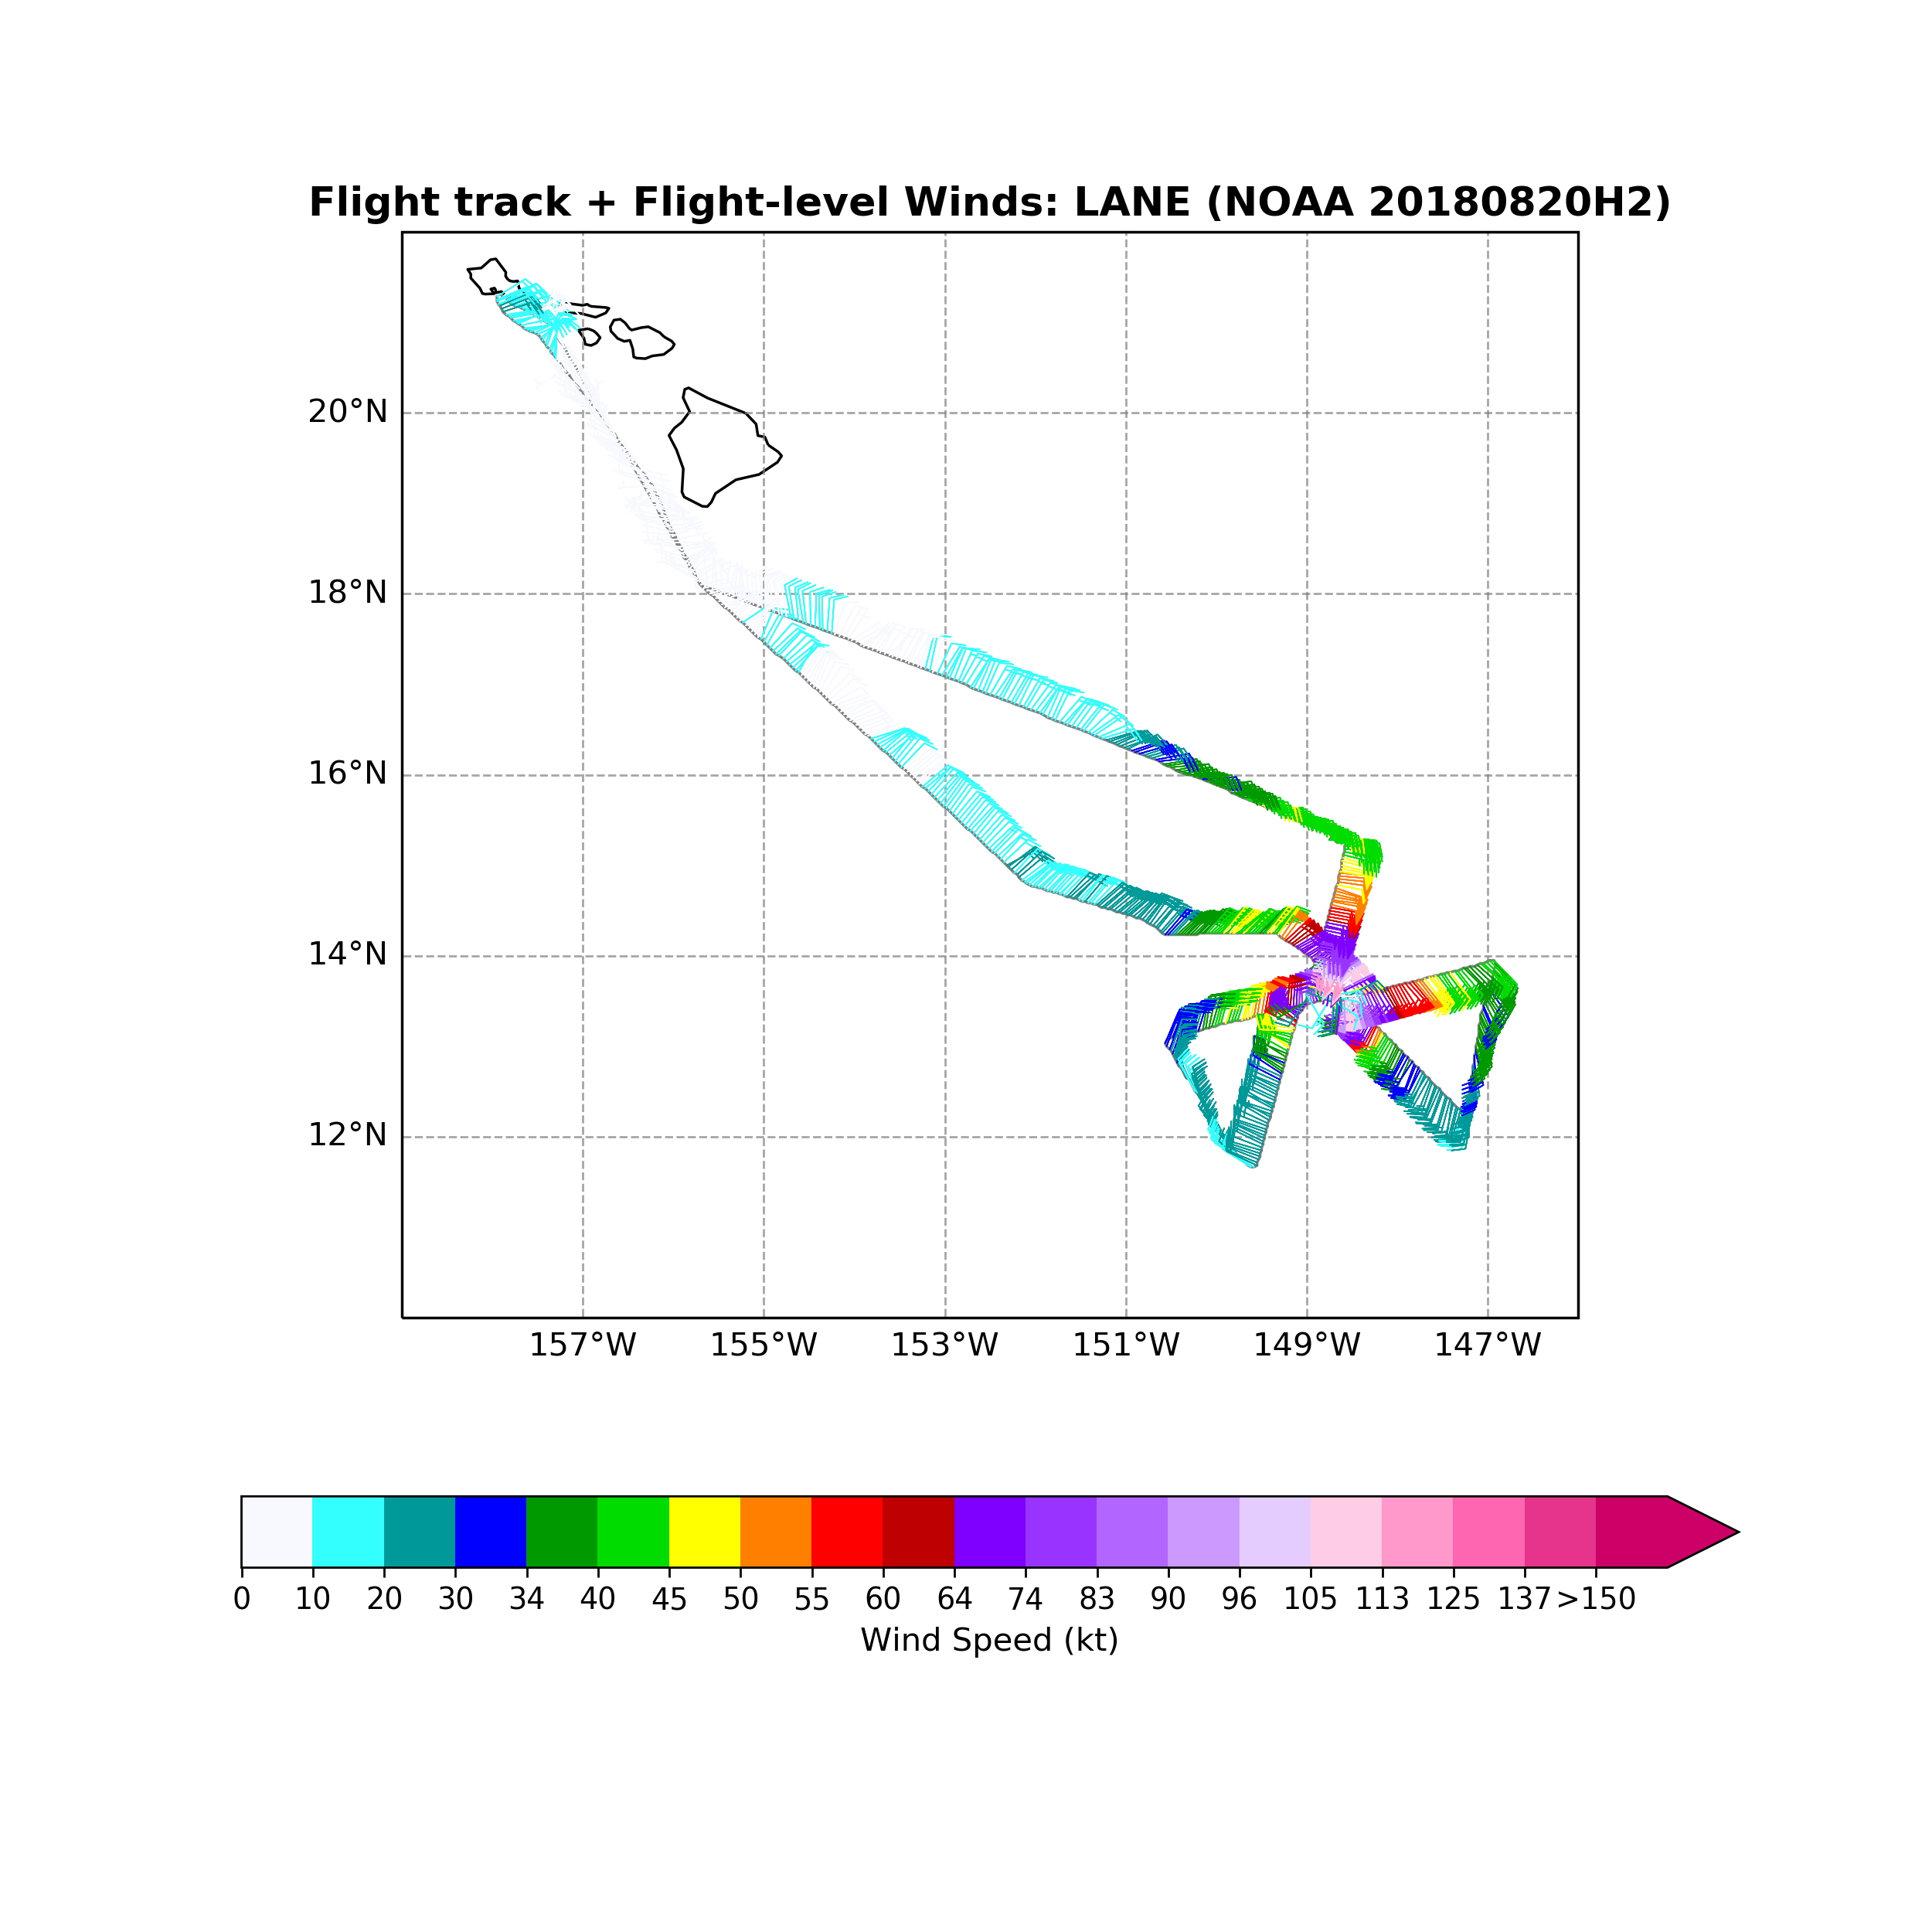 Figure 6: Actual flight track for 20180820H2. |
Takeoff was slightly delayed because of issues with the flight plan submission. However, we were still able to successfully complete the butterfly pattern and high-incidence angle SFMR module. Three TDR analyses were completed and transmitted. We also successfully tested the real-time transmission of Doppler Wind Lidar data.
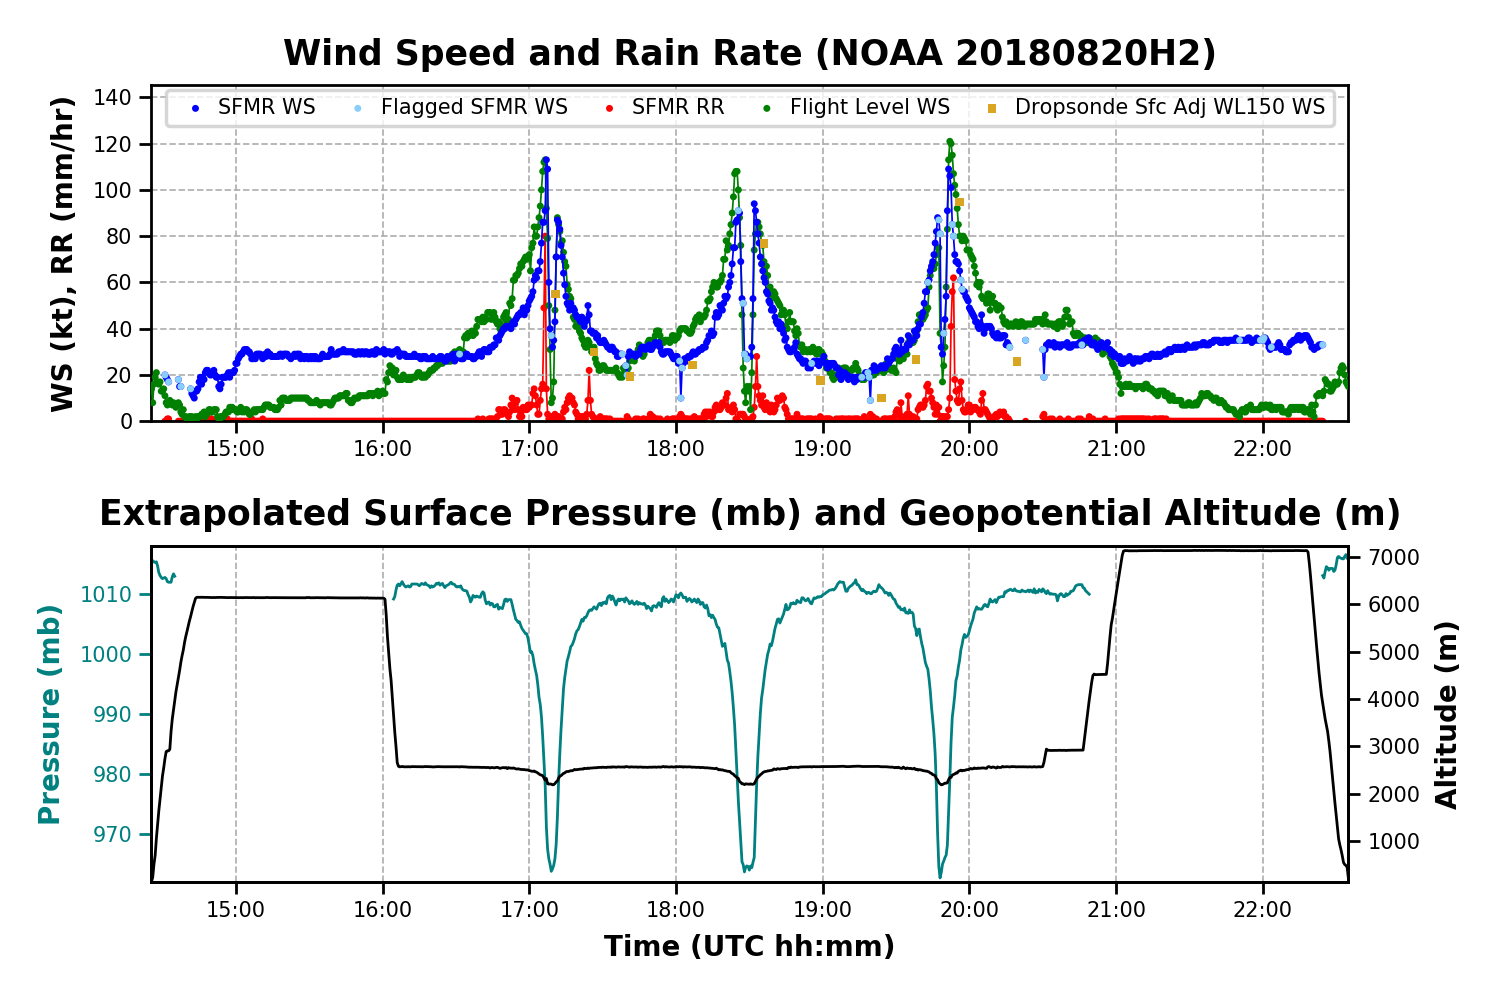
The actual flight pattern is shown in Figure 6. About halfway between the IP and the eye, it became evident that the eye of Lane was further south than anticipated, so the flight track was adjusted to align with the center and the remainder of the butterfly was rotated slightly to maintain the 60° azimuthal spacing. Maximum SFMR winds found were 113 kts with max flight level winds of 121 kts and minimum central pressure of 964 mb (Fig. 7). TDR analyses (Fig. 8, 9, and 10) depict a vertically stacked circulation with very deep convection near the core of the system and enhanced outflow near 15 km on the west and northwest sides of the storm. The sequence of TDR analyses suggested that the system was likely encountering relaxed shear compared to the previous flight and thus becoming better organized.
 Figure 7: SFMR and flight level data from the HDOBs. |
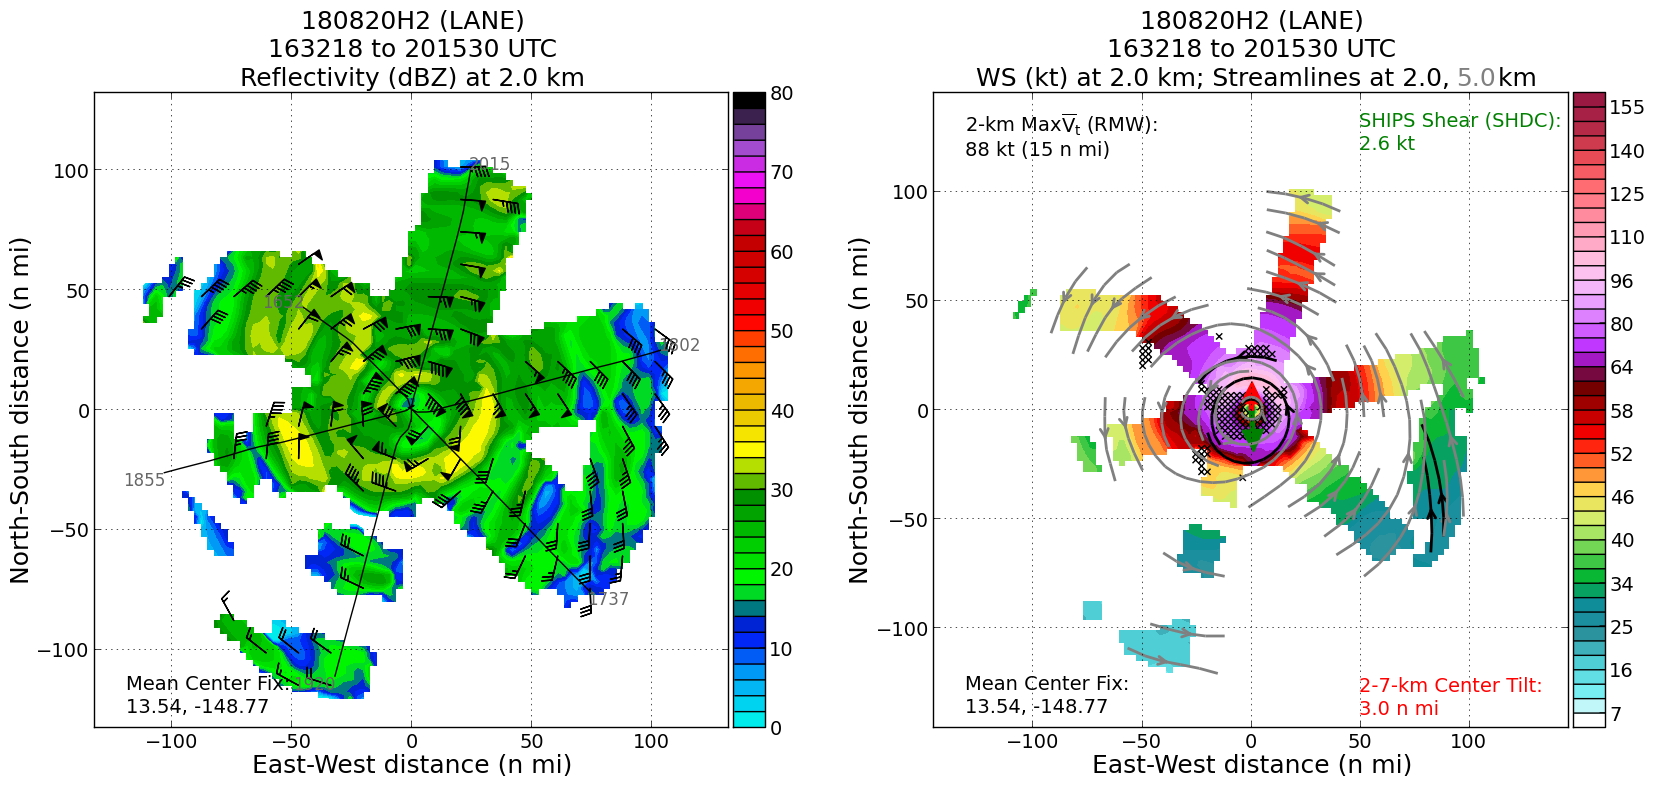 Figure 8: TDR planview analysis of reflectivity (left) and wind speed (right) at 2.0 km. Streamlines at 2.0 and 5.0 km are also shown on the wind speed graphic. |
The multi-mode radar (MMR), our new lower fuselage radar, presented a very detailed look at the eyewall. Figure 11 shows the evolution of the eyewall from 1708Z to 1822Z in which what looks to be a mesovortex formed in the eyewall and then separated from the main convection and dissipated. The MMR also displayed a partially open eyewall on the S and SE sides.
There were three other aircraft sampling Lane while we were out there, the Air Force C-130 was tasked with the 18Z fix, NOAA49 was sampling the environment around Lane with a 1730Z takeoff, and the NASA DC-8 was performing a high-altitude mission above Lane to sample the microphysics.
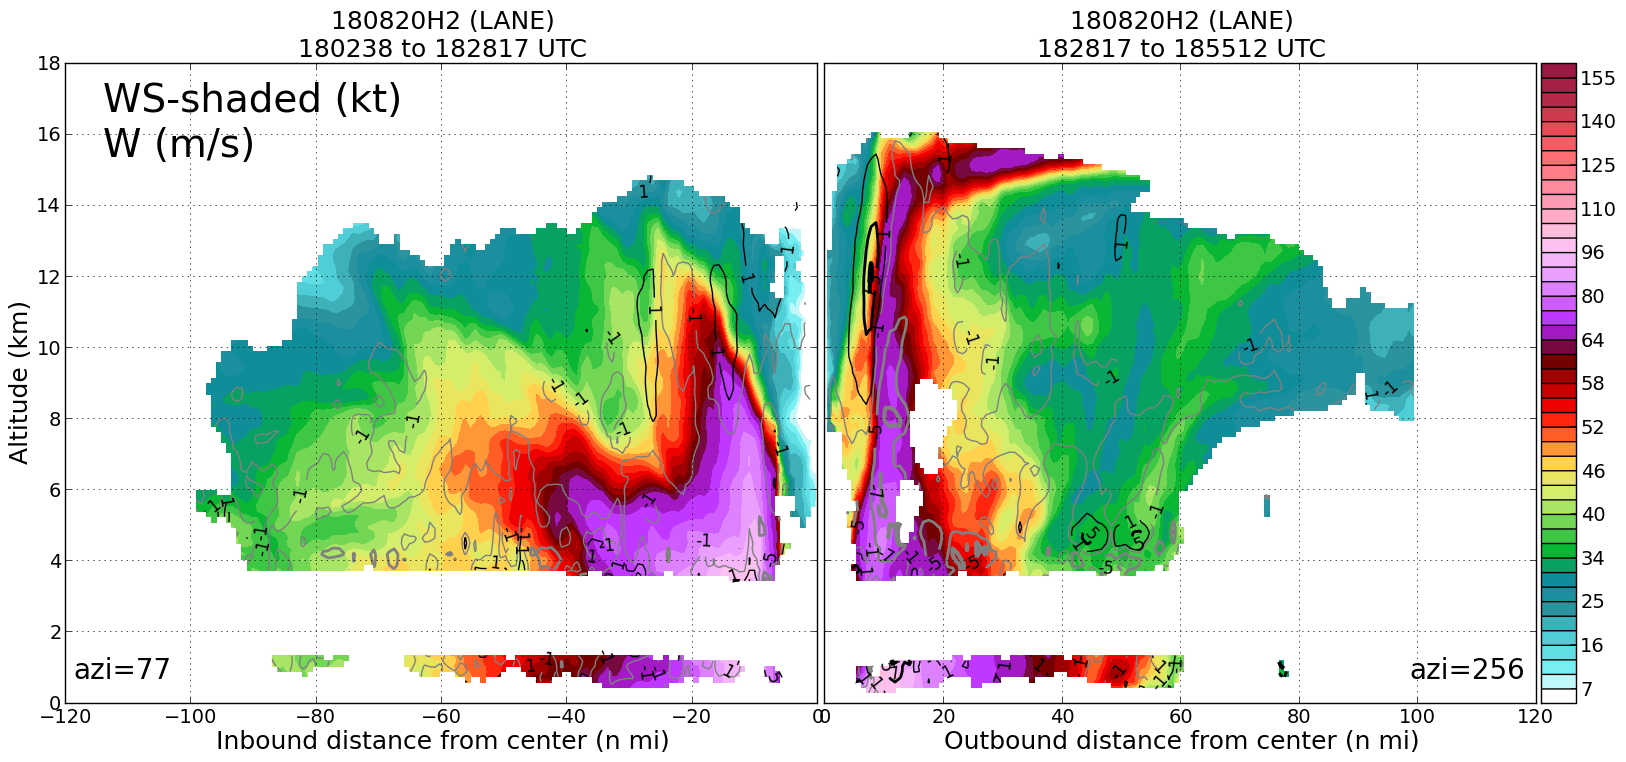 Figure 9: TDR vertical profiles for pass 2 (ENE to WSW) centered at 1828Z displaying the wind speed (shaded, kt) and vertical wind speed (contoured, m s-1). |
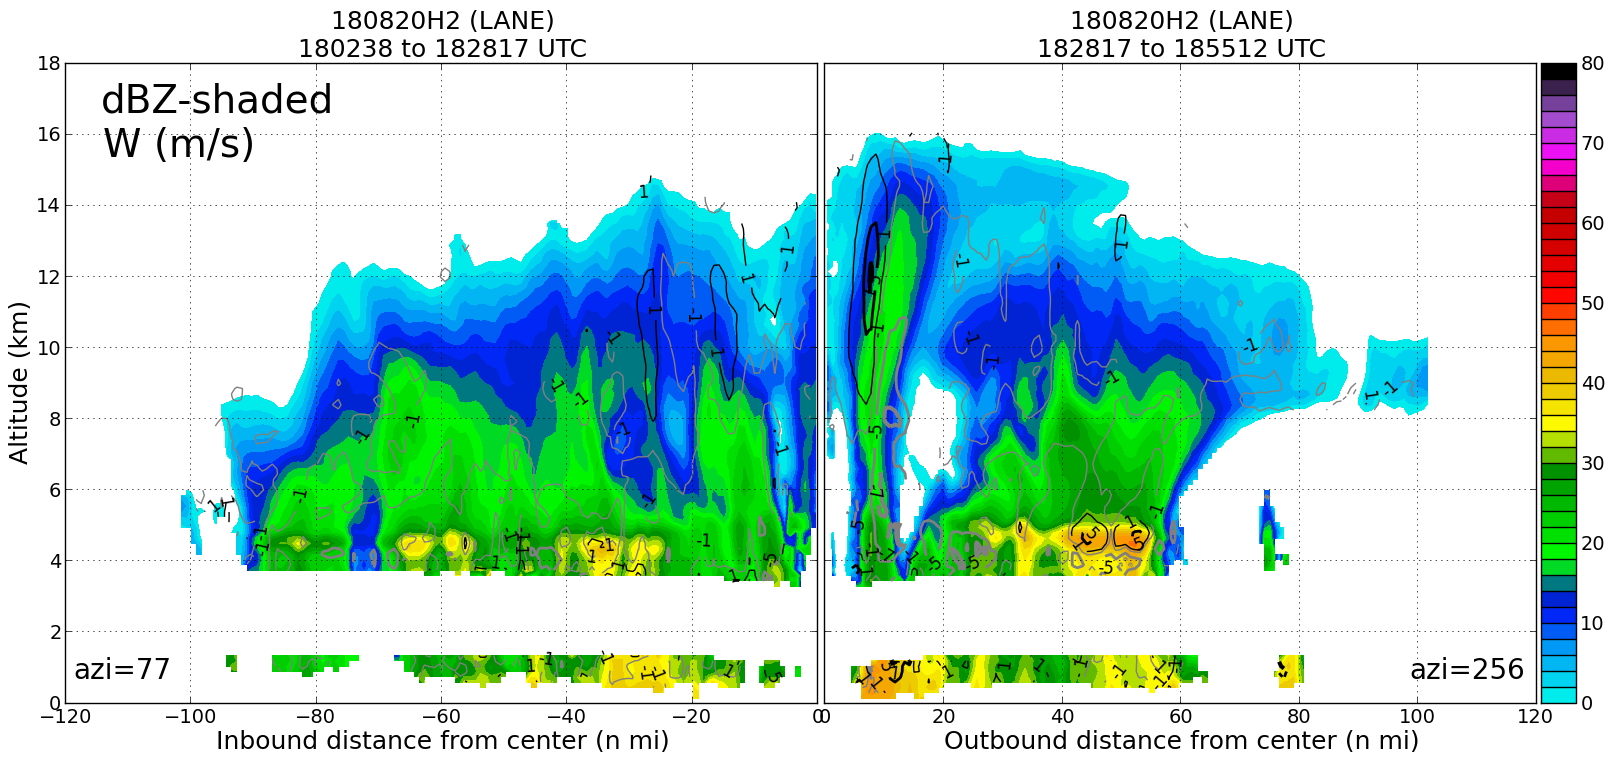 Figure 10: TDR reflectivity (shaded, dBZ) and vertical velocity (contoured, m s-1). |
Mission Evaluation:
This mission was a success. We were able to collect and transmit TDR data to EMC and for display in AWIPS2, DWL and WSRA data was collected and transmitted, and SFMR high-incidence angle data was collected with 3 circles flown at 30° and 5 circles flown at 45°. 12 dropsondes were released, with 1 failure. 5 AXBTs were released with 3 failures.
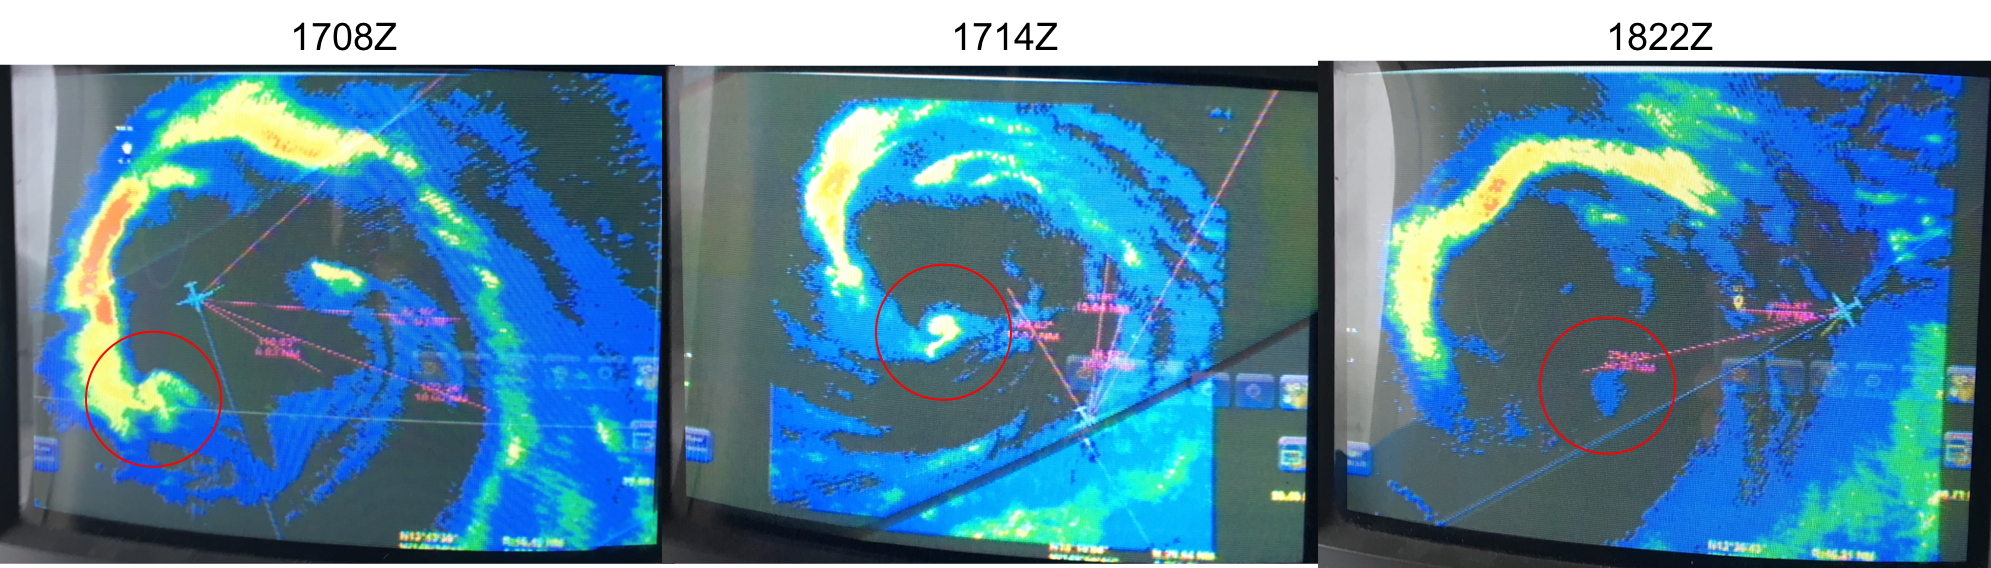 Figure 11: Photographs of the MMR display on the aircraft from 1708Z, 1714Z, and 1822Z. The red circle highlights an apparent mesovortex signature in the radar reflectivity. |
Problems :
Takeoff was delayed about 20 mins because of problems with filing the flight plan. The initial leg had to be adjusted to account for the eye being further south of the forecasted position. Therefore, we had to rotate the butterfly slightly. At the beginning of the flight, TDR radarsync -a command initiated a jobfile on data from the previous flight. However, it did not impact any of the analyses for this flight.
Heather Holbach
Oct. 5, 2018
Flight track with winds |
Timeseries wind, SFMR wind, rain rate, altitude and pressure plots |
 Flight track |
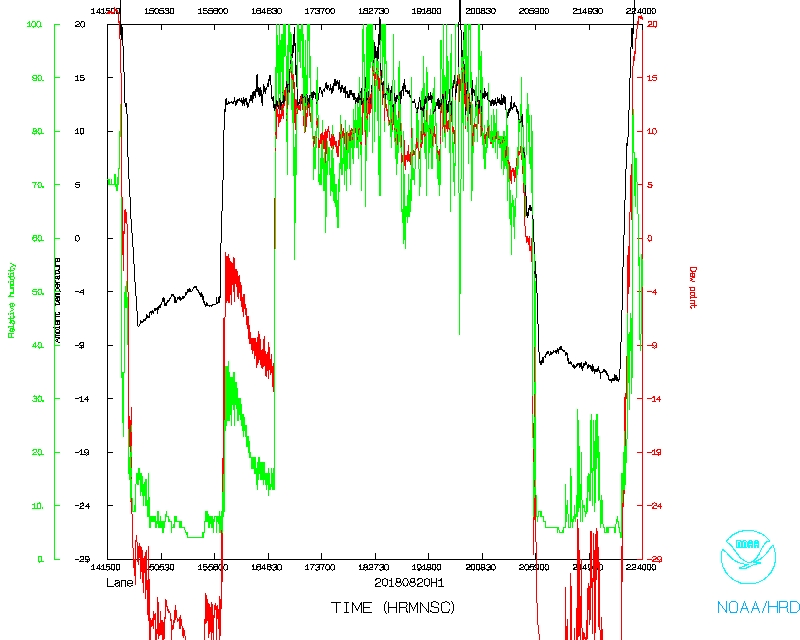 Temperature and Moisture |
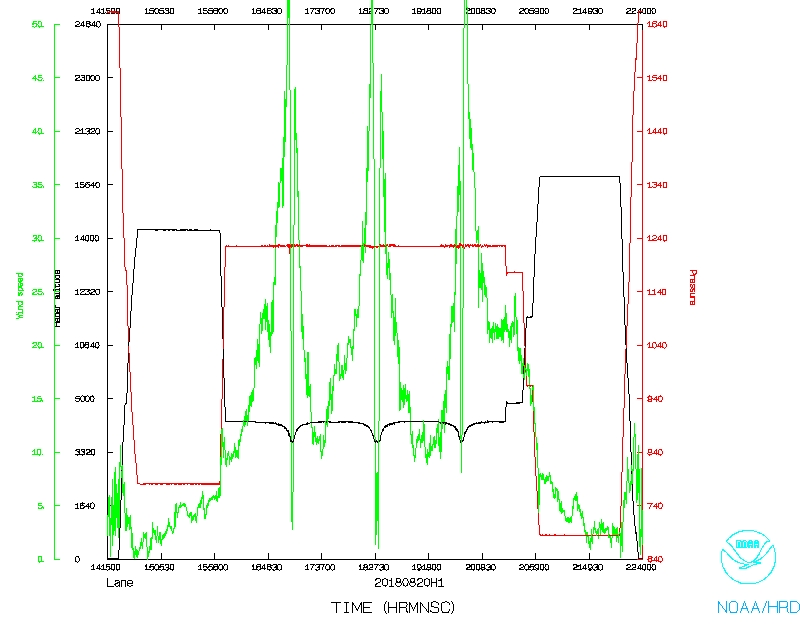 Wind and Atlitude |
 Flight track |
LPS log |
Radar log |
Drop log |
AXBT log |
DWL log