 Figure 1.Planeed flight track for the mission. |
| Aircraft Commander | Nate Kahn |
| Co-pilot | Adam Abitol |
| Co-pilot | Pat Didier |
| Flight Engineer | Ken Heystek |
| Flight Engineer | Mike Sanchez |
| Navigator | Sam Urato |
| Flight Director | Rich Henning |
| System Engineer | Joe Greene |
| Data Technician | Mike Mascaro |
| Dropsonde Operator | Akshar Patel |
| Sim Aberson | LPS | HRD |
| Kathryn Sellweood | Radar | HRD |
| Kelly Ryan | DWL | HRD |
| Suring | Observer | JTWC |
| Evans | Observer | NWS |
| Radar | John Gamche | HRD |
|
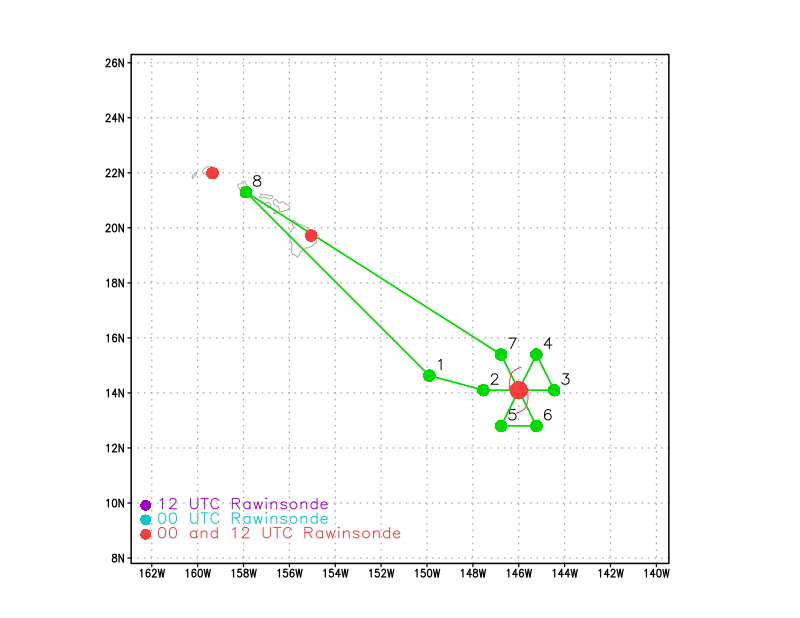
Figure 1.Planeed flight track for the mission. |
Mission Plan :
The plan for this EMC-tasked mission was to fly a butterfly pattern (Fig. 1) with three passes through the center, but to first drop an AXBT at the 24-h forecast location to sample changes in the ocean as the hurricane passed. The mission was an EMC-tasked mission.
|
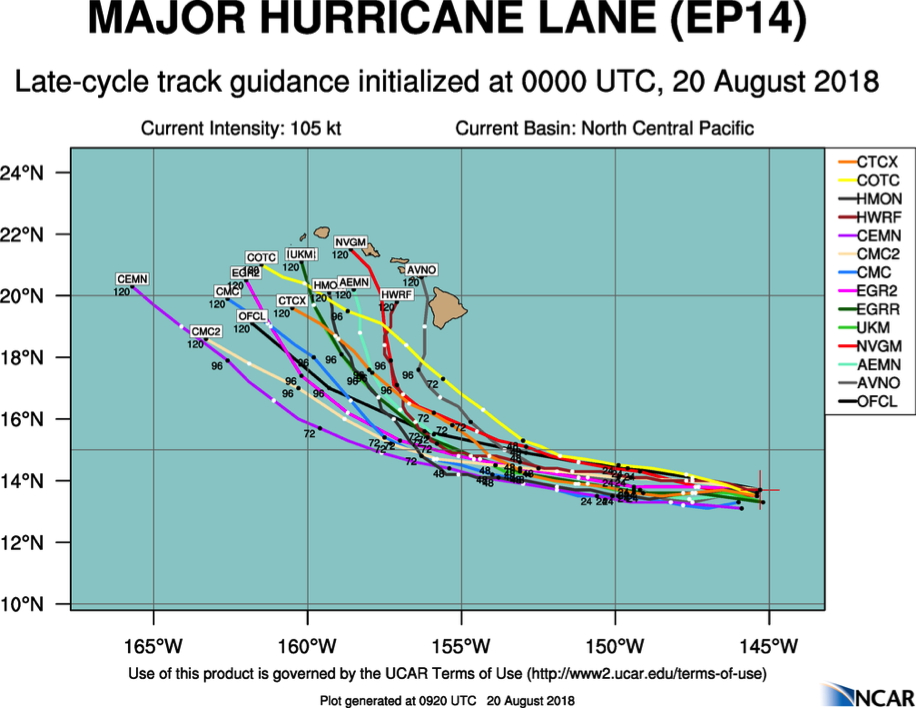
Figure 2. Track (top) and intensity (bottom) forecasts from the
various models available at the mission start time
| |
Mission Summary :
| Take off | Landing
| Honolulu, HI
| 02:08 UTC
| Honolulu, HI
| 09:59 UTC
| | ||
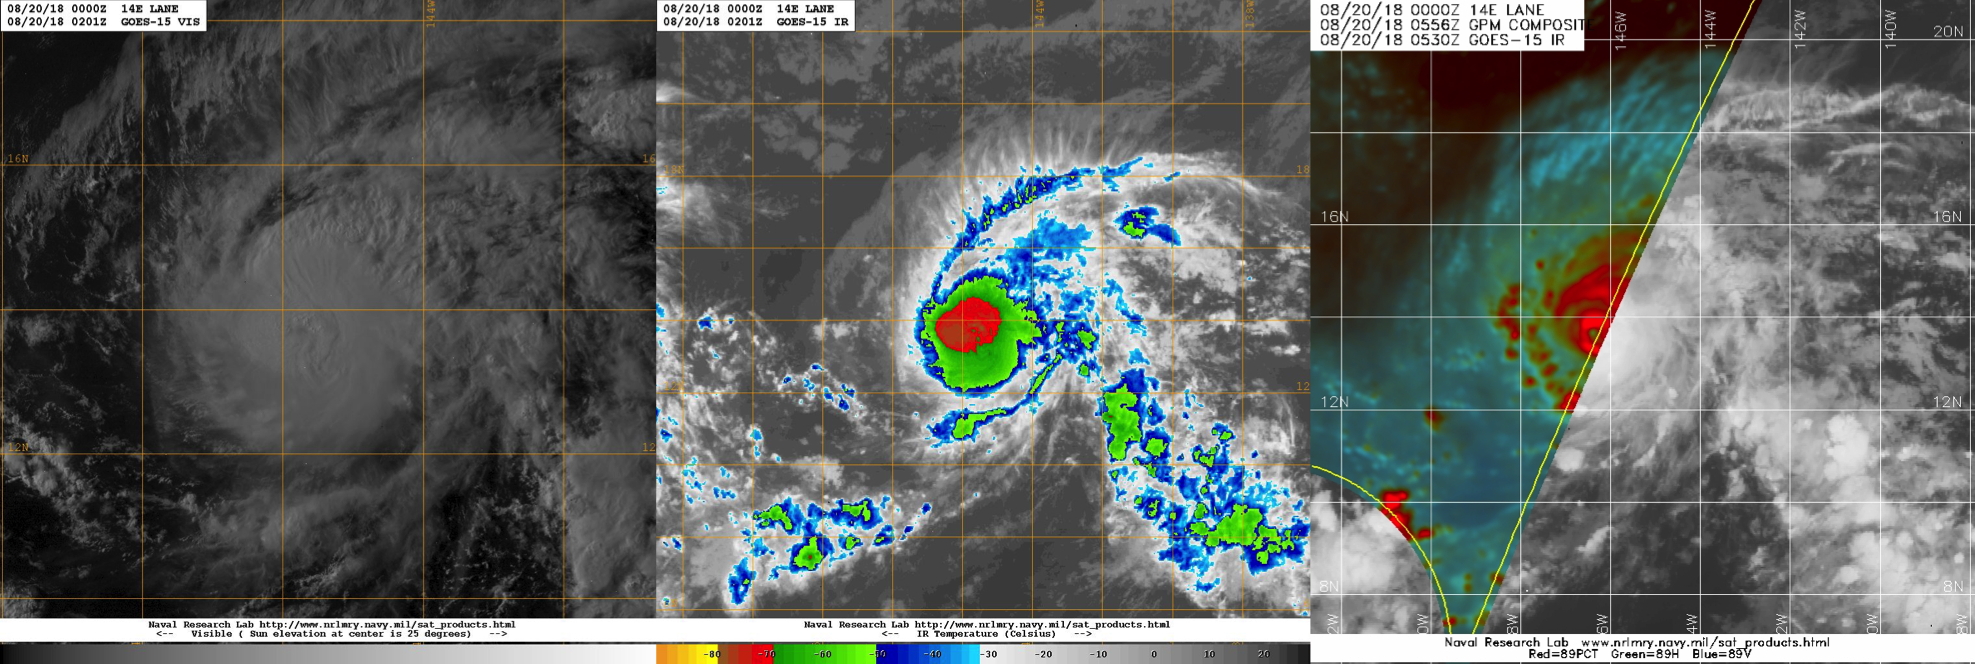 Figure 3. Infrared (left) and composite microwave (right) imagery available at mission start time. |
At the mission start time, Hurricane Lane was a major hurricane with estimated maximum sustained wind of 105 kt, moving westward. The forecast was for it to pass well south of the Big Island of Hawai'i and then turn north, with the intensity being steady-state or a slow weakening anticipated (Fig. 2). Though no eye was visible on either the visible or infrared satellite imagery, a well-defined eye was seen on microwave imagery (Fig. 3).
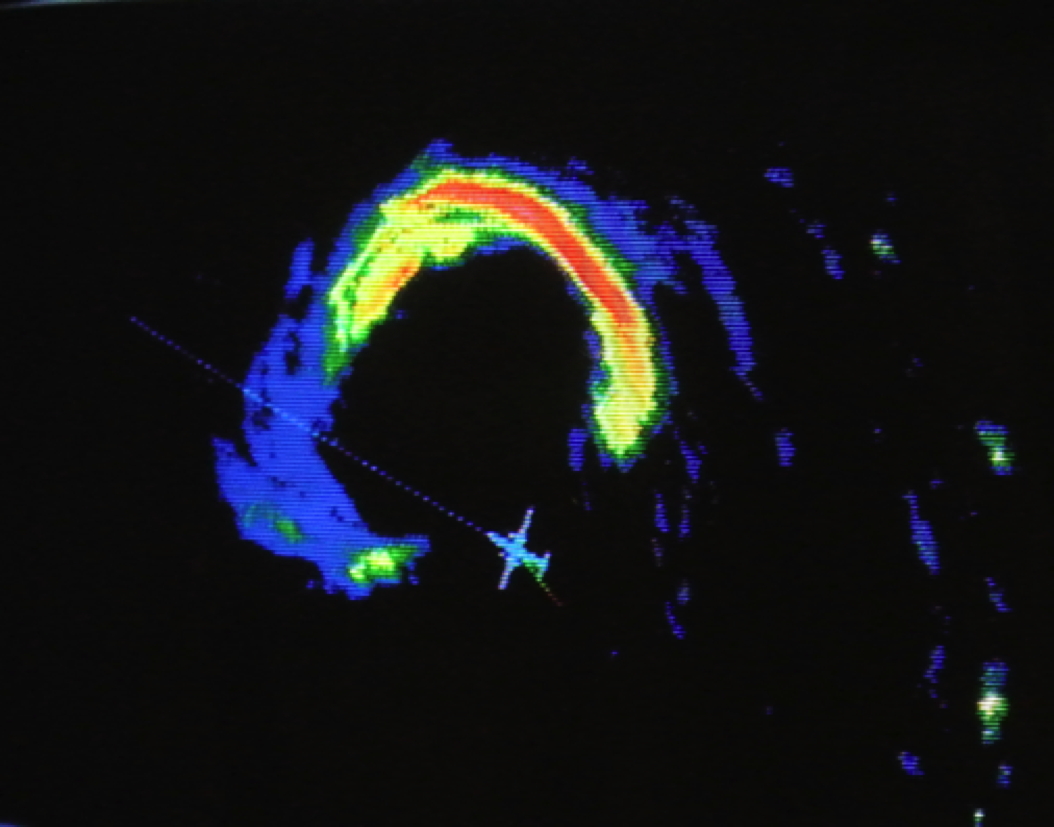 Figure 4. Photograph of the lower-fuselage radar showing the structure of the eyewall of Hurricane Lane. |
The IP was reached, and an AXBT was launched, reporting a sea-surface temperature of about 27.7°C, which was near what was expected. The butterfly pattern was then completed largely as planned, and three radar analyses were transmitted. During the mission, Lane's central pressure rose by 4 mb, suggesting that the intensity forecast was correct, at least in the short term. Lane also was moving just south of due west during the period, which was outside the envelope of the guidance.
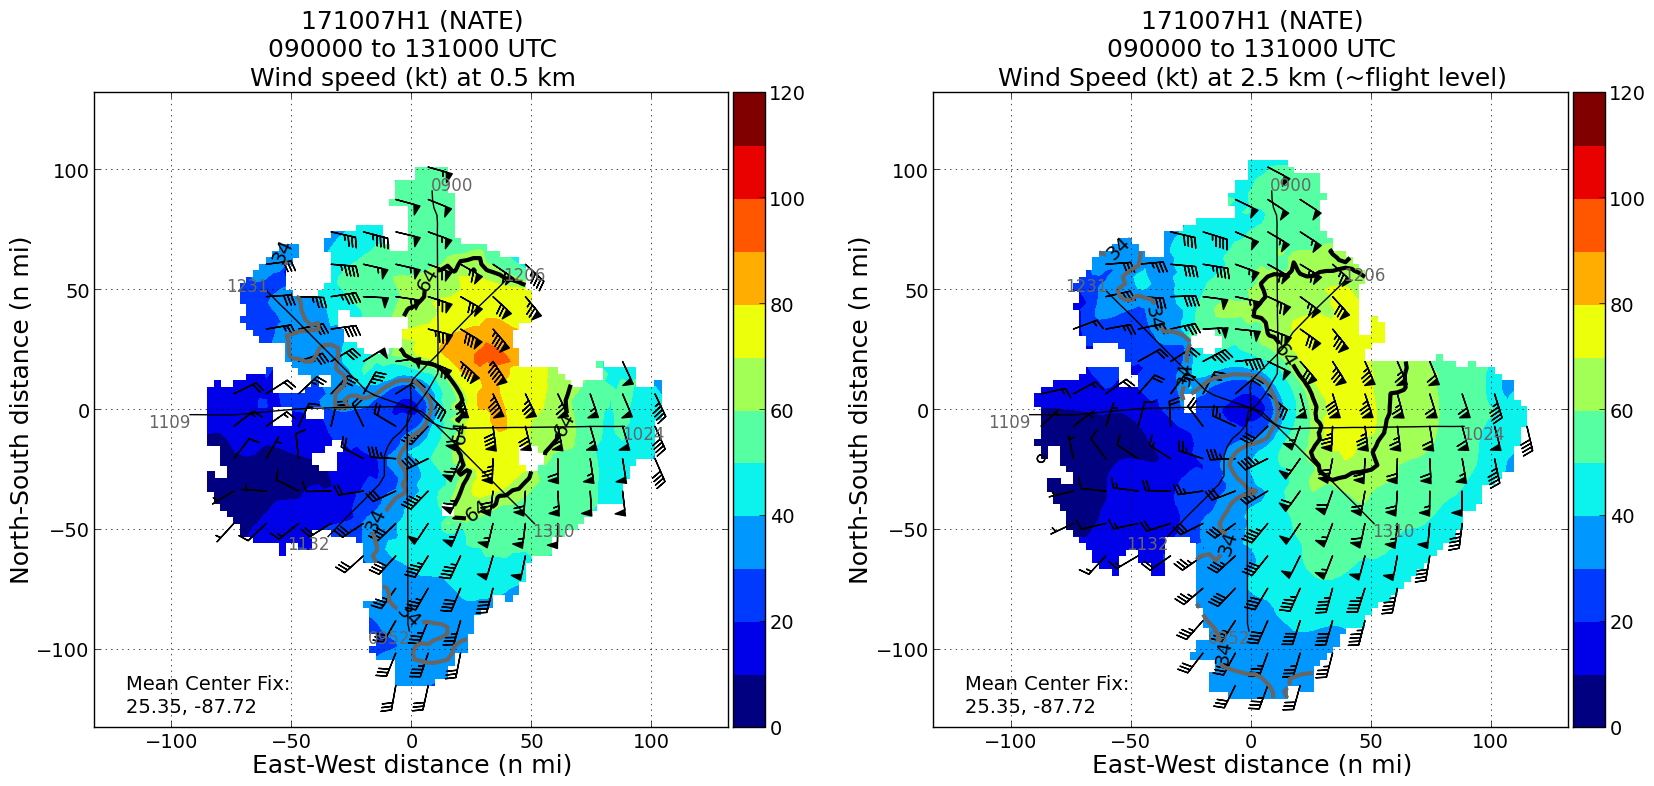
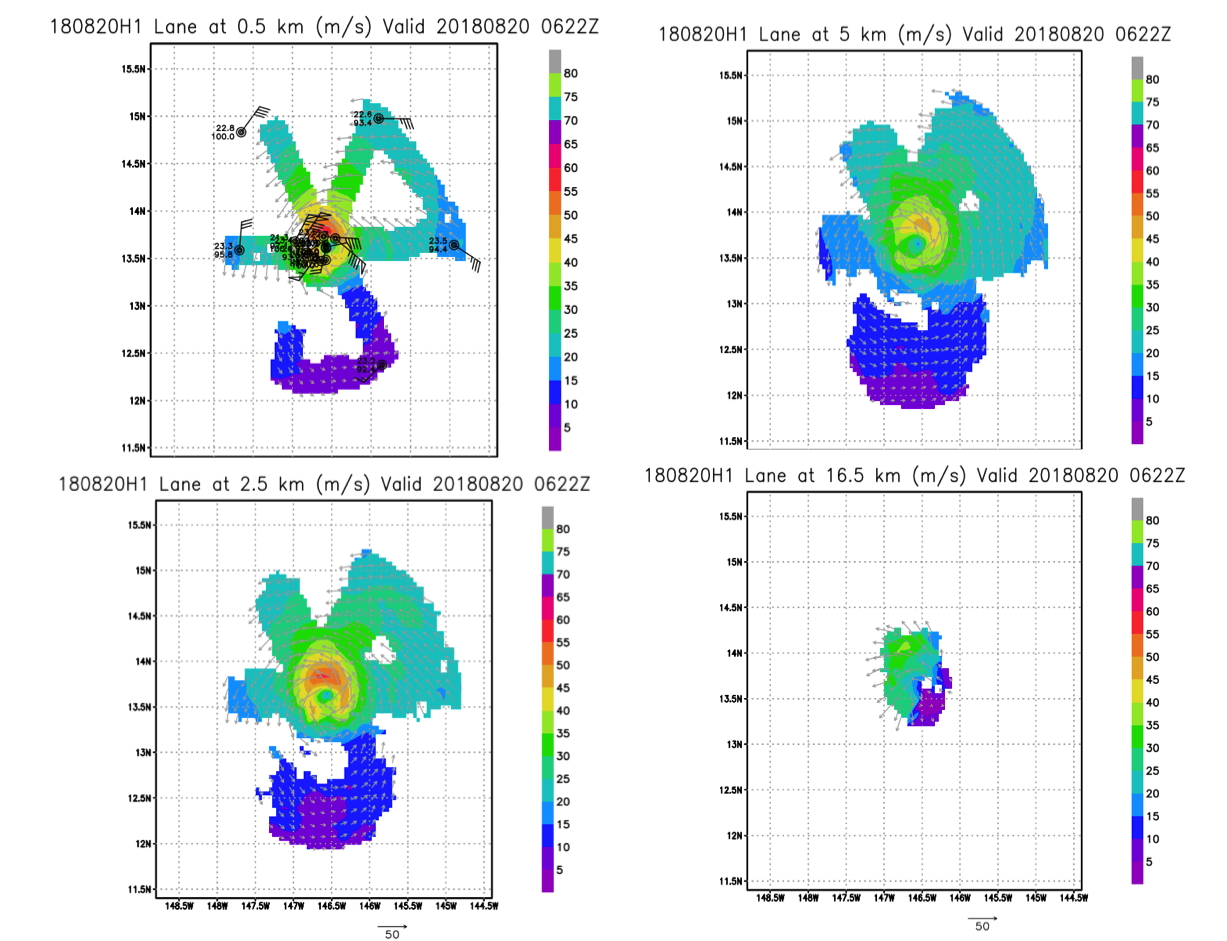 Figure 5. Composite radar and dropwindsonde analyses at four levels composed of data that were transmitted during the flight.,i. |
The core structure of Lane was interesting. The radar never showed a fully closed eyewall (Fig. 4), which may be why it slowly weakened. Despite this, strong turbulence was encountered in the western eyewall, where the reflectivity was quite low, during a penetration, suggesting intense building cloud tops in that region. Multiple AXBTs were dropped in storm. The SST was reported to be 28.5°C in the northwest eyewall, largely in front of the storm, but was also 28.4°C in the southeast eyewall behind. I was surprised at the symmetry of the SST and the lack of cooling behind the storm.
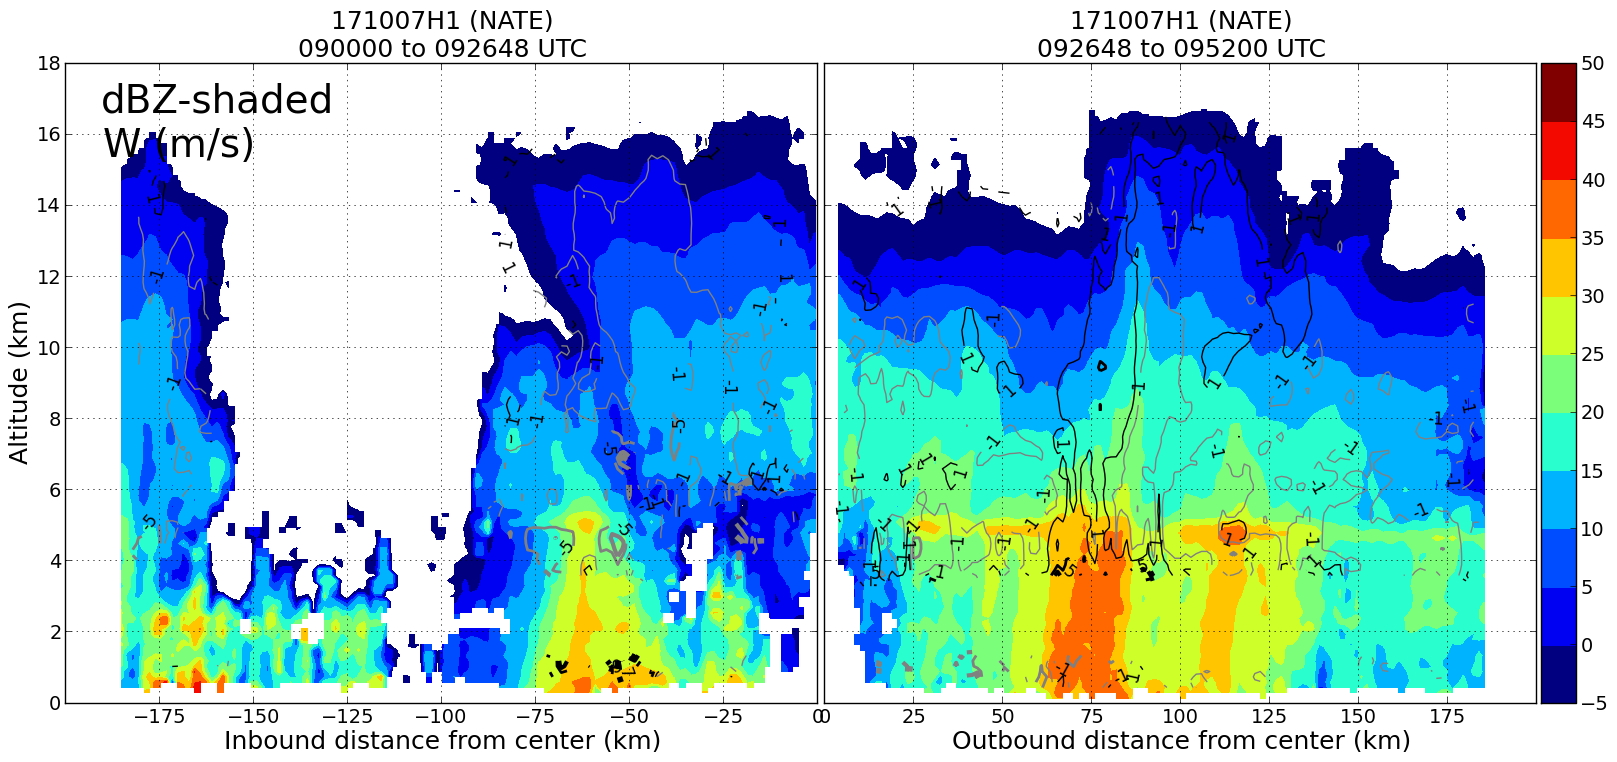
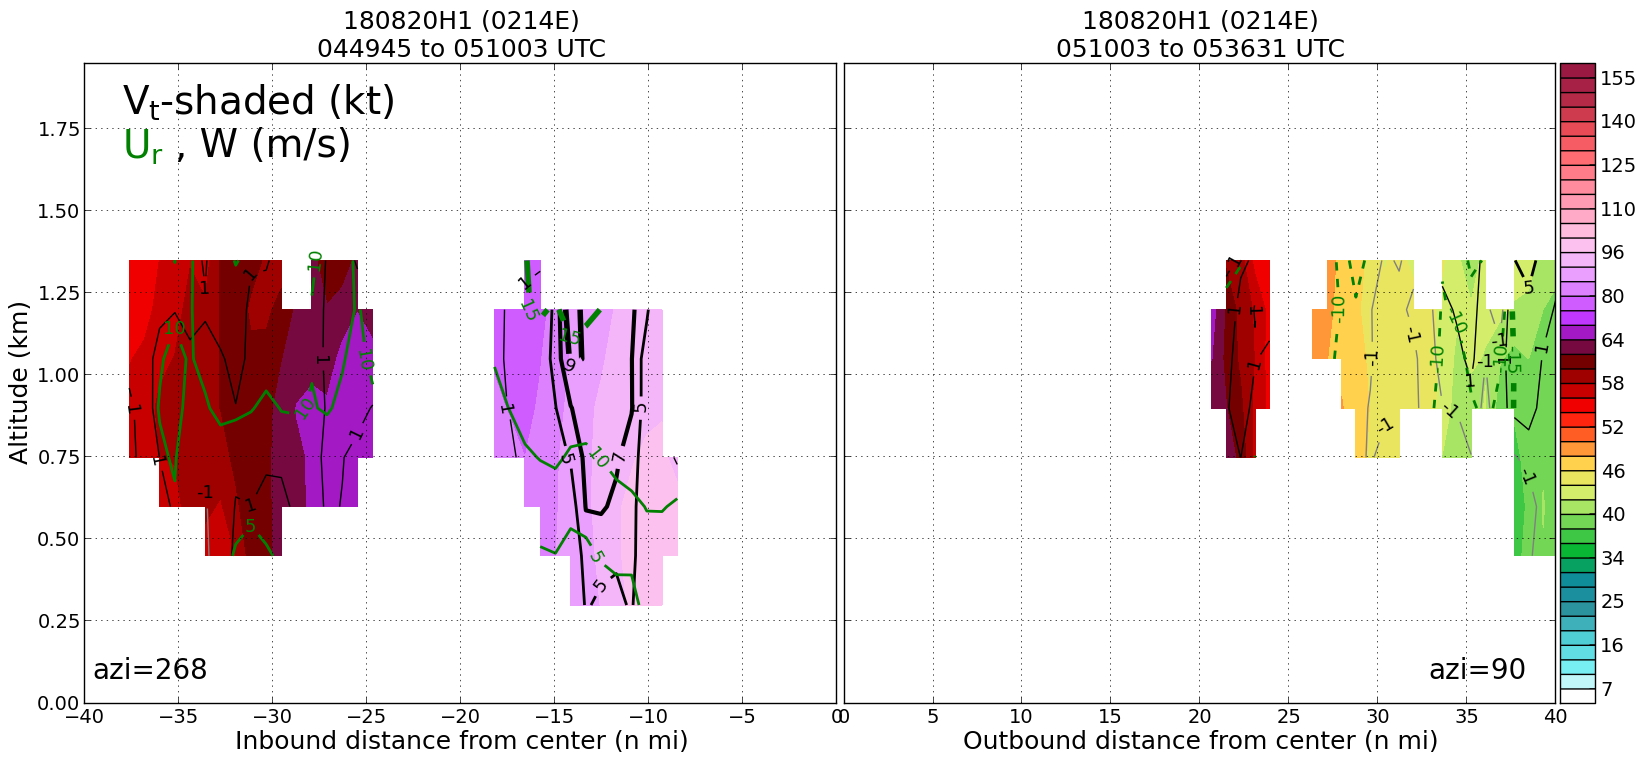
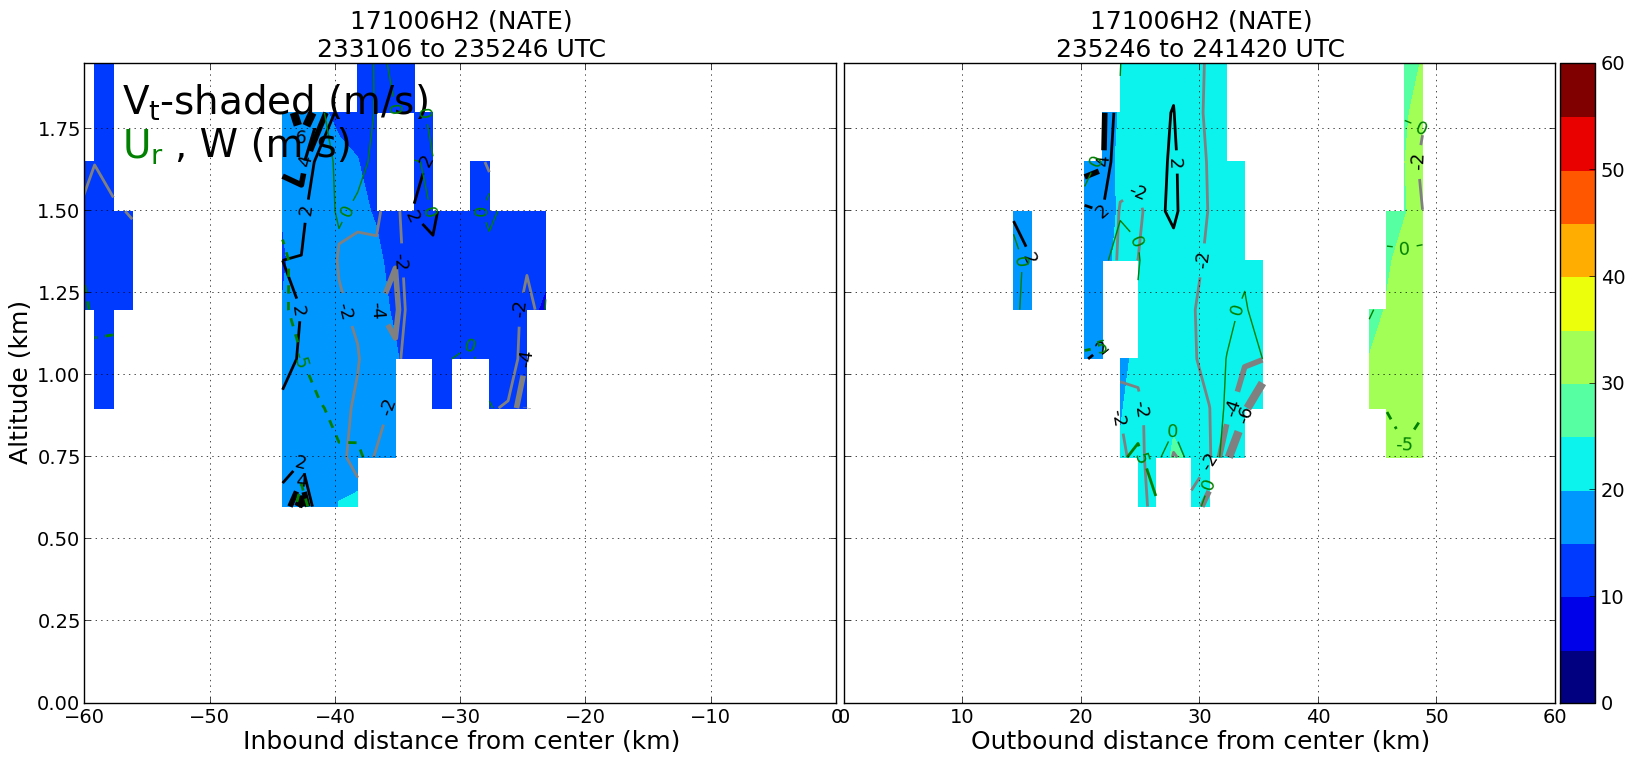
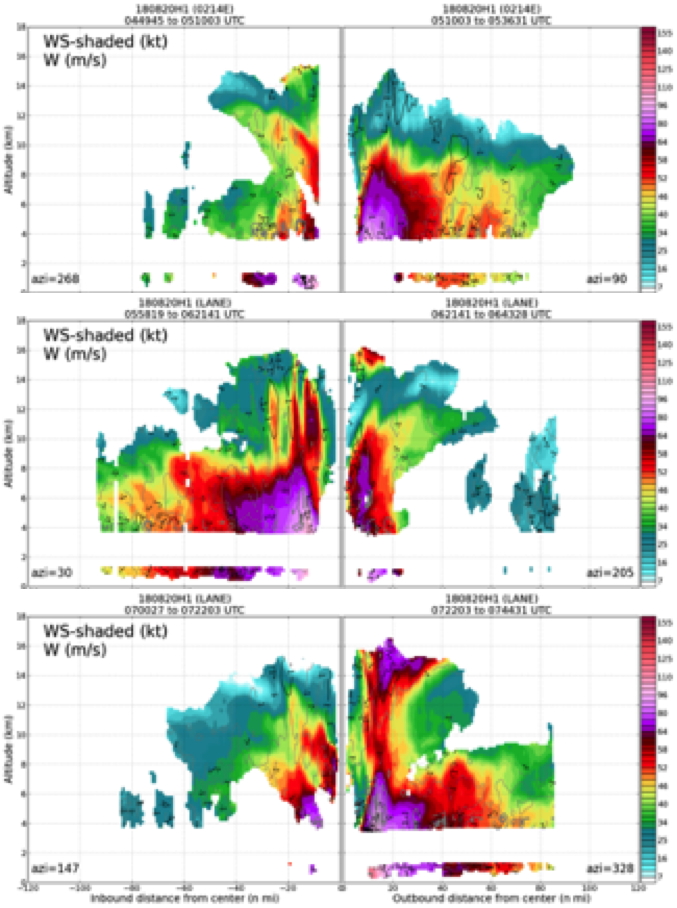 Figure 6. Radar analysis profiles from the three analyses transmitted during the mission. |
Despite being a category-3 hurricane with a slowly rising central pressure, the wind-speed reports from various instruments suggested that Lane was a healthy hurricane, at least above the surface. One dropwindsonde reported 142 kt at about 350 m above the surface in the northwestern eyewall on the last pass, and another reported a 10-m wind speed of 137 kt at 10 m above the surface. However, the strongest surface wind speed reported by the SFMR was only 92 kt during the flight, and the highest flight-level wind speed was only 113 kt.
Problems :
Numerous minor problems were encountered during the mission, and they were mostly mitigated by the heroic efforts of Mike Mascaro.
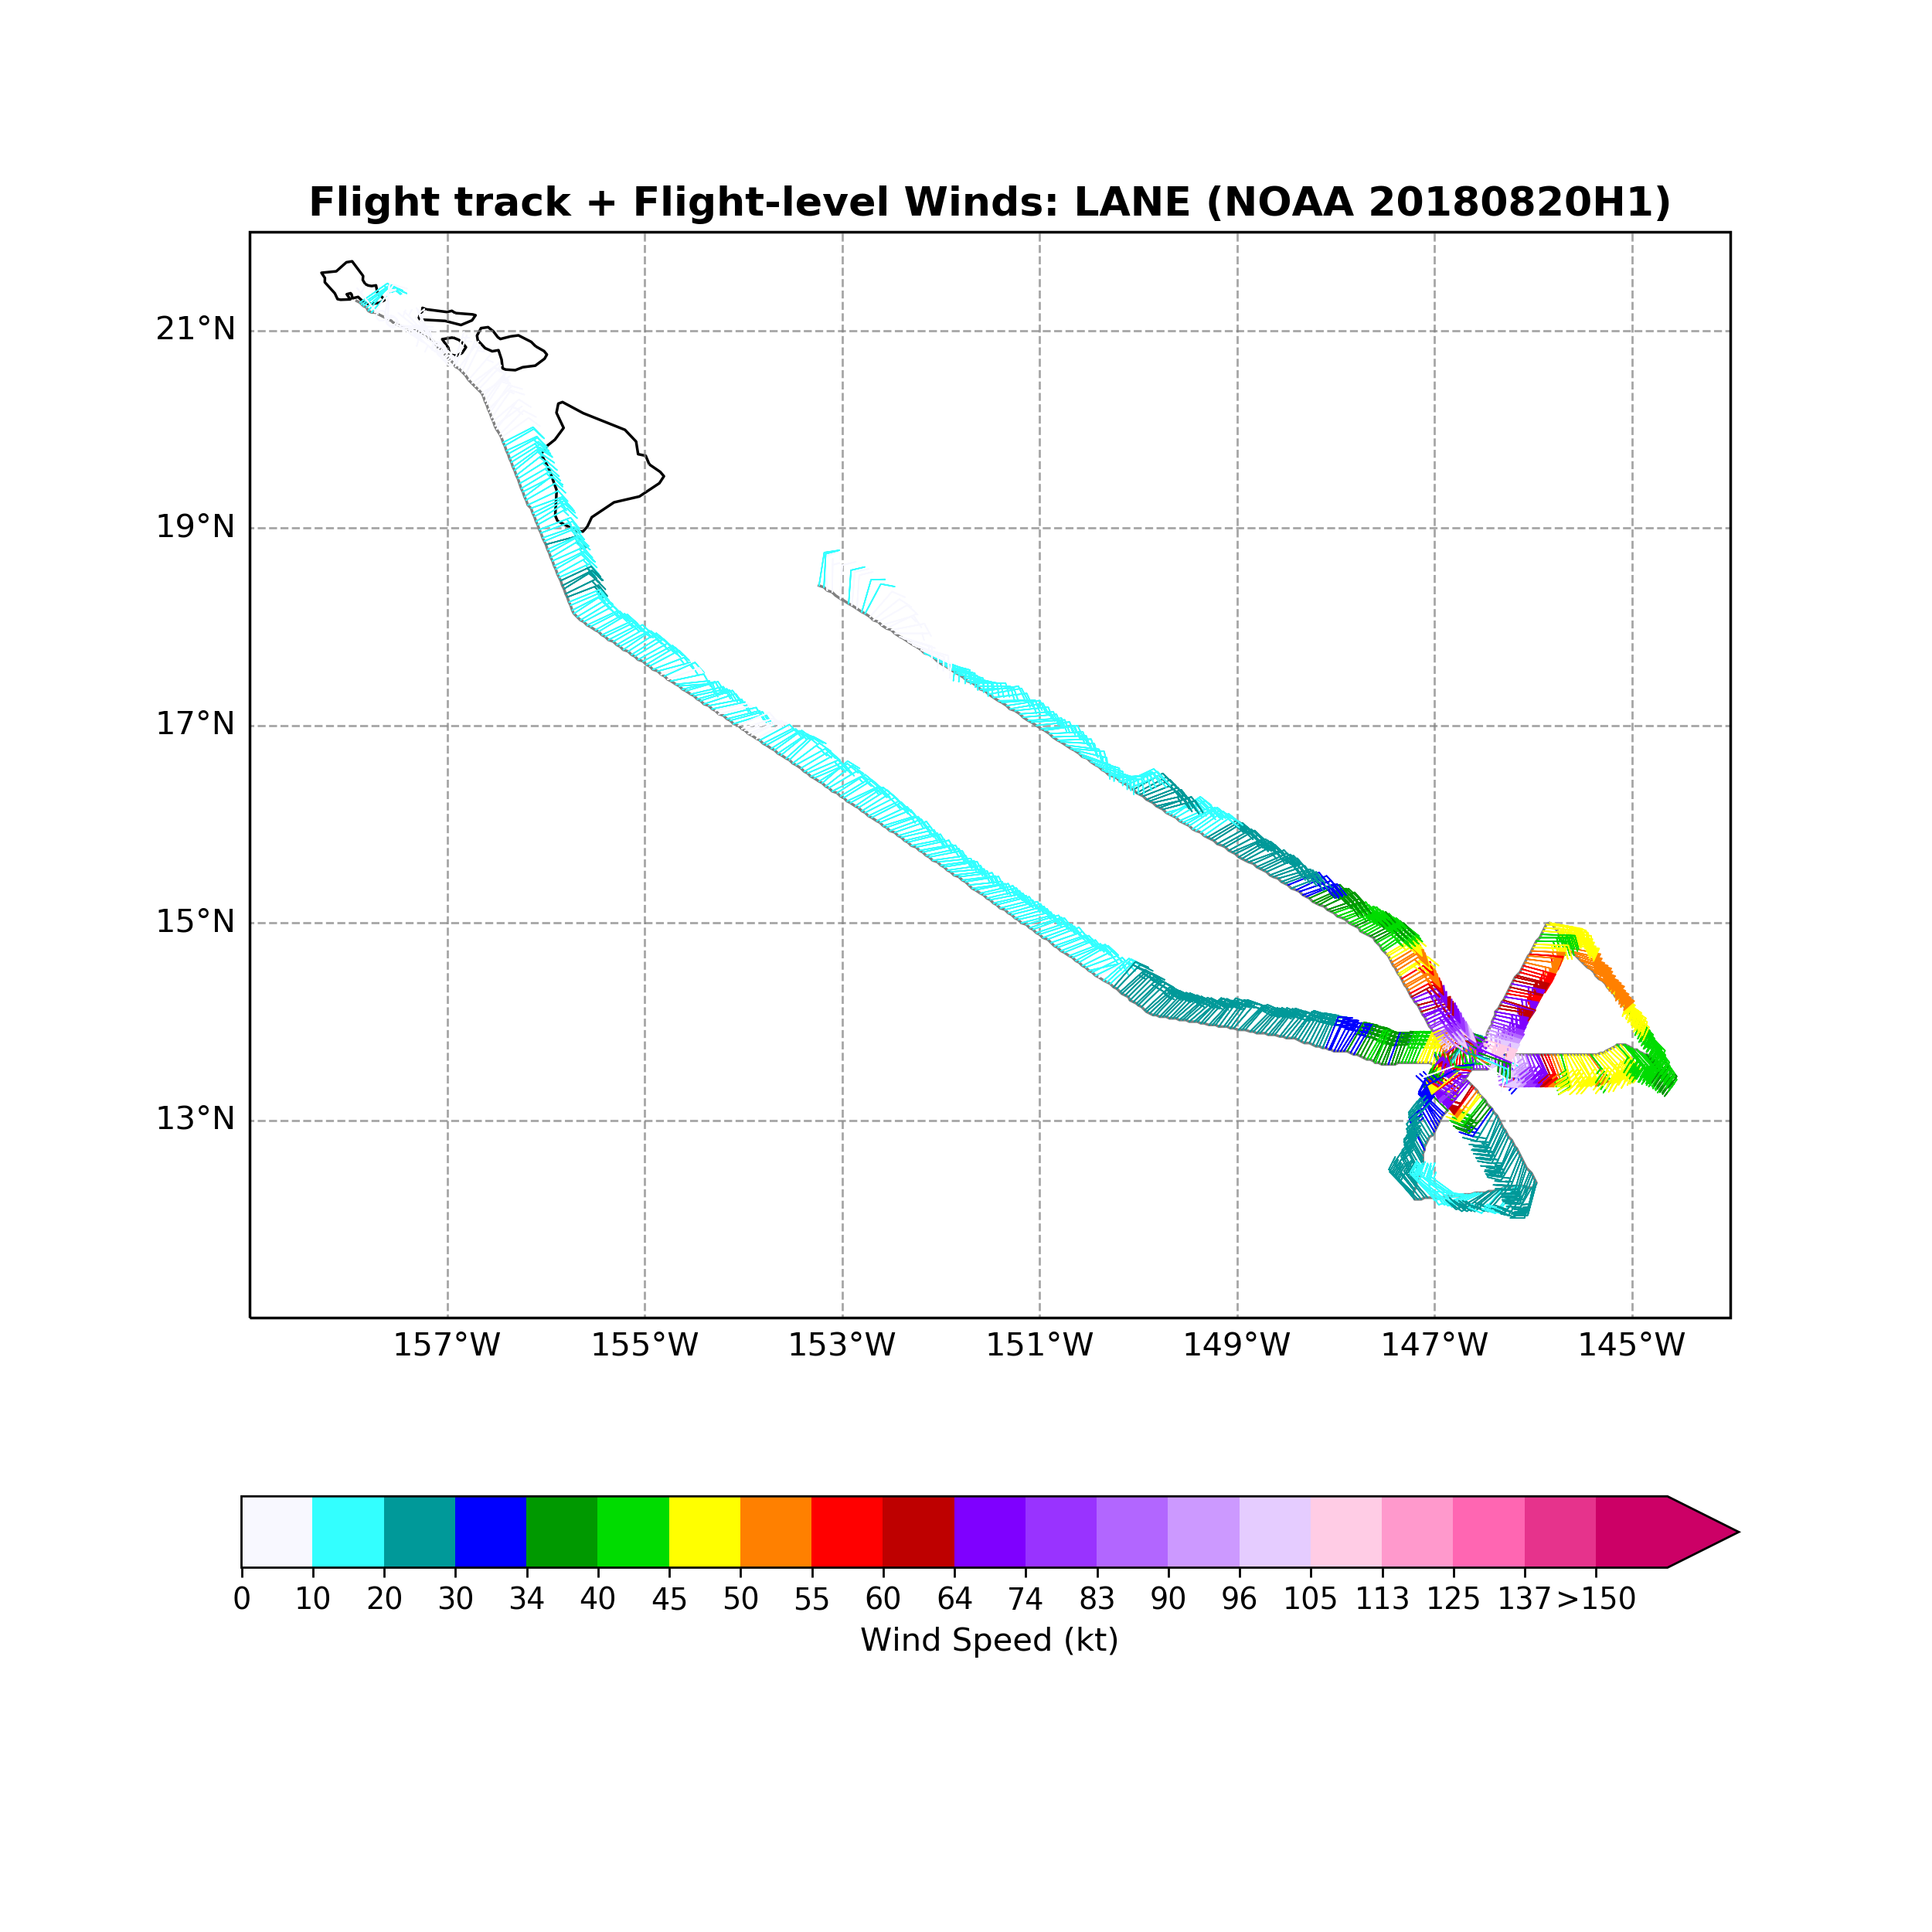
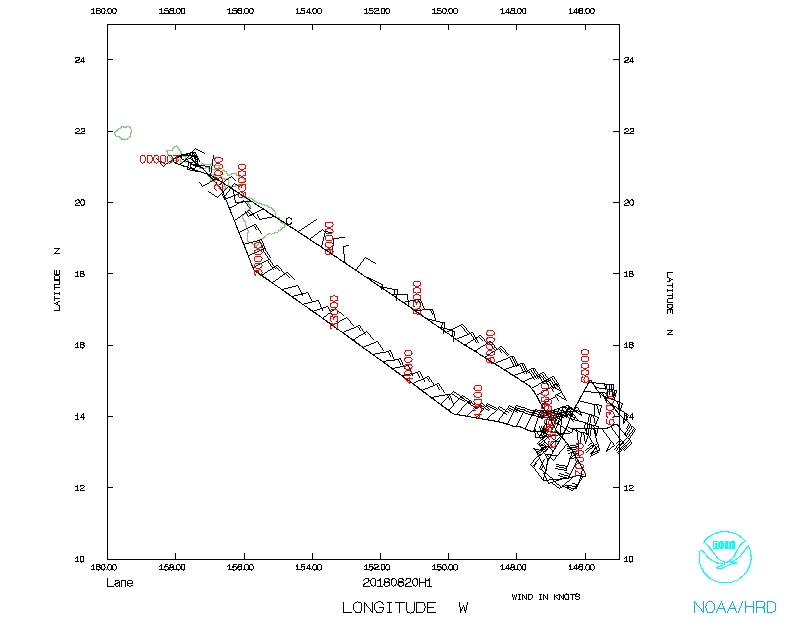
Flight track with winds |
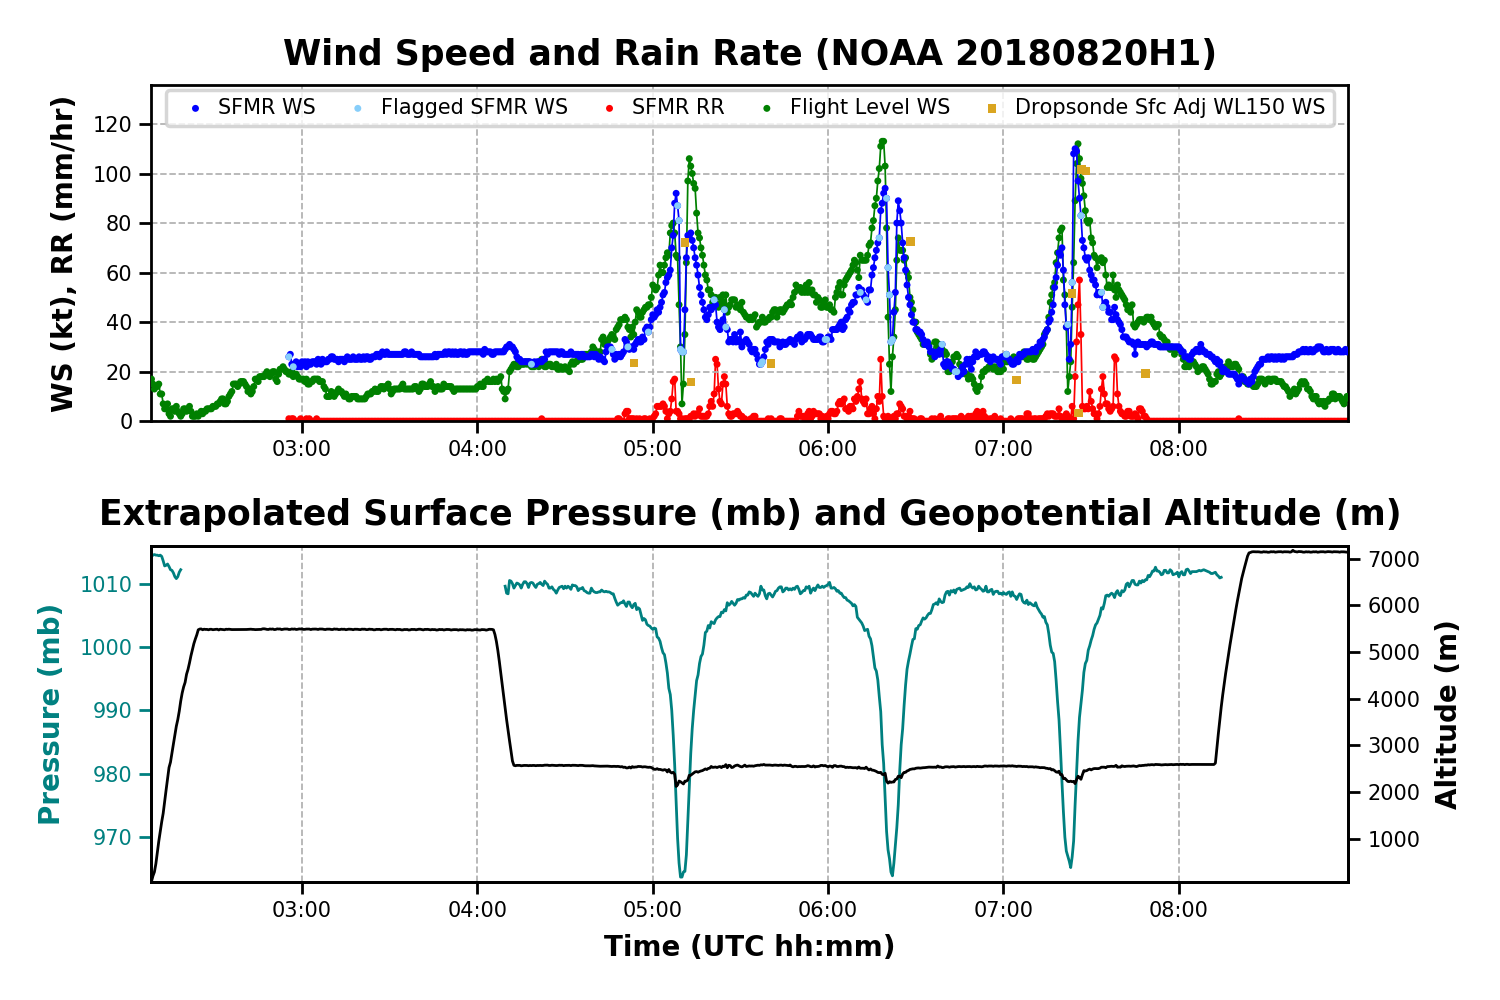
Timeseries wind, SFMR wind, rain rate, altitude and pressure plots |
 Flight track |
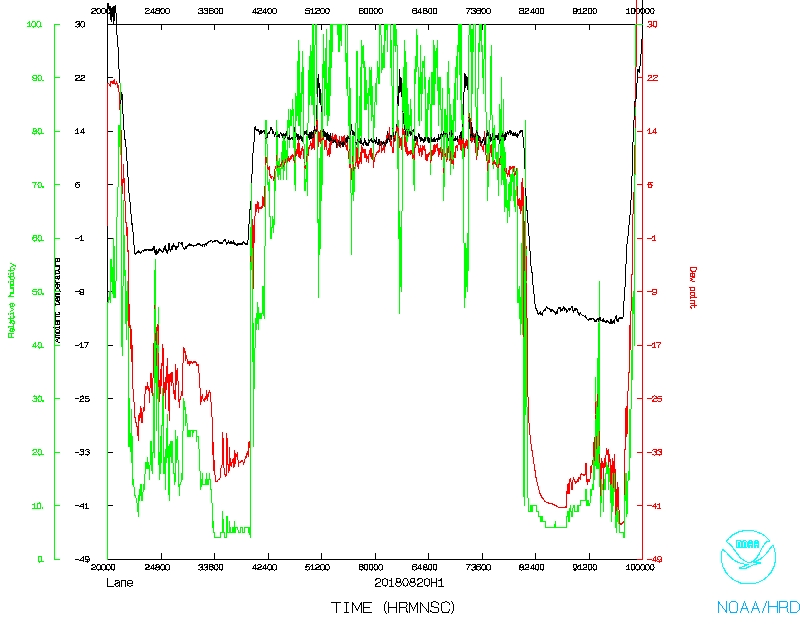 Temperature and Moisture |
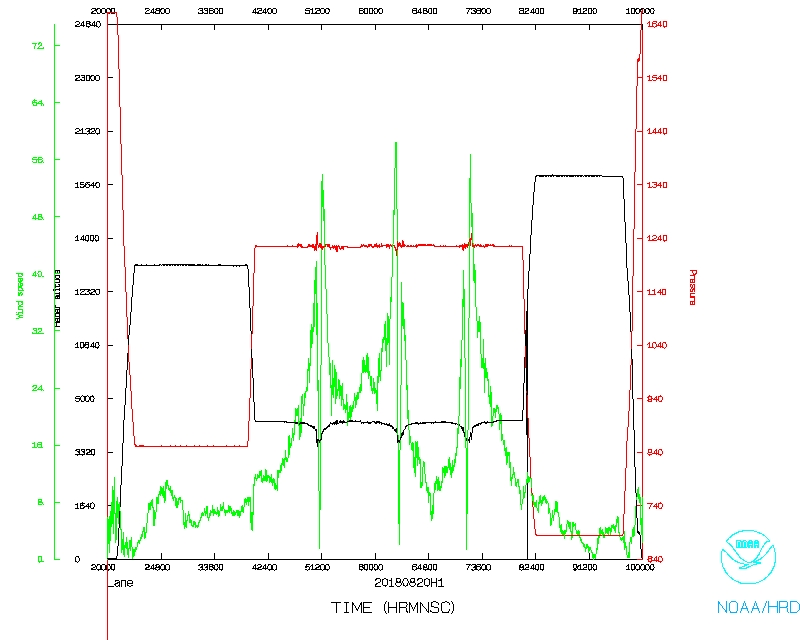 Wind and Atlitude |
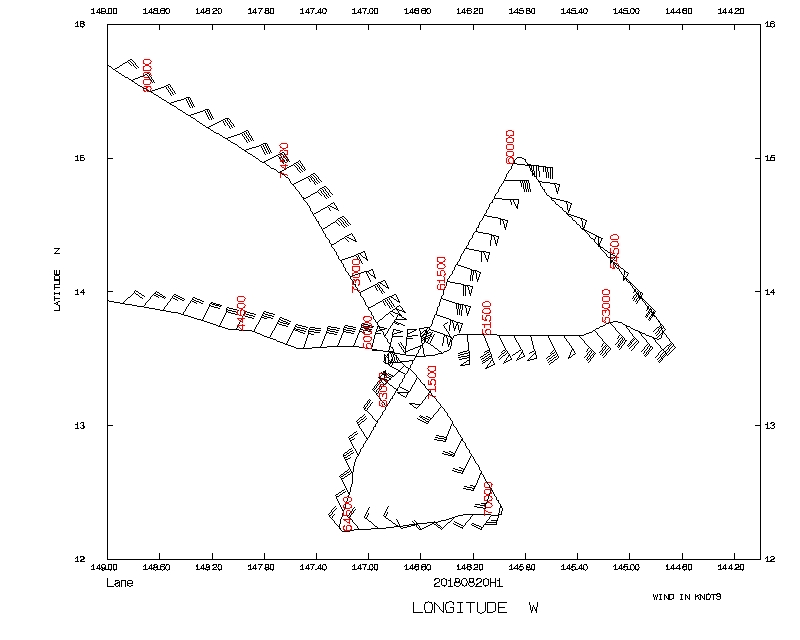 Flight track |
Flight Director's log |
Flight Director's manifest |
NetCDF data |
SFMR data |
serial data |
1 second data
LPS log |
Radar log |
DWL log |
Drop log