Mission Summary
20080927I1 Aircraft 43RF
Kyle Tail Doppler Radar flight 2008
Scientific Crew (43RF)
| Lead Project Scientist | Rob Rogers |
| Radar Scientist | Sylvie Lorsolo |
| Dropsonde Scientist | Neal Dorst |
Flight Crew (43RF)
| Pilots | Barry Choy
Amelia Erhardt
Carl Newman
|
| Flight Director | Paul Flaherty |
| Navigator | Ryan Kidder |
| Flt. Eng. | Joe Klippel
Dewie Floyd |
| Data Tech | Terry Lynch |
| Elec. Tech | Jeff Smith
Damon San Souci |
Mission Plan :
Fly a butterfly pattern in TS Kyle. Initial point on southwest side, end up
on west side of storm. Do a center fix on the first pass. Fly whole pattern
at 10,000 ft. Drop sondes 50 nm from center on each radial leg, and 1-2 drops
at center.
Mission Summary :
| Take off
| Landing
| MacDill AFB, FL | 11:51 UTC
| MacDill AFB, FL | 20:02 UTC
| |
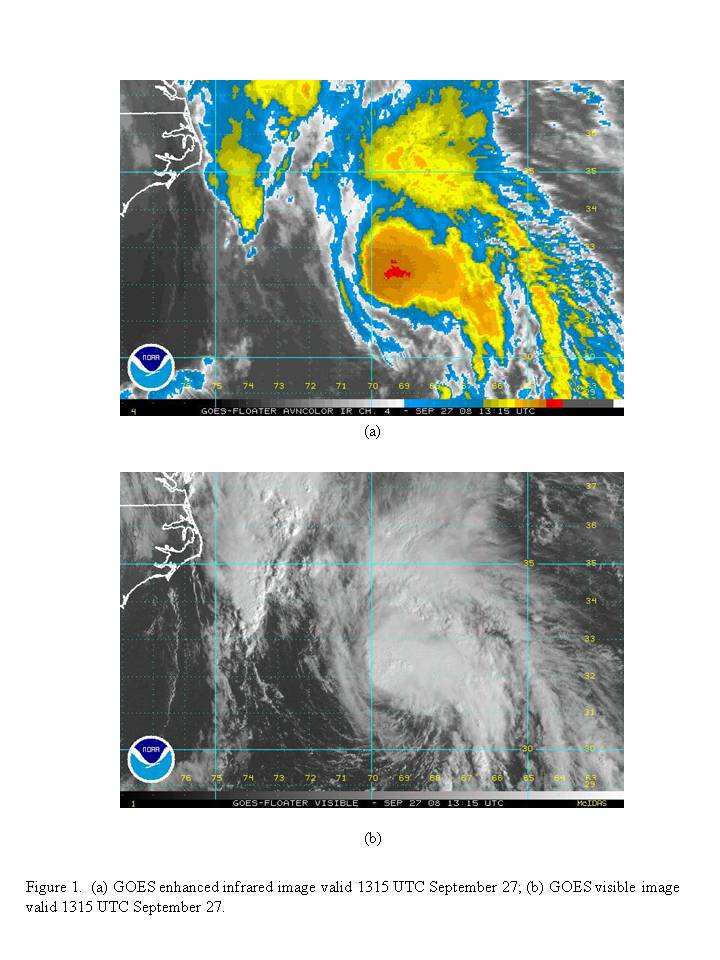
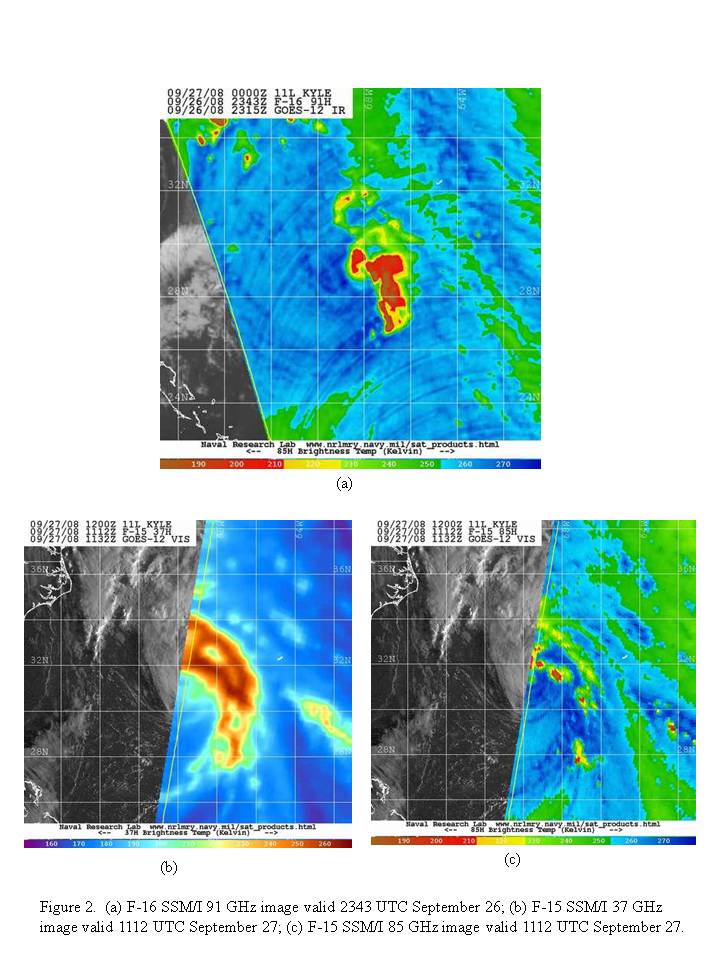
Kyle has been slowly intensifying, even in the presence of moderate
southwesterly shear. Convection has been developing closer to the center
(Fig. 1 and, Fig.
2), with the previous N42RF mission reporting numerous occurrences of
lightning on the east side of the storm. The main convection is displaced to
the north-northeast of the center, though. There are some indications of
downdrafts on the southwest side in the visible imagery.
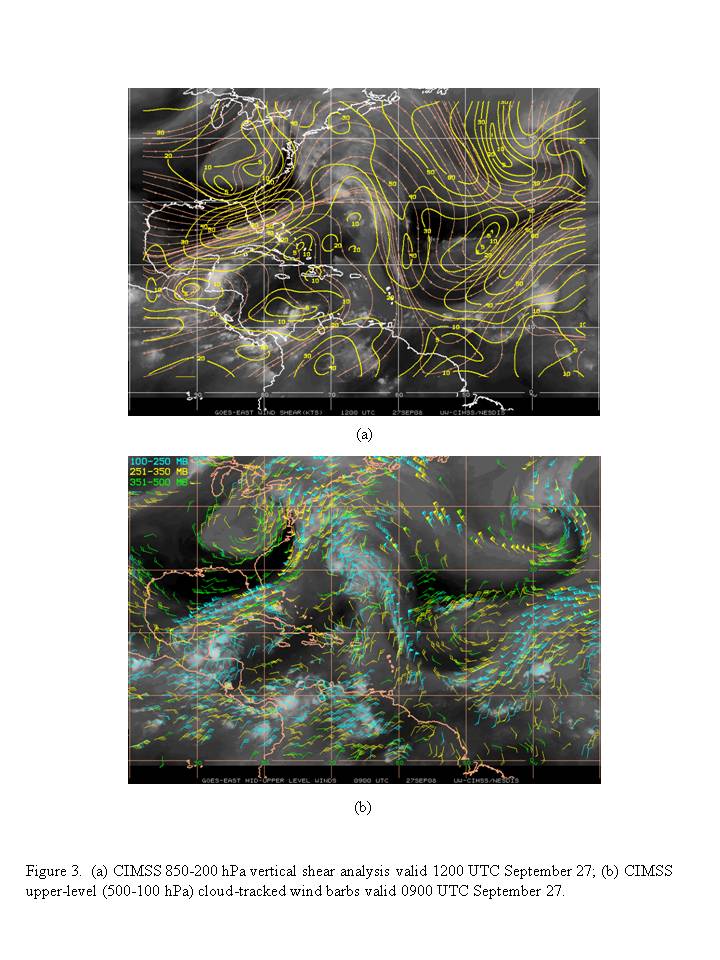
The vertical shear has relaxed some (Fig. 3),
with shear values over inner core at 15-20 kt. The upper-level winds show a
ridge axis over the storm, and the strong westerly jet over the Florida
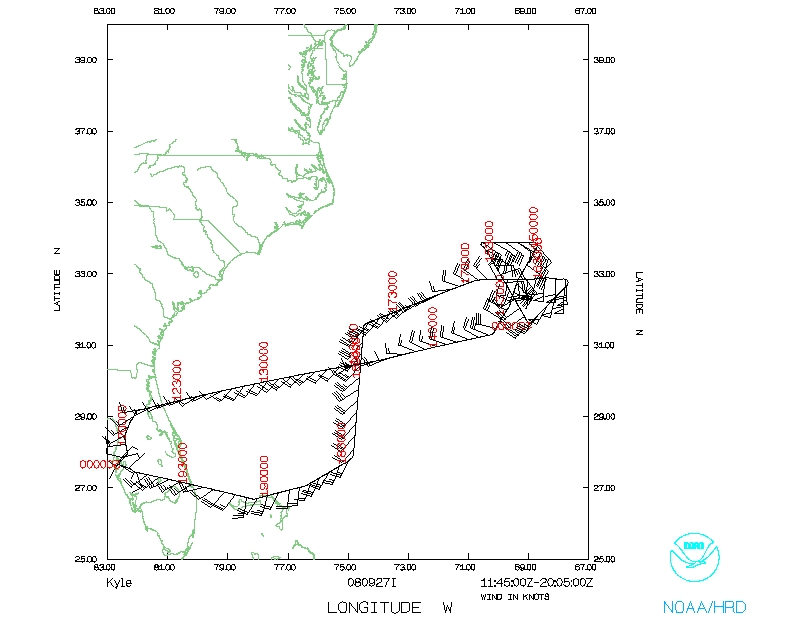
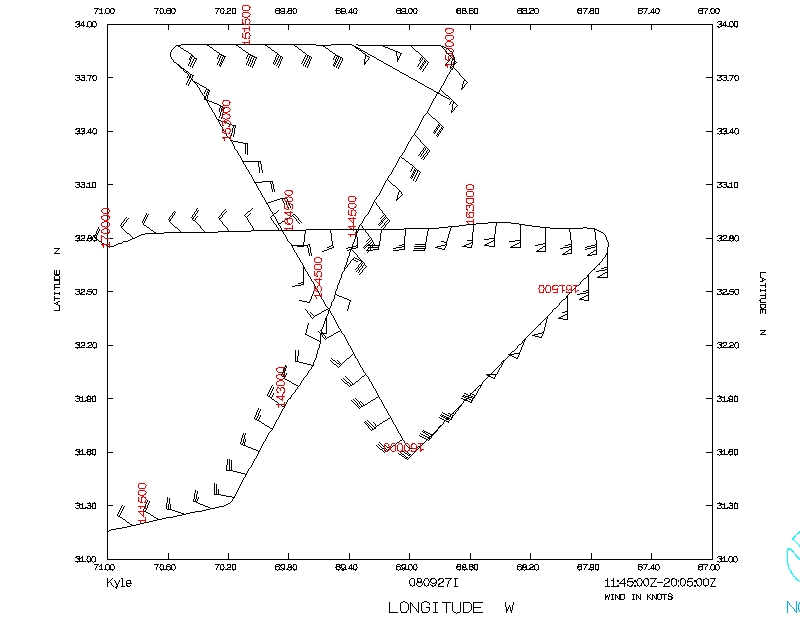
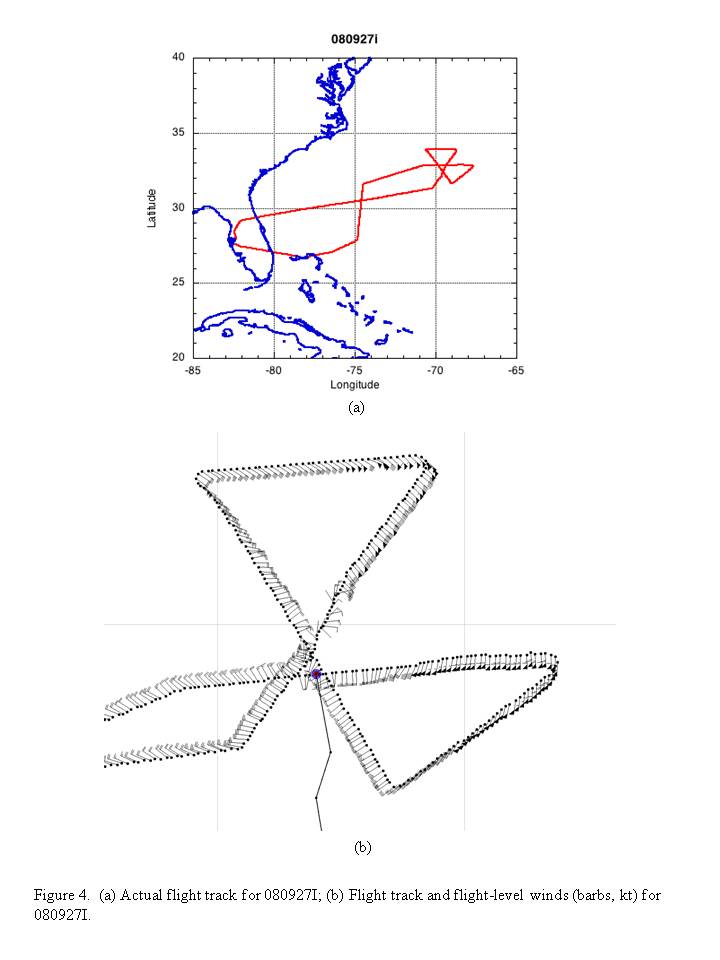
peninsula and well to the west of Kyle. Flight-level winds are strongest on
the east side of the storm as it accelerates to the north, with peak values
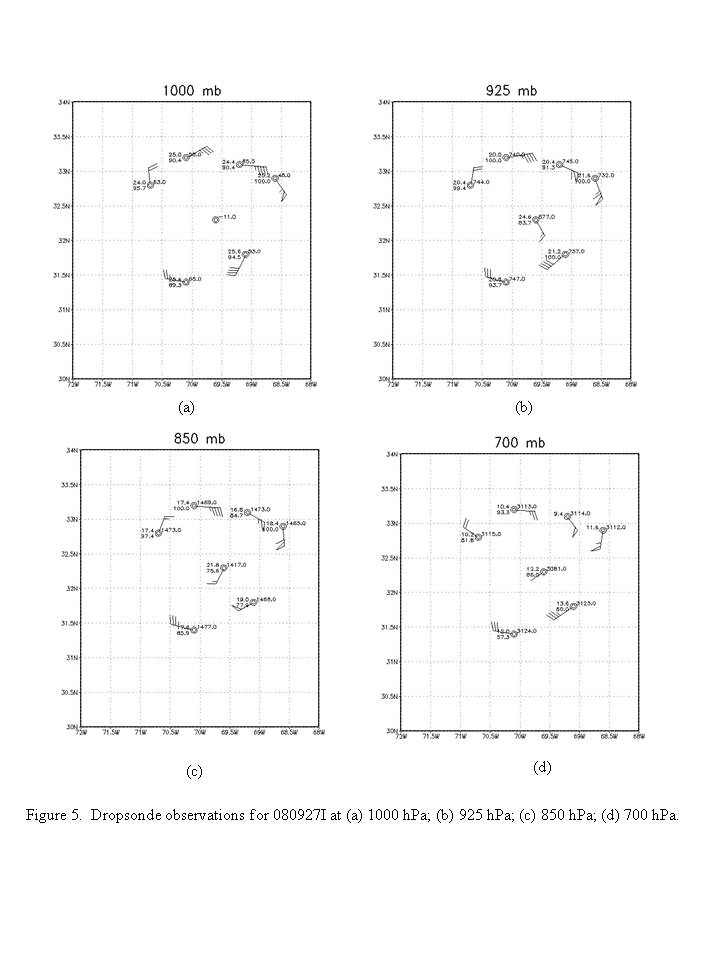
above 50 kt (Fig. 4). Dropsondes suggested a
tilt of the vortex toward the north-northeast with height between 1000 hPa and
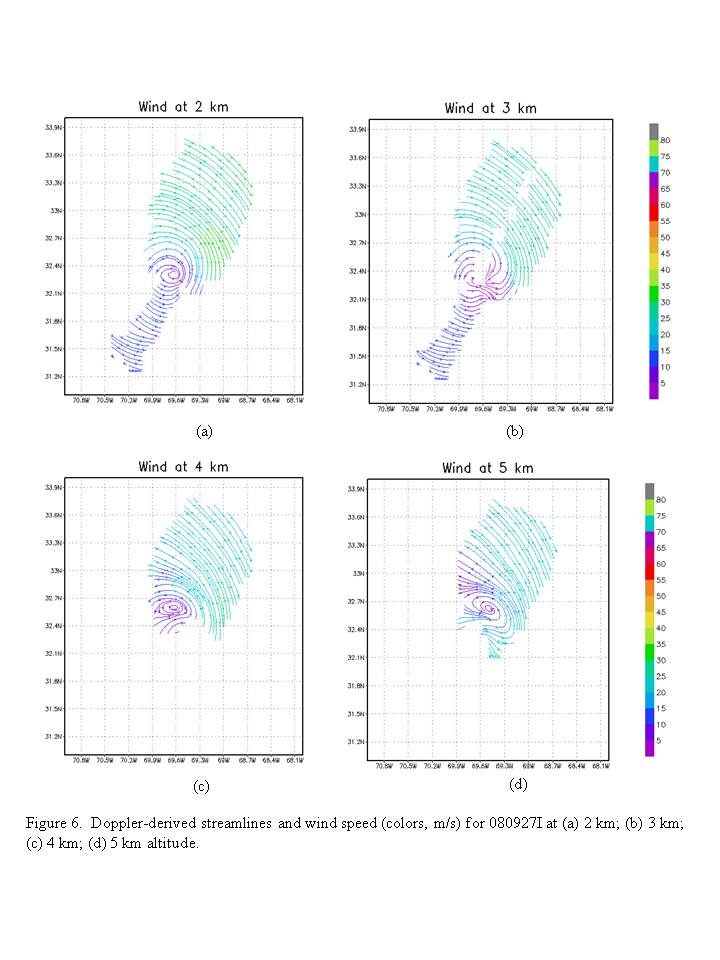
700 hPa (Fig. 5). This was supported by radar
analyses as well (Fig. 6).
The flight track was flown as planned, with the southeast and west legs cut
short because of asymmetries in the distribution of scatterers. Some strong
vertical motions were encountered on the northeast side, where an MCS was
located. Significant choppiness was encountered on the east side of the storm,
which after inspection of Doppler analyses seemed to be caused by strong
vertical shear of the tangential wind, with an anticyclone at 6-7 km and below
and anvil sloping inward with height. The strongest SFMR winds were 62 kt on
the northeast side. Radar analyses showed peak winds of 70 kt at 500 m above
the surface on the northeast side.
Three good radar analyses were performed. The system was still asymmetric,
with precipitation on the northeast side of the storm, so there was limited
information on the west and south side. It was very broad, with a MSLP of 995
hPa. Analyses showed structures very typical of sheared systems, and very
different from classic tropical cyclones. This will be a very good case for
testing data assimilation methods in sheared systems.
Takeoff was at 1151 UTC September 27, landing was at 2002 UTC September 27. A
total of 7 drops were released.
Problems :
There were no problems today.
Robert Rogers
Mission Data :
Dropsonde plots
700 mb
850 mb
925 mb
1000 mb
surface
One second listing
NetCDF listing
Page last updated November 19, 2008
Return to Mission page.