Mission Summary
20080926I1 Aircraft 43RF
Disturbance 93 Tail Doppler Radar flight 2008
Scientific Crew (43RF)
| Lead Project Scientist | Rob Rogers |
| Radar Scientist | Sylvie Lorsolo |
| Dropsonde Scientist | Neal Dorst |
Flight Crew (43RF)
| Pilots | Barry Choy
Carl Newman
Amelia Ebhart |
| Flight Director | Paul Flaherty |
| Navigator | Ryan Kidder |
| Flt. Eng. | Joe Klippel
Dewie Floyd |
| Data Tech | Terry Lynch |
| Elec. Tech | Jeff Smith
Damon San Souci
|
Mission Plan :
Fly TDR mission into TS Kyle, which has intensified from AL93. Fly butterfly
pattern, with the initial point on the southwest side. Fly 90 nm legs on the
west and south side, and 105 nm legs on the north and east sides to better
sample the convection. Fly at 10,000 ft for the whole pattern. Drop sondes
at end points, at least once in the center. Do an informal fix at 12 UTC for
NHC.
Mission Summary :
| Take off
| Landing
| MacDill AFB, FL | 13:20 UTC
| MacDill AFB, FL | 0: UTC
| |
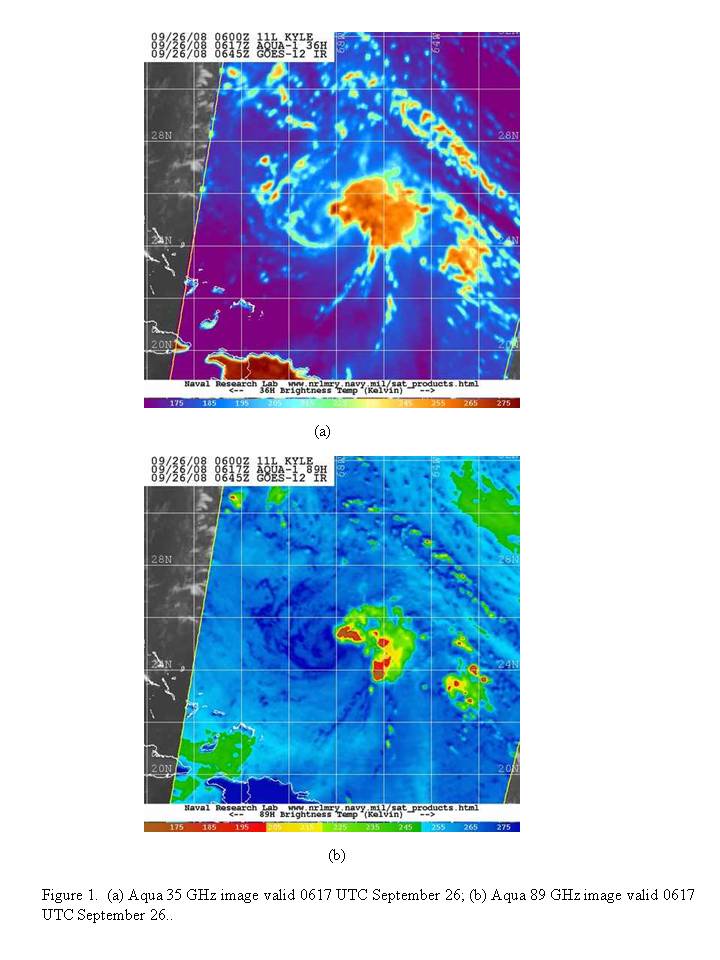
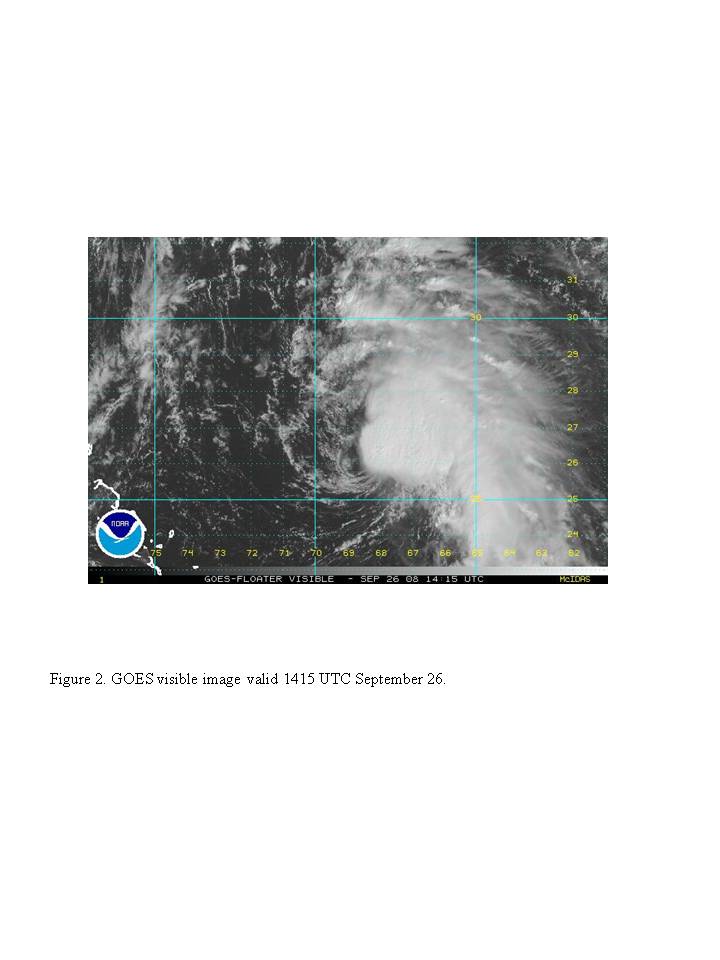
Kyle is still experiencing vertical shear, and the bulk of the precipitation
remains on the east side of the low-level circulation center
(Fig. 1, and
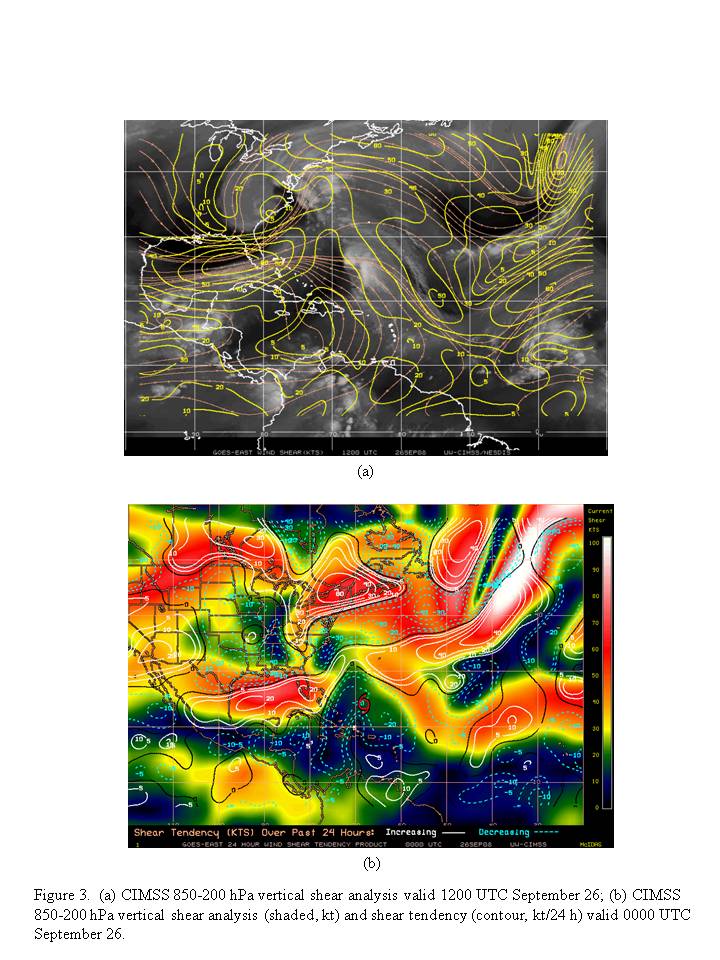
Fig. 2). The shear is starting to relax, though, and is forecast to
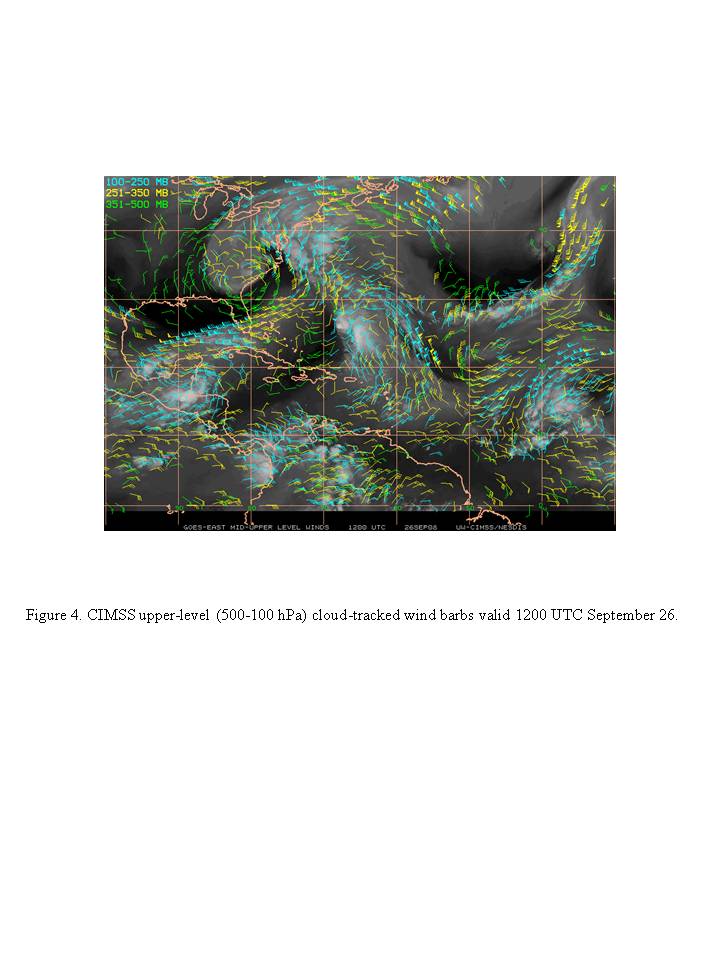
continue to weaken (Fig. 3). Satellite images
show some convection developing closer to the center than previously.
Upper-level winds (Fig. 4) show a pronounced
jet of upper-level westerlies in the eastern Gulf of Mexico, but over Kyle
winds are relatively weak.
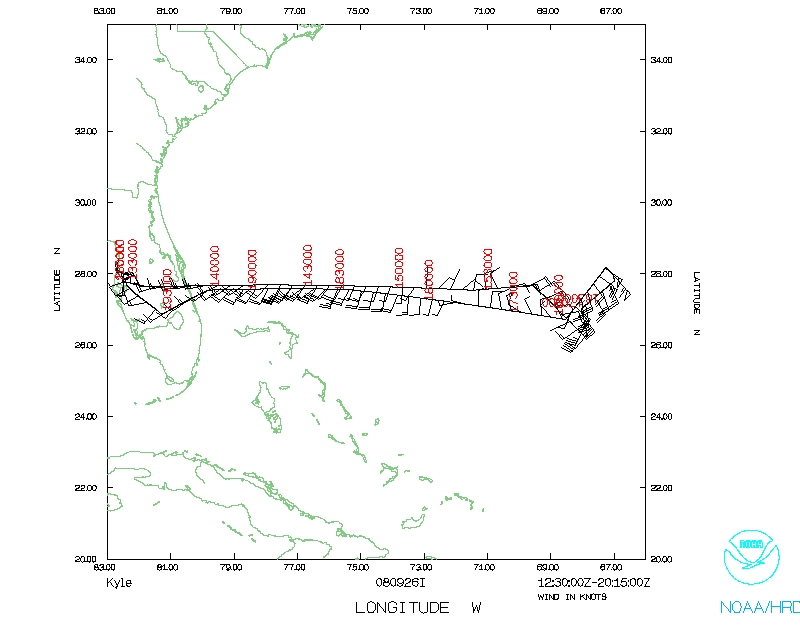
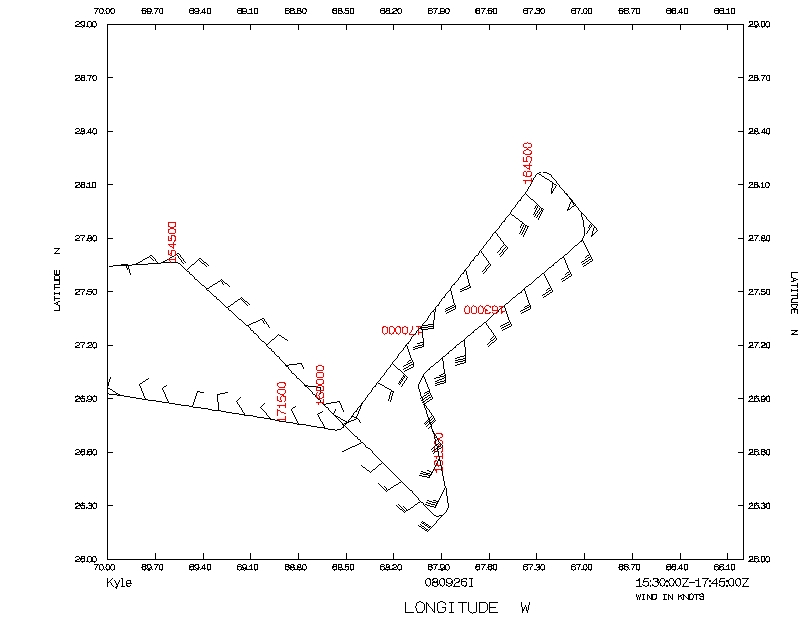
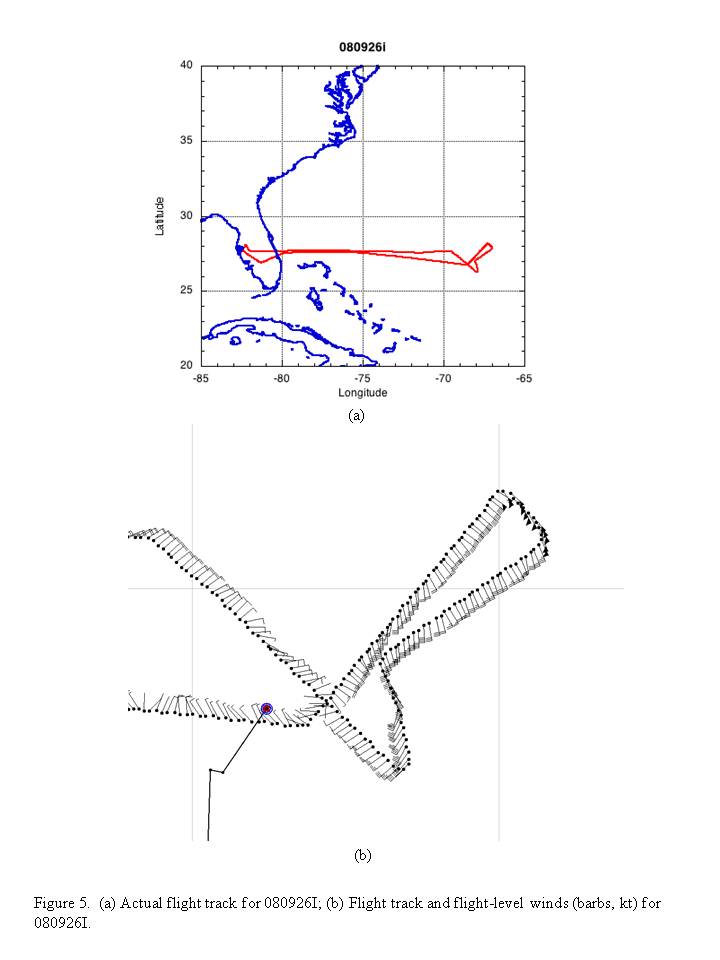
There was a significant delay (4.5 h) in takeoff due to electrical problems on
the aircraft, so the flight track had to be modified to a single figure-4
(Fig. 5a) with the initial point on the
northwest side. As indicated from satellite imagery, precipitation remained
displaced from the low-level circulation center. As a result, the downwind
leg on the east side of the storm was extended to better sample the
precipitation. On the inbound leg from the northeast to southwest, encountered
both stratiform and convective precipitation. Indications from the
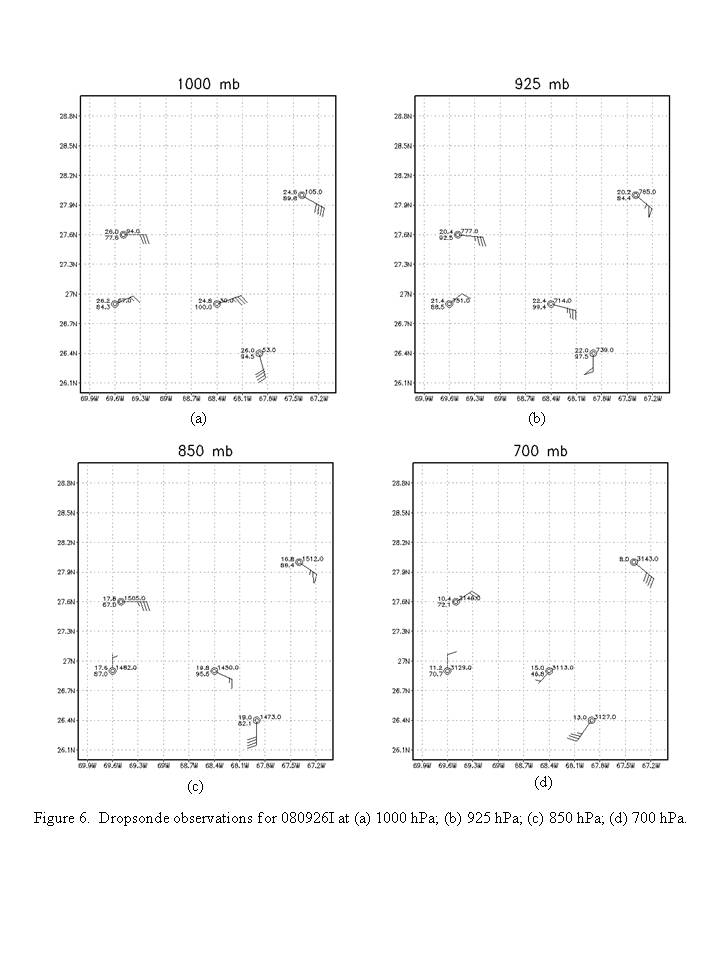
flight-level, dropsonde (Fig. 6), and SFMR
data are that the surface data was displaced to the southeast of the
flight-level center. The surface center was never sampled. Peak SFMR
winds were 50-55 kt on the northeast side, near hurricane strength. There
were some areas at flight level with 60-65 kt winds.
The flight had many challenges, beginning with the 4.5 h delay in takeoff,
which limited what could be done with the pattern. Mission could have been
cancelled, but it looked like system was getting better organized and we
wanted to be there for that organizational stage. The significant displacement
of precipitation from the center, along with limited time available in pattern
and erroneous estimate of low-level circulation center and no radar signature
on lower fuselage imagery, combined to limit the effectiveness of the radar
sampling. It is not clear how much this radar data can help to document
structure and evolution of a slowly-intensifying vortex in westerly shear.
Five drops were released. Takeoff was at 1320 UTC September 26.
Problems :
Other than the 4.5 h delay, there were no problems.
Robert Rogers
Mission Data :
Dropsonde plots
700 mb
850 mb
925 mb
1000 mb
surface
One second listing
NetCDF listing
Page last updated February 25, 2008
Return to Mission page.