
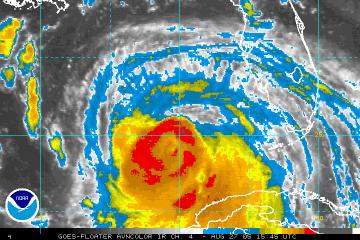
Figure 1. Four panel figure of GOES-Infrared imagery (valid 0315 UTC August 27) and TRMM TMI microwave 85 GHz emissivity (valid 0420 UTC August 27).
| Rob Rogers | LPS |
| John Gamache | Radar |
| Brad Smull (UWash) | Cloud Physics |
| Mike Silah, Tom Strong | Pilots |
| Joe Kippel | Flight Engineer |
| Devon Brakob | Navigator |
| Barry Damiano, Martin Mayeaux | Flight Directors |
| Terry Lynch, Damon San Souci, Bill Olney | Engineers |
NHC-tasked SFMR/Fix mission into Hurricane Katrina, fixes at 15, 18, and 21 UTC. The NOAA P3 will leave MacDill AFB,FL at 09:30 AM EDT. Katrina is a Category 3 storm now, with broad rain shield on east side of storm. Set IP 105 nm northeast of center and conduct rotating figure-4Ős. On the second downwind leg, modify the track a little bit to parallel the inner edge of the rainband. Coordinate with the NRL P-3 during this leg. Fly at 10,000 ft. and recover at MacDill AFB, FL at 6:00 PM EDT.
Mission Summary :
Today was an NHC-tasked mission for a combination of SFMR/fix responsibilities for 15, 18, and 21 UTC into Hurricane Katrina with N43RF. Katrina had moved across the southern tip of Florida the day before and was now out over open water in the southeastern Gulf of Mexico. The storm had a central pressure of 942 hPa at the time of takeoff for N43RF at 1330 UTC. Infrared and microwave imagery (Fig. 1) showed an eyewall with maximum convection on the south side and a principal rainband spiraling out of the center from the northeast to the southeast side of the storm. Shear over the system (Fig. 2) was generally light, though there was some shear from the north associated with the strong ridge that had persisted over Florida and was now retrograding to the west. It was this shear pattern that was thought to be largely responsible for the concentration of rainbands on the east side of the storm.
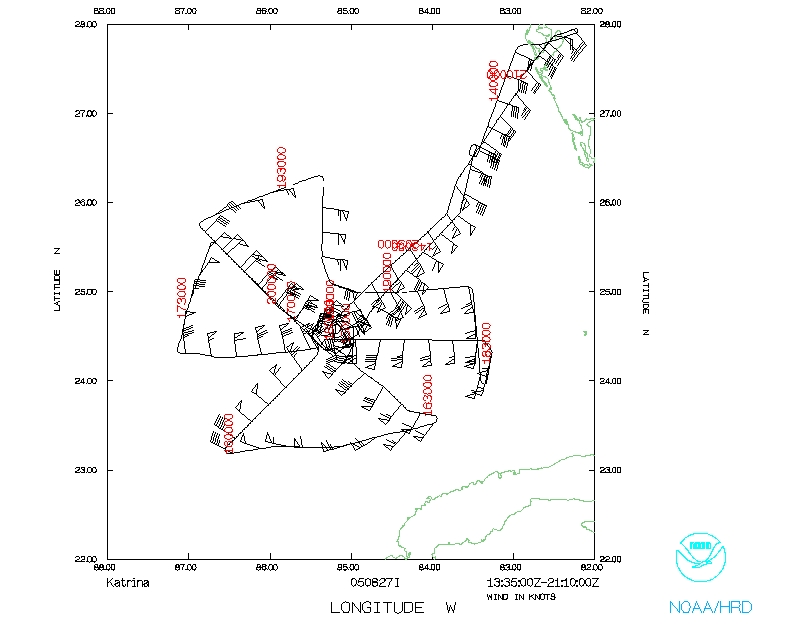
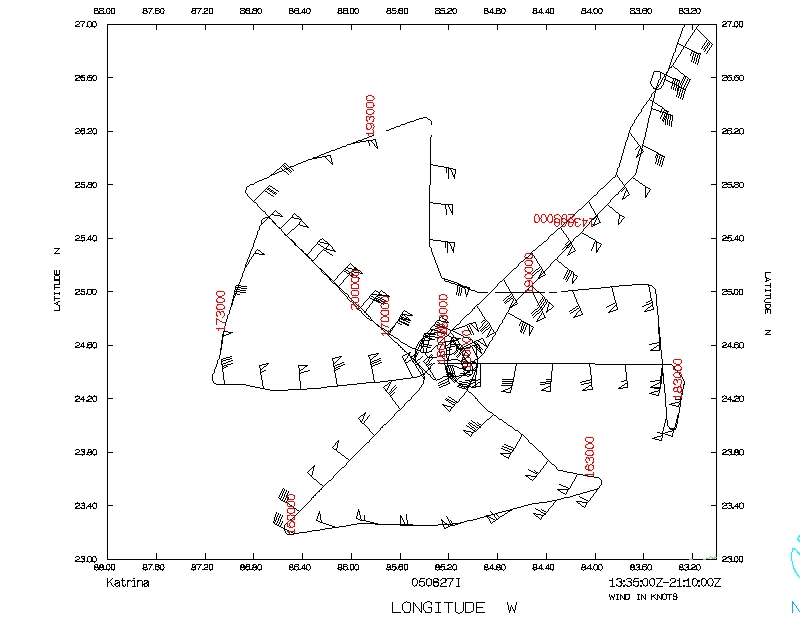
The plan called for N43RF to conduct a rotating figure-4 survey pattern, with the initial point set up 80 nm northeast of the center of the storm (Fig. 3). After the third penetration, on the outbound leg toward the east, N43RF would link up with the NRL P- 3
to coordinate on the rainband in the northeast quadrant of the storm. Both aircraft would fly on the outside of this band, with NRL trailing N43RF by about 5-10 nm. Shortly after takeoff at 1335 UTC WSR-88D imagery from the Key West radar (Fig. 4) showed widespread areas of mixed convective and stratiform rainbands on the east side of the storm. Lower fuselage radar imagery from N43RF (Fig. 5) showed a concentric eyewall pattern for Katrina. The inner eye had a diameter of about 10 nm while the outer eye had a diameter of about 50 nm. This pattern was also seen in infrared satellite imagery (Fig. 6), which showed the double-eyewall structure, with the inner eyewall evident as a very small area of cold cloud tops on the southeast side of the eye.
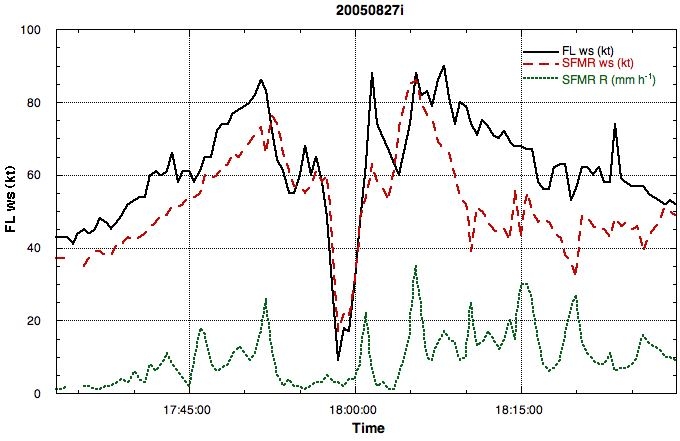
Within the eye on the first pass, it was clear that the inner eyewall was beginning to disintegrate and the outer eyewall was becoming the primary eyewall. Peak flight-level winds on the northeast side of the storm were about 85 kt, while the peak surface winds were about 80 kt. The outer eyewall on the northwest side was open, based on lower- fuselage radar. On the southwest side of the outer eyewall peak flight-level winds were 80 kt and peak surface winds were 70 kt. The central pressure from a fix at 1513 UTC was 949 hPa, measured from a GPS dropwindsonde.
As the aircraft turned downwind to the southeast side of the storm, LF imagery showed multiple lines of isolated convective cells, separated by about 15 nm. Moderate turbulence was associated with these bands, as the aircraft at one point hit a 10 m/s updraft. On the ensuing inbound leg on the southeast side of the storm, the maximum flight-level winds were 100 kt while the maximum SFMR winds were 95 kt, both
associated with the outer eyewall. Once N43RF reached the east side of the storm, a period of coordination was planned between N43RF and the NRL P-3 (cf. Fig. 33). The two aircraft were going to fly a coordinated leg along one of the rainbands seen in the northeast section of the storm. While on this leg, N43RF would drop sondes with an average spacing of about 20-30 km. The coordination between the two aircraft was moderately successful. The tracks of the two aircraft were separated by about 50-75 km (Fig. 7) around an outer rainband that was spiraling around to the north side of the storm. The NRL P-3 was on average about 10-20 km behind N43RF, but this is not a problem. The tail radar measurements of the rainband as well as the dropsonde measurements should prove to be useful data.
On the final inbound leg on the northwest side of the storm, the eyewall was still open on this side of the storm. The minimum sea-level pressure from this pass from a GPS drop was about 945 hPa, indicating that the storm was beginning to intensify slowly. The aircraft landed at 2108 UTC. All in all it was a successful mission. The SFMR worked well, with minimal noise, the Doppler radar analysis products were produced and transmitted in near-real time, dropsondes worked fine, and cloud physics data were collected.
Problems :
There were no major problems. All of the instruments worked well. The radars intermittently went out, but they were up for a majority of the time. The LF transmission was reliable.
Robert Rogers
9/1/05
Mission Data :
Flight Data | ||
 Flight track |
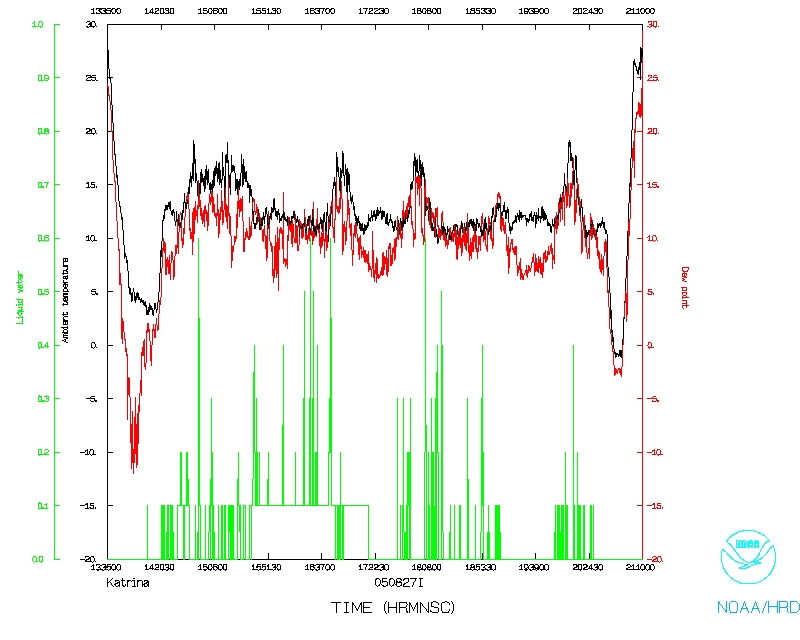 Temperature and Moisture |
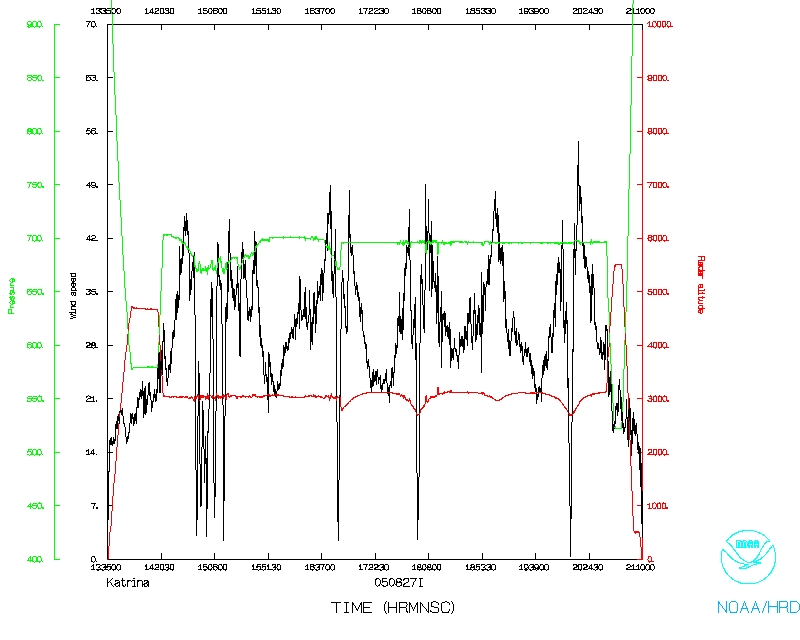 Wind and Atlitude |
 Flight track detail |
||