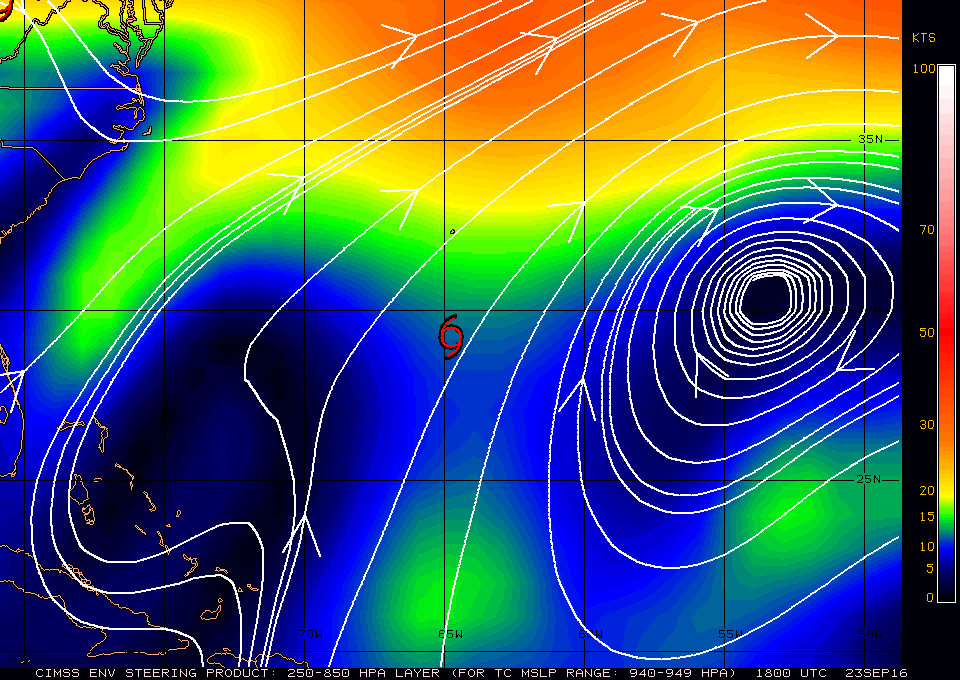
 15Z Steering current |
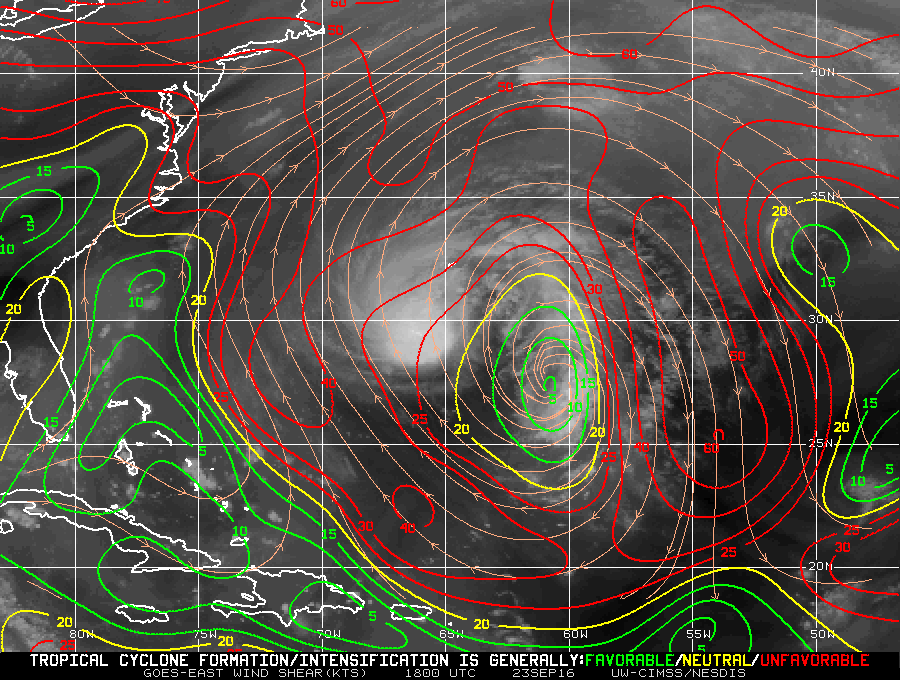 15Z Shear analysis |
| Aircraft Commander | Scott Price |
| Co-pilot | Danny Rees |
| Co-pilot | Nate Kahn |
| Navigator | Pete Siegel |
| Flight Engineer | Ken Heystek |
| Flight Director | Brian Belson |
| Flight Director | Ian Sears |
| Data Technician | Dana Naeher |
| Dropsonde Operator | Bobby Peek |
| Dropsonde Operator | Jeff Hartberger |
| LPS/DWL | Lisa Bucci | HRD |
| Radar | Brad Klotz | HRD |
| Drops | Hui Christophersen | HRD |
| Ocean Winds | Joe Sapp | NESDIS |
| Radar | John Gamache | HRD |
Mission Plan :
|
15Z Steering current |
15Z Shear analysis |
The mission is to conduct a RAPX experiment into Tropical Storm Karl. The storm is at 50kts traveling N at 10-15kts about 750 miles away from St. Croix (Figure 1). Convection is centered over the low level center with a band stretching out to the east. Shear is analyzed at SE 15-25 knots (Figure 2). Track guidance show Karl continuing north before turning NE to the North Atlantic (Figure 3) possibly strengthen to a category 1 hurricane before becoming fully extratropical (Figure 4).
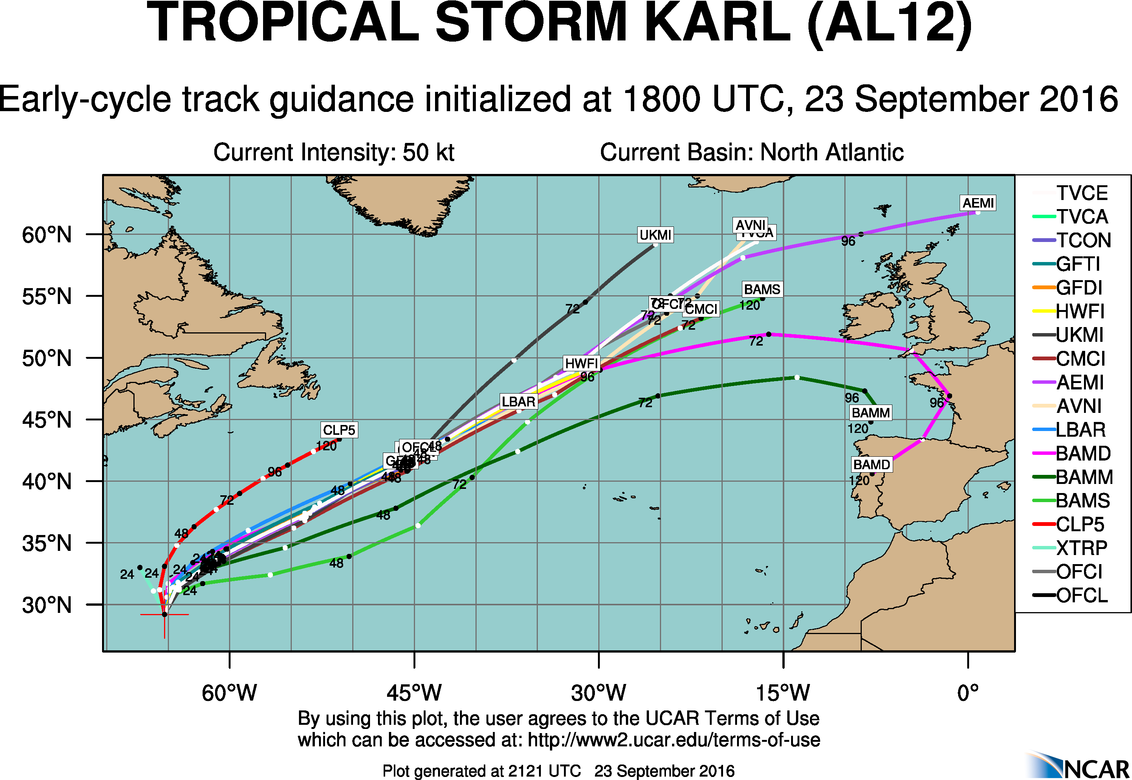 12Z Track forecasts |
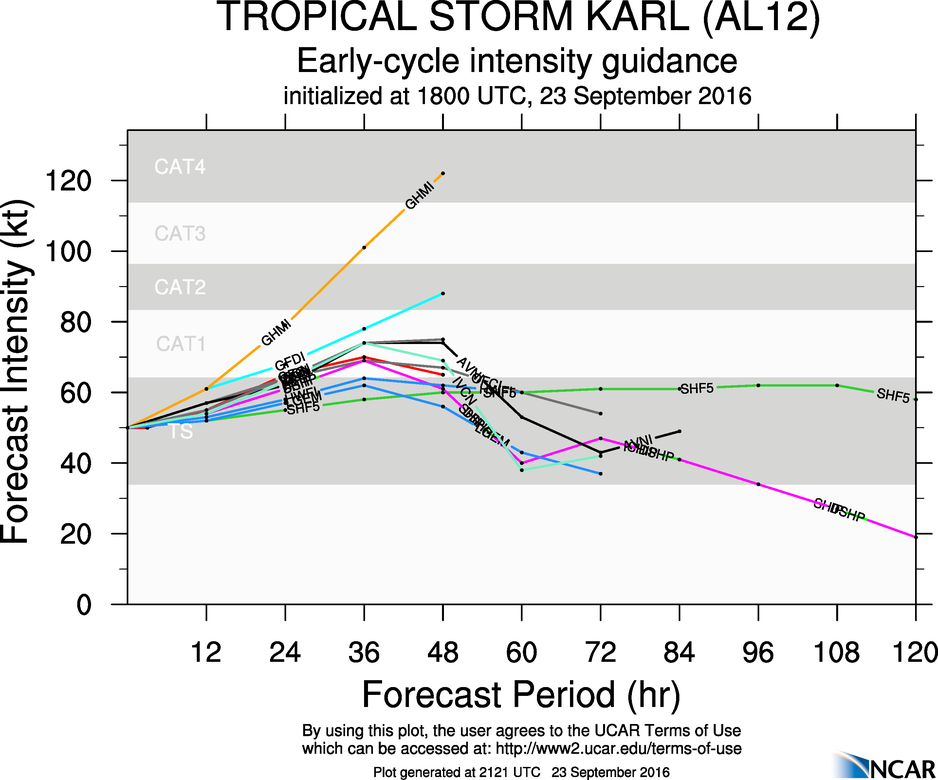 12Z Intensity forecasts |
|
Prepared by the Hurricane Research Division File: current1.ftk September 21, 2016 Aircraft: N43RF Proposed takeoff: 23/1800Z
DROP LOCATION TABLE
| #
| LAT
| LON
| RAD/AZM
| Time
|
| deg min
| deg min
| n mi/deg
| hr:min
| 1S | 27 03 | 65 06 | 105/180 | 1:44
| 2S | 30 33 | 65 06 | 105/000 | 2:40
| 3S | 29 41 | 66 50 | 105/300 | 3:08
| 4S | 27 56 | 63 23 | 105/120 | 4:03
| 5S | 29 41 | 63 22 | 105/060 | 4:31
| 6S | 27 56 | 66 49 | 105/240 | 5:26
| | ||||||||||||||
| Take off | Landing
| St. Croix, USVI
| 18:00 UTC
| St. Croix, USVI
| 02:00 UTC
| | ||
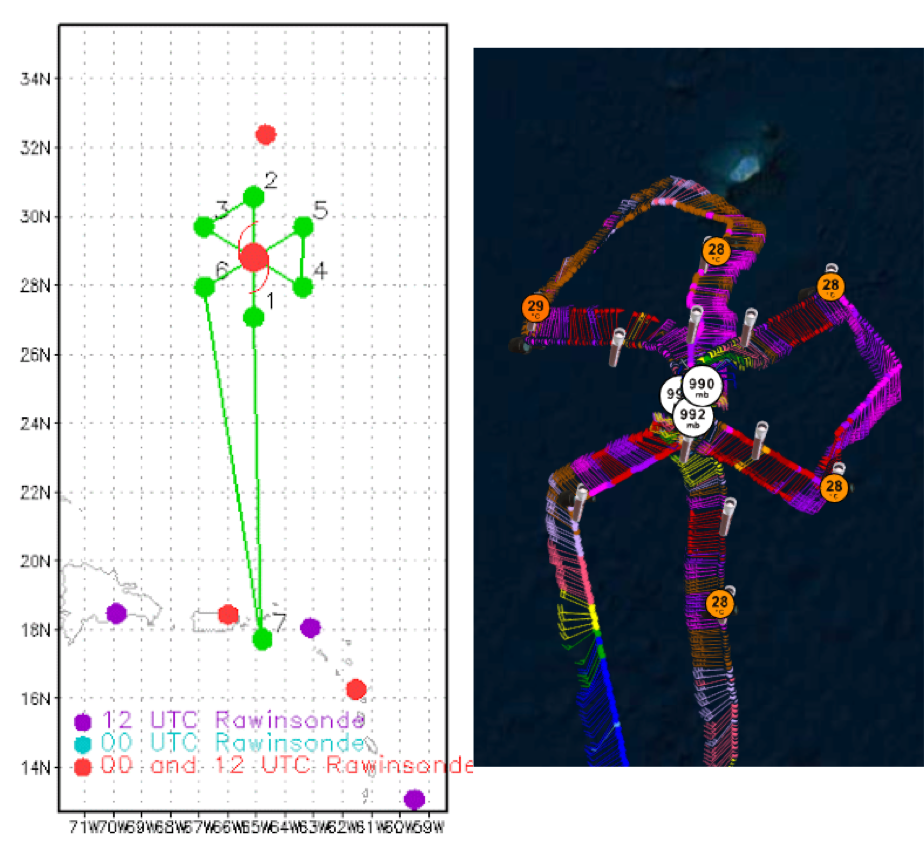 Proposed and Actual flight tracks |
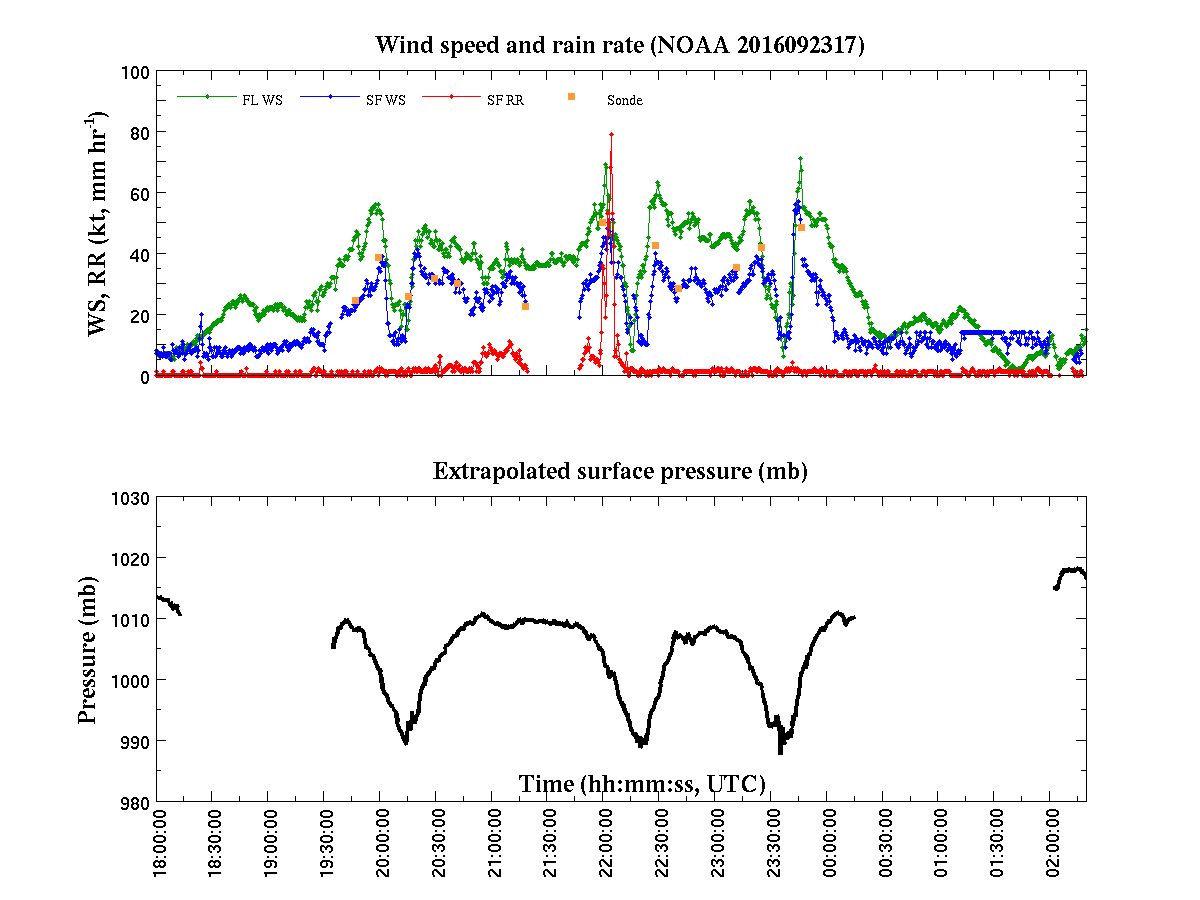
The butterfly pattern was completed as planned (Figure 5b). Karl continued to travel north at about 10 knots. IR satellite imagery shows a convective burst in the NW quadrant where the radar indicated the strongest winds were located (Figure 6). Shear appears to still be keeping the south and east drier as indicated by dropsodes. The radar analysis shows the strongest winds were on the SE side of Karl (Figure 7). Peak flight level winds were 70 knots and SFMR reached 58 knots in the south. The strongest surface winds from a dropsonde were found on drop 7 with 56 knots. The SFMR high incidence module was performed on the west side out of precipitation. Three banked turns were completed for each angle: 15, 30, and 45 degrees.
 IR satellite loop |
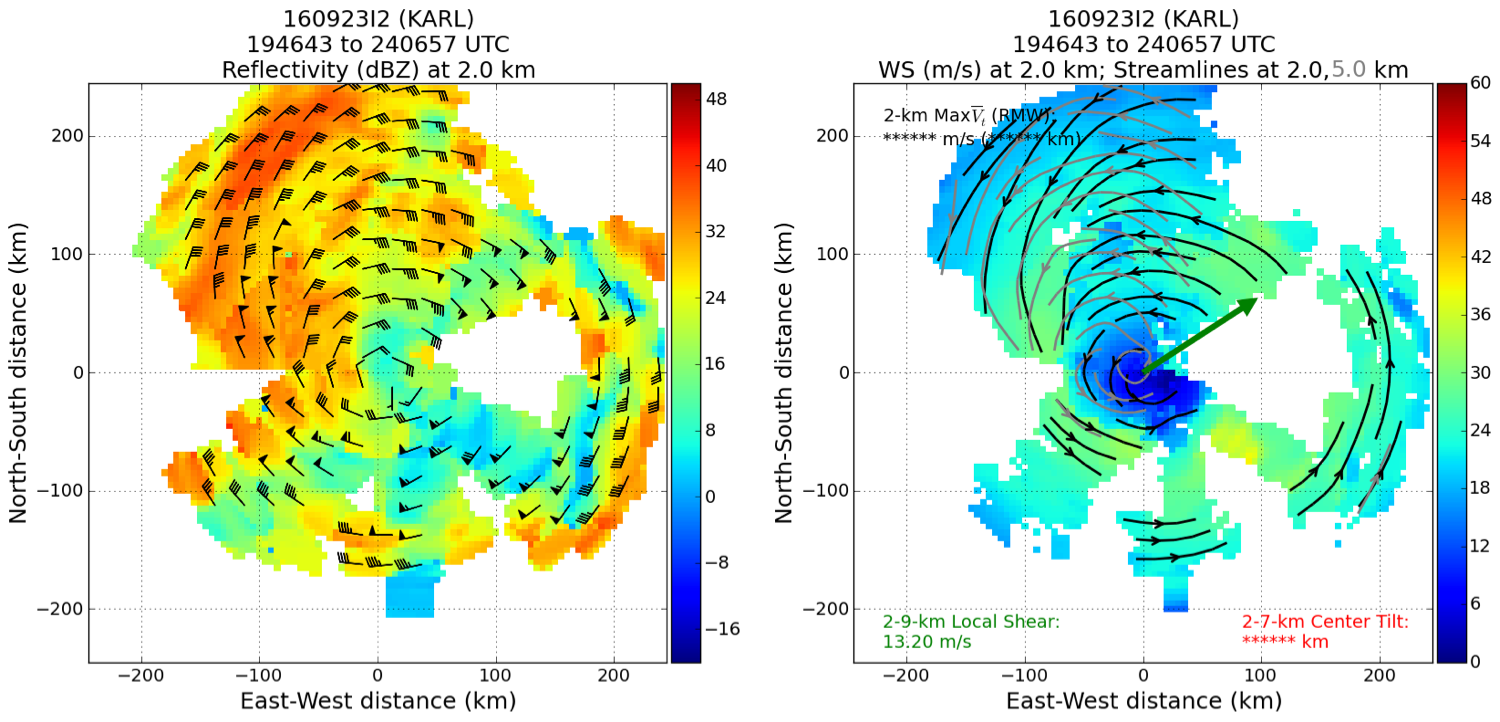 Radar analyses |
A total of 8 regular sondes, 5 IR sondes/AXBTs combos were dropped, 1 lone AXBT and 3 radar analyses were completed.
Mission Evaluation:
This RAPX mission was completed as planned. Three radar analysis were completed and the P3 maintained good radar coverage of TS Karl. While the high incidence module was performed, it may have been in too weak winds. Need to contact Heather Holbach to confirm whether the data was usedful.
Problems :
An externally mounted AXBT malfunctioned and was launched shortly after takeoff. It was replaced with an internally launched AXBT. Some of the AXBT data initially came in spotty.
 Final flight track |
||
Plot of raw High Density Obs |
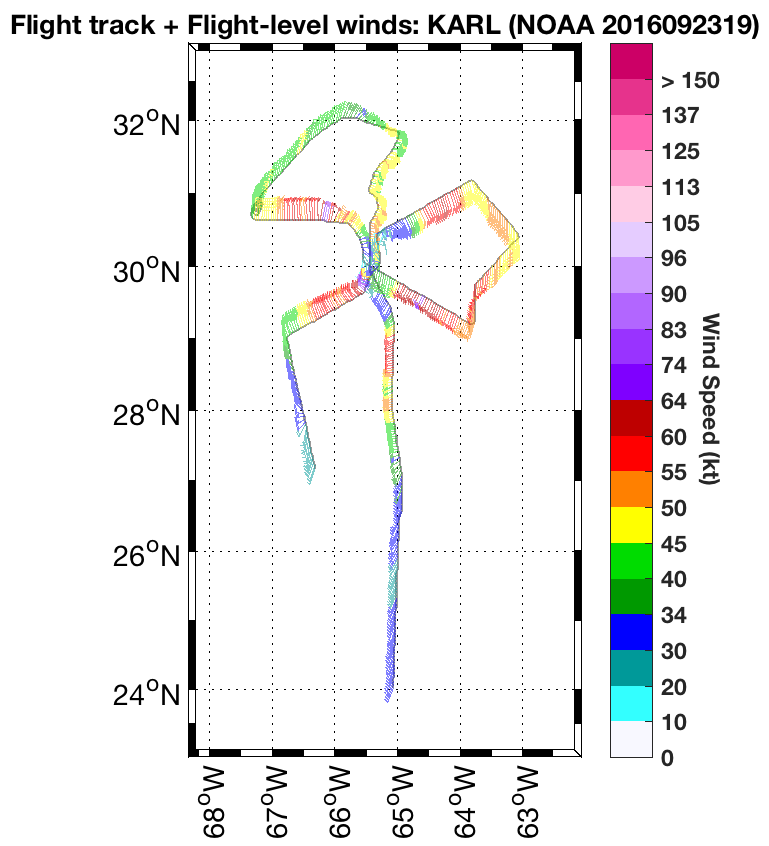
Plot of raw Flight Level winds |
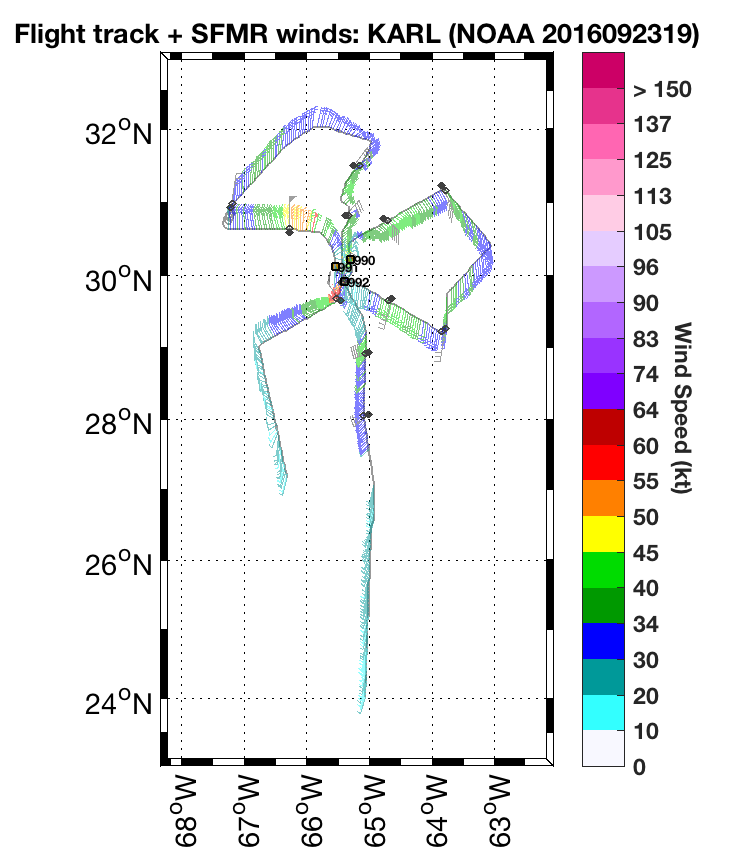
Plot of raw SFMR winds |
LPS's log | Radar Scientist's log | Dropsonde Scientist's log
Flight Director's log |
Flight Director's manifest |
NetCDF data
serial data