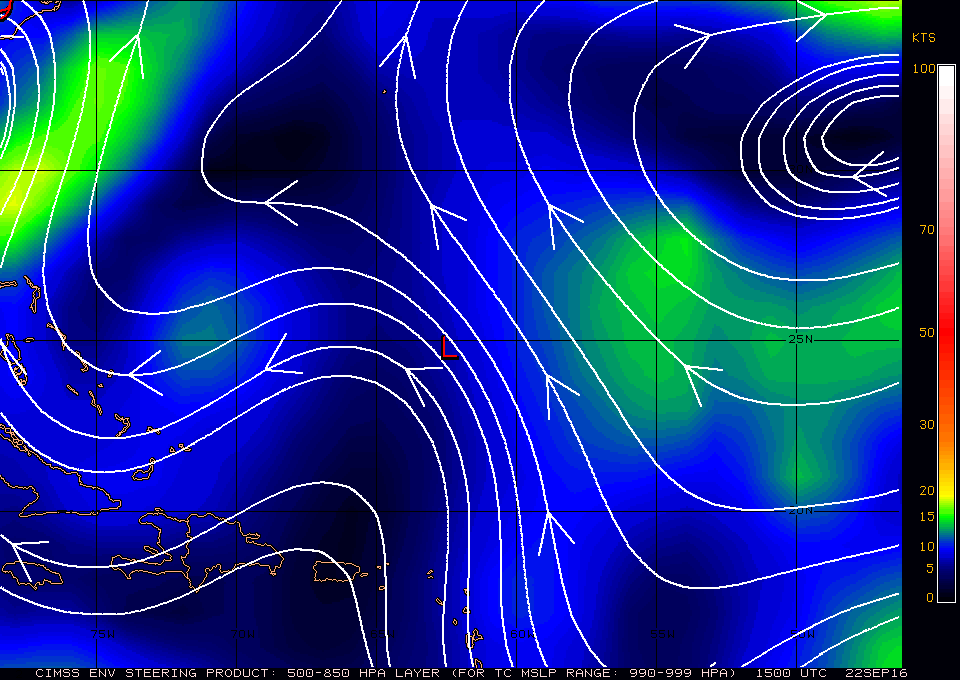
 15Z Steering current |
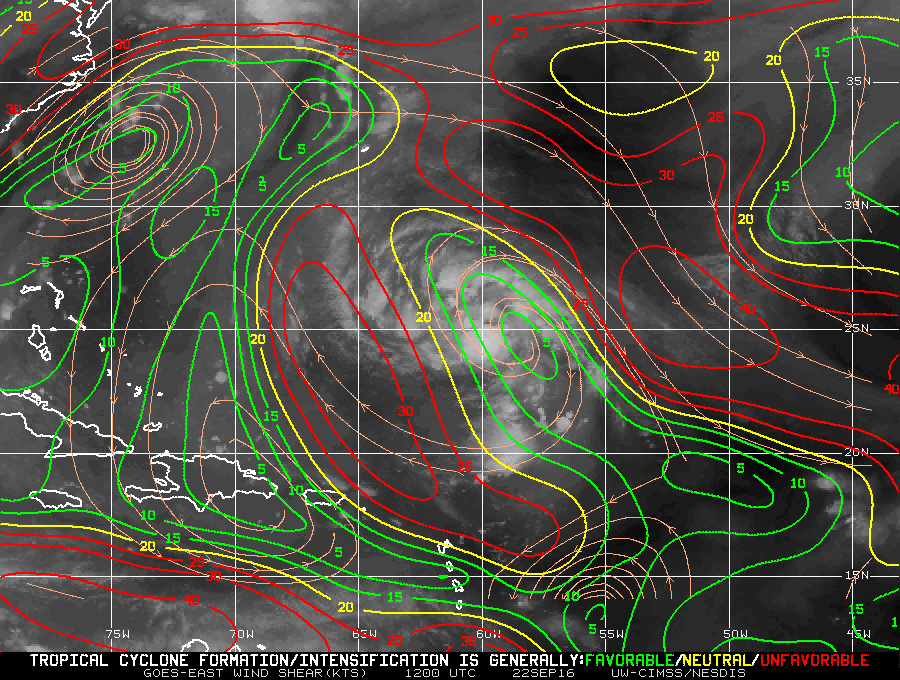 15Z Shear analysis |
| Aircraft Commander | Scott Price |
| Co-pilot | Danny Rees |
| Co-pilot | Nate Kahn |
| Navigator | Pete Siegel |
| Flight Engineer | Ken Heystek |
| Flight Director | Brian Belson |
| Flight Director | Ian Sears |
| Data Technician | Dana Naeher |
| Dropsonde Operator | Bobby Peek |
| Dropsonde Operator | Jeff Hartberger |
| LPS/DWL | Lisa Bucci | HRD |
| Radar | Brad Klotz | HRD |
| Drops | Hui Christophersen | HRD |
| Ocean Winds | Joe Sapp | NESDIS |
|
15Z Steering current |
15Z Shear analysis |
Mission Plan :
The mission is to conduct a RAPX experiment into Tropical Depression Karl. The storm is at 30kts traveling NW at 17kts about 400 miles north of St. Croix (Figure 1). A gradient of shear is analyzed at SE 15-25 knots with higher shear on the west side (Figure 2). Satellite presentation is disorganized with few cold cloud tops. Track guidance show Karl continuing NW before turning N possibly impacting Bermuda and then NE to the North Atlantic (Figure 3) possibly strengthen to a category 1 hurricane before becoming fully extratropical (Figure 4).
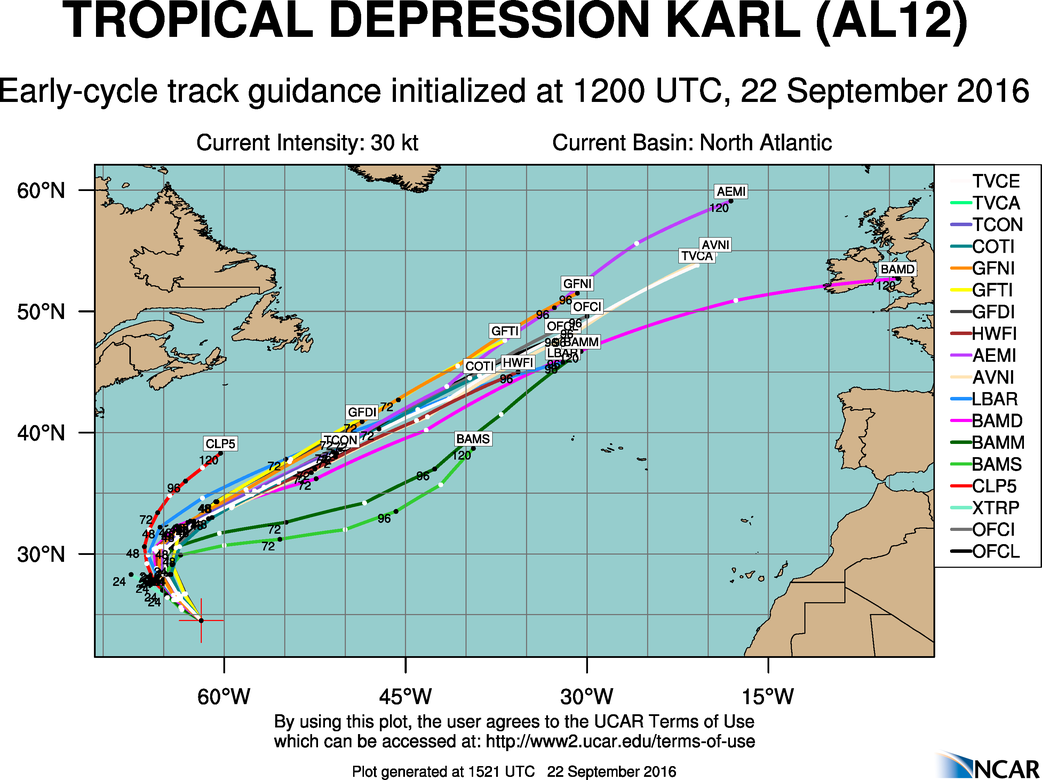 12Z Track forecasts |
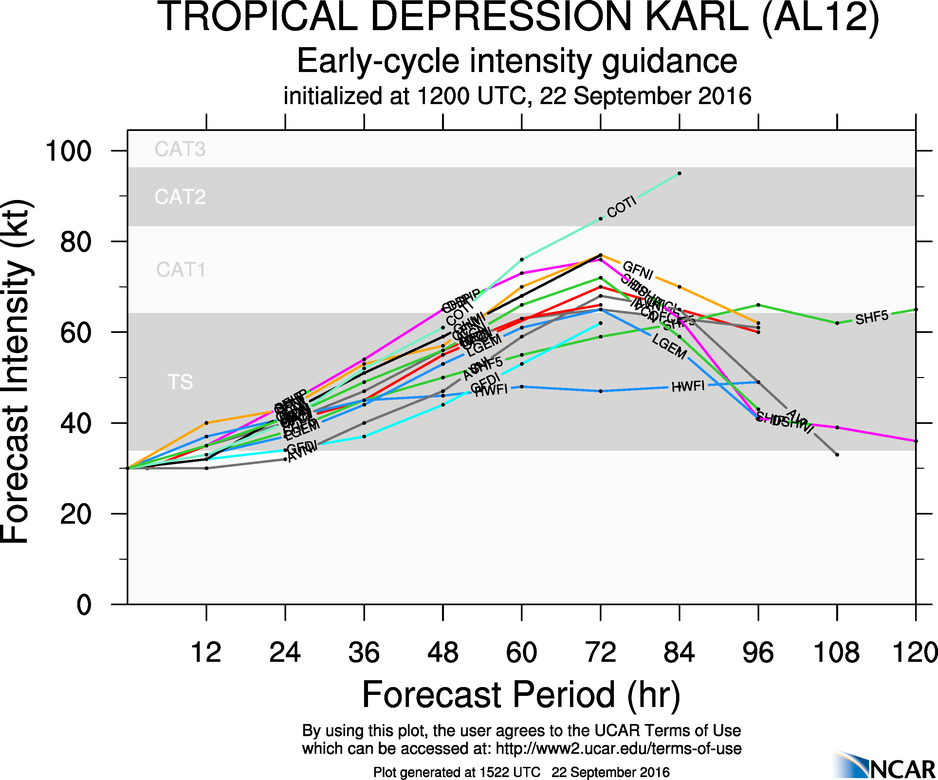 12Z Intensity forecasts |
The plan calls for a rotated Figure-4 pattern with flight altitude of 8000 feet radar, 90nm legs, and regular drops at the mid and off cardinal (diagonal) end points (Figure 5a). The plane will return to St. Croix after completion of the mission.
|
Prepared by the Hurricane Research Division File: current1.ftk September 21, 2016 Aircraft: N43RF Proposed takeoff: 22/1800Z
DROP LOCATION TABLE
| #
| LAT
| LON
| RAD/AZM
| Time
|
| deg min
| deg min
| n mi/deg
| hr:min
| 1S | 23 57 | 61 56 | 90/135 | 1:16
| 2S | 26 04 | 64 16 | 90/315 | 2:04
| 3S | 23 57 | 64 16 | 90/225 | 2:38
| 4S | 26 04 | 61 56 | 90/045 | 3:25
| 5S | 26 30 | 63 06 | 90/000 | 3:44
| 6S | 23 30 | 63 06 | 90/180 | 4:32
| 7S | 25 00 | 61 27 | 90/090 | 5:06
| 8S | 25 00 | 64 45 | 90/270 | 5:53
| | ||||||||||||||
| Take off | Landing
| St. Croix, USVI
| 18:00 UTC
| St. Croix, USVI
| 02:00 UTC
| | ||
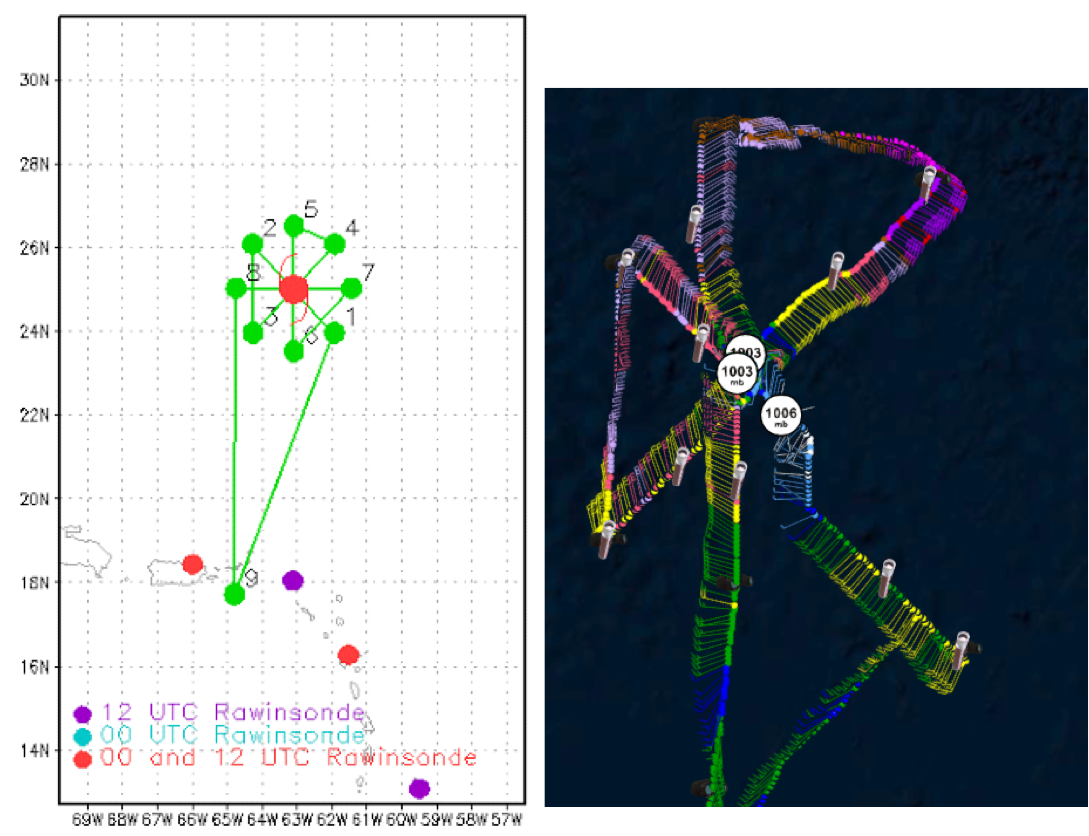 Proposed and Actual flight tracks |
The pattern was completed up until the N to S pass when it was terminated early due to a mechanical concern (Figure 5b). Dropped a center sonde on the first and third pass to find the pressure decreased by 4-5mb. Dry air in the south and west appear to be impacting the development of convection in those quadrants of the tropical cyclone. The radar analysis shows the strongest winds were on the NE side of Karl (Figure 6). Based on the radar analyses, the 2km and 5km vorticies appear to aligning. Peak flight level winds were 50 knots and SFMR reached 35 knots in the south. The strongest surface winds from a dropsonde were found in the NW on drop 4 with 30 knots.
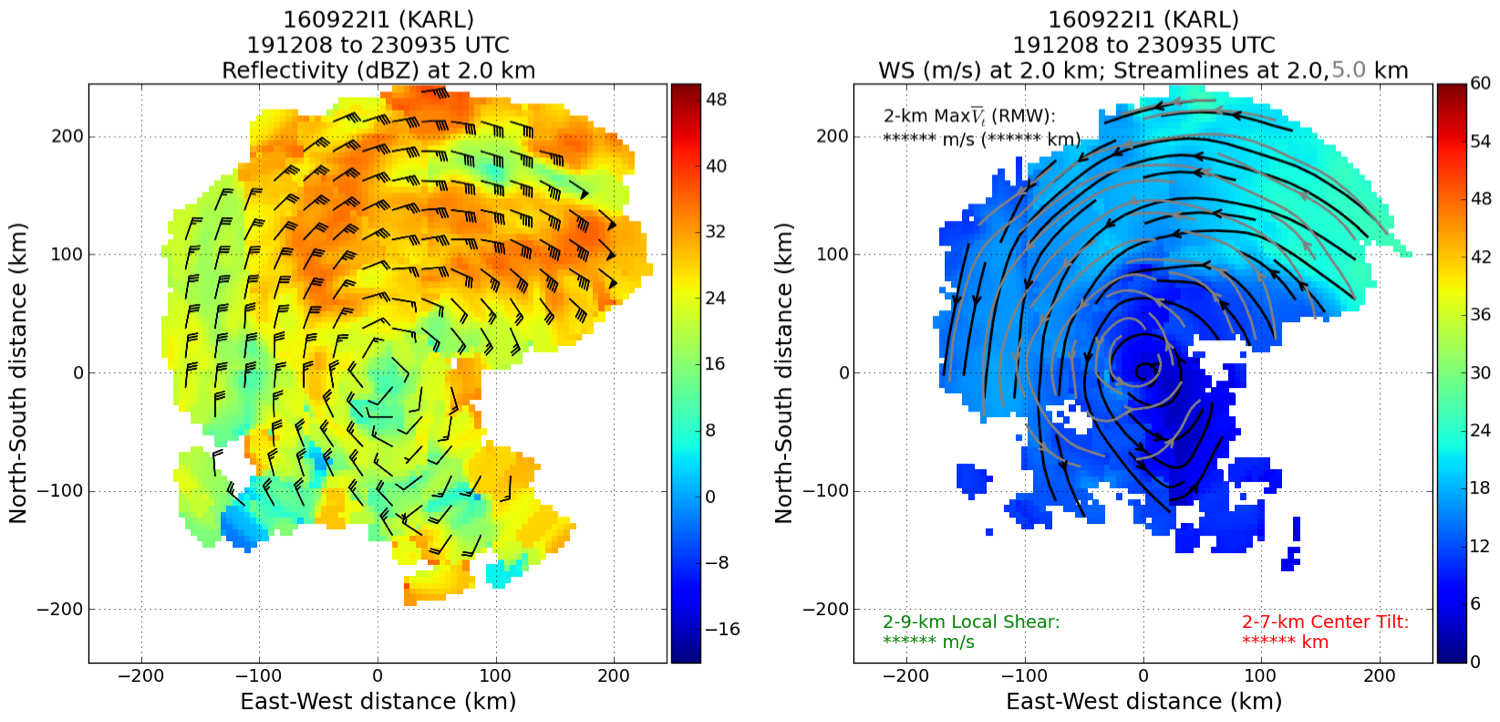 Radar Analyses |
A total of 12 regular sondes and 3 radar analyses were completed.
Mission Evaluation:
This RAPX mission was completed as planned. Three radar analysis were completed and the P3 maintained good radar coverage of TD Karl. Observations suggest there is decent potential for an intensification in the next few days (even a rapid intensification). Models seem to be having difficultly analyzing the complex shear structure as well as the impact of dry air on the system. Unfortunately the eastern portion of the storm was not observed where the winds were believed to be strongest.
Problems :
A cooling fan associated with IWRAP shorted and initiated a fire of unknown origin. The problem was isolated and the mission was cut short for safety concerns. The chain of communication was not followed during this event. In the future, all safety concerns need to be reported first by the Aircraft Commander before other passengers can discuss events.
AOC server was also up and down during the flight. Brad Klotz needed to process the radar on the plane instead of Gamache on the ground.
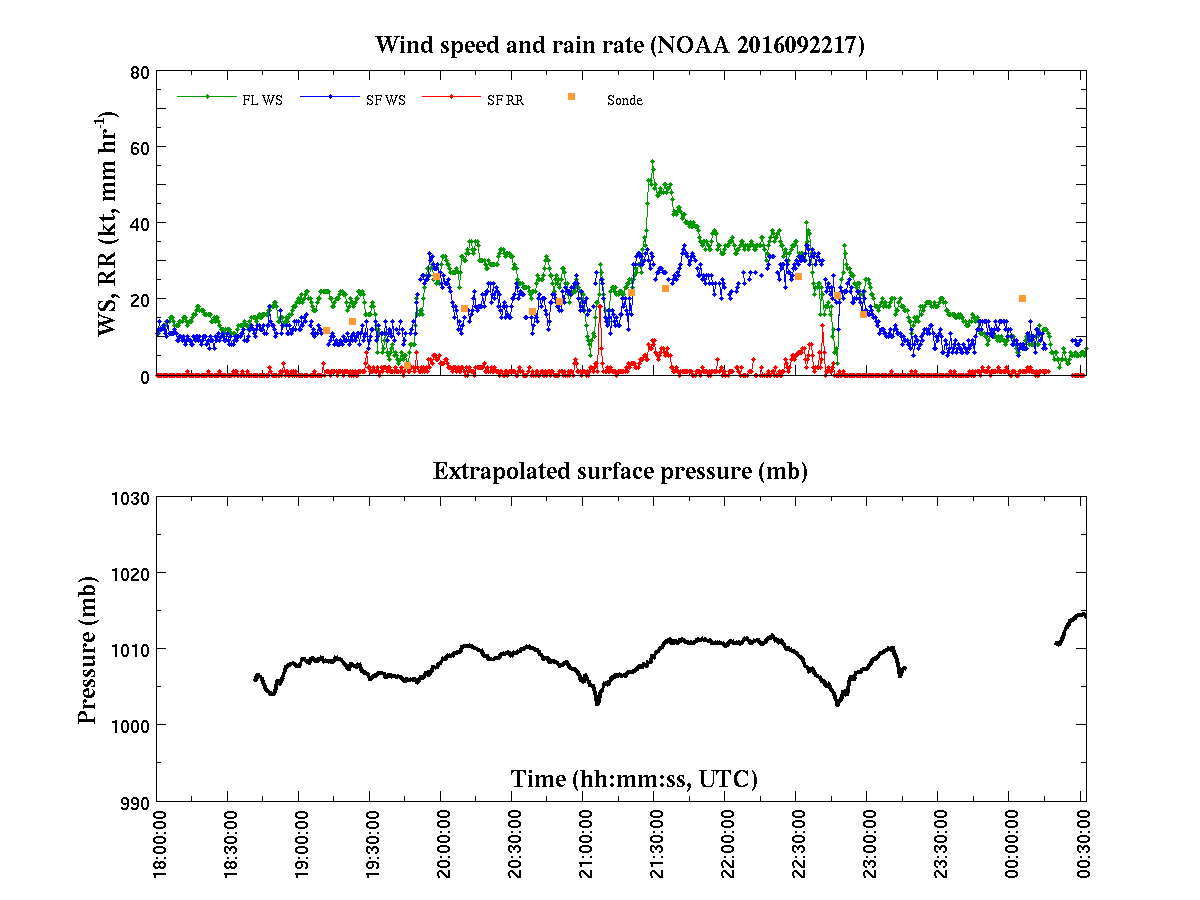
Plot of raw High Density Obs |
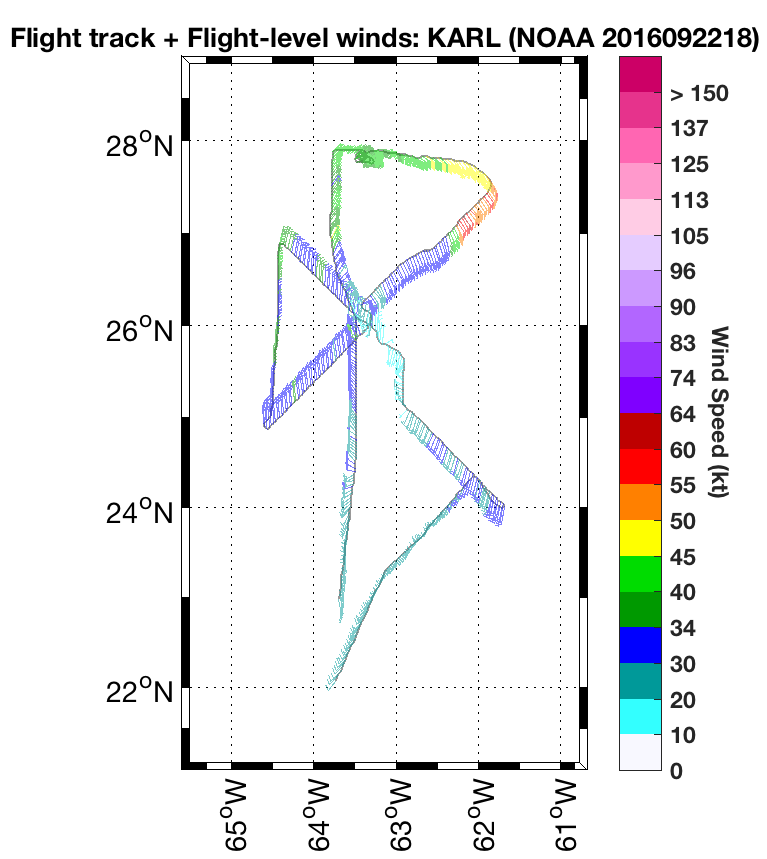
Plot of raw Flight Level winds |
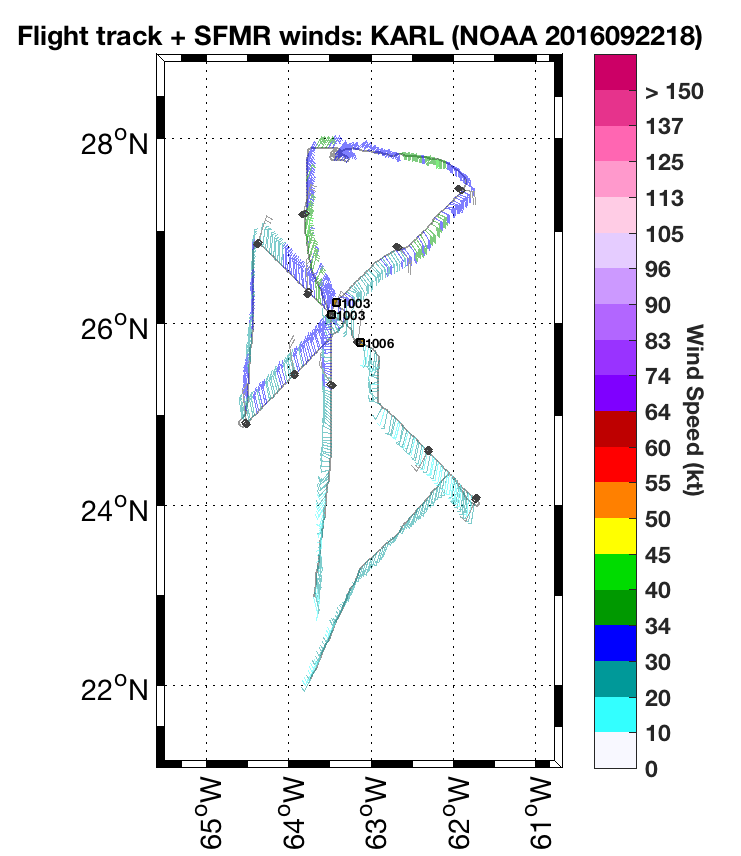
Plot of raw SFMR winds |