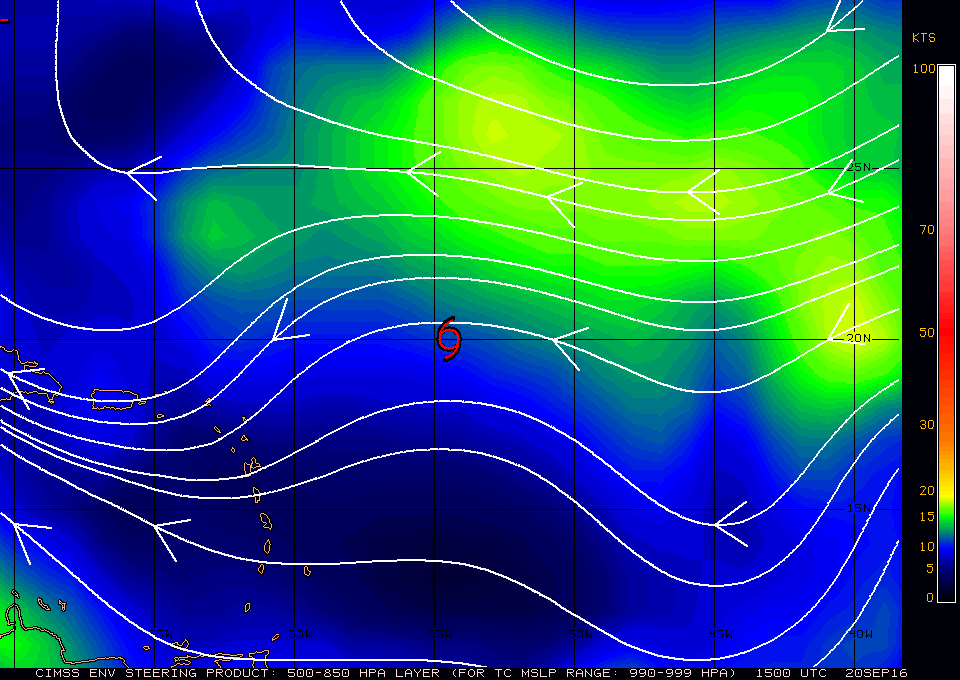
 Environmental steering currents 15Z |
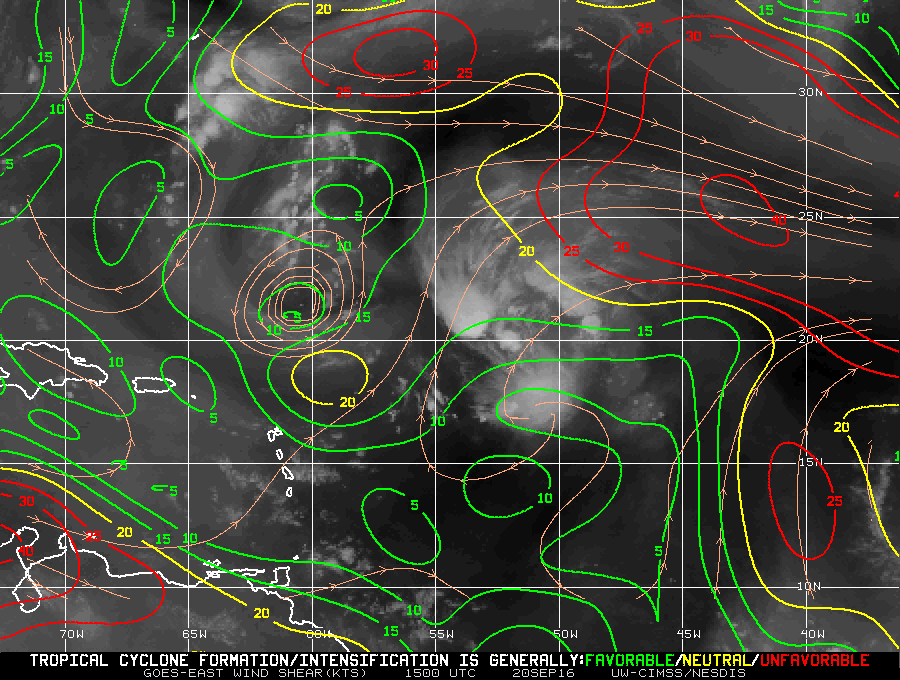 Shear Analysis 15Z |
| Aircraft Commander | Scott Price |
| Co-pilot | Danny Rees |
| Co-pilot | Nate Kahn |
| Navigator | Pete Siegel |
| Flight Engineer | Ken Heystek |
| Flight Director | Brian Belson |
| Flight Director | Ian Sears |
| Data Technician | Dana Naeher |
| Dropsonde Operator | Bobby Peek |
| Dropsonde Operator | Jeff Hartberger |
| LPS/DWL | Lisa Bucci> | HRD |
| Radar | Brad Klotz | HRD |
| Drops | Hui Christophersen | HRD |
| Ocean Winds | Joe Sapp | NESDIS |
| Radar | John Gamache | HRD |
Mission Plan :
|
Environmental steering currents 15Z |
Shear Analysis 15Z |
The mission is to conduct a RAPX experiment into Tropical Storm Karl. The 40kt, 1006mb system is located northeast of the Greater Antilles and moving West at about 15 knots (Figure 1). It is located east of an upper level lower which is creating some SSW shear analyzed at about 15 knots (Figure 2). Satellite presentation shows an exposed low-level center with convection displayed to the N and E and possible dry air to the west and south. Track guidance show Karl will continue to travel up west until turning north towards Bermuda in the next 4 days (Figure 3). Intensity forecasts show a potential rapid intensification of Karl in the next 24-72 hours (Figure 4).
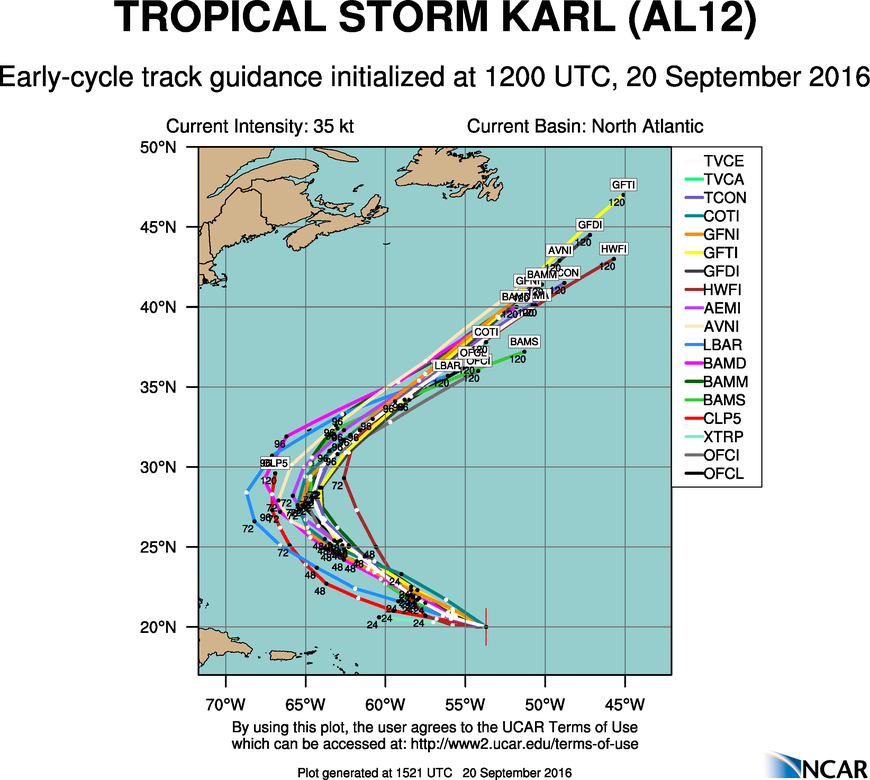 12Z Track forecasts |
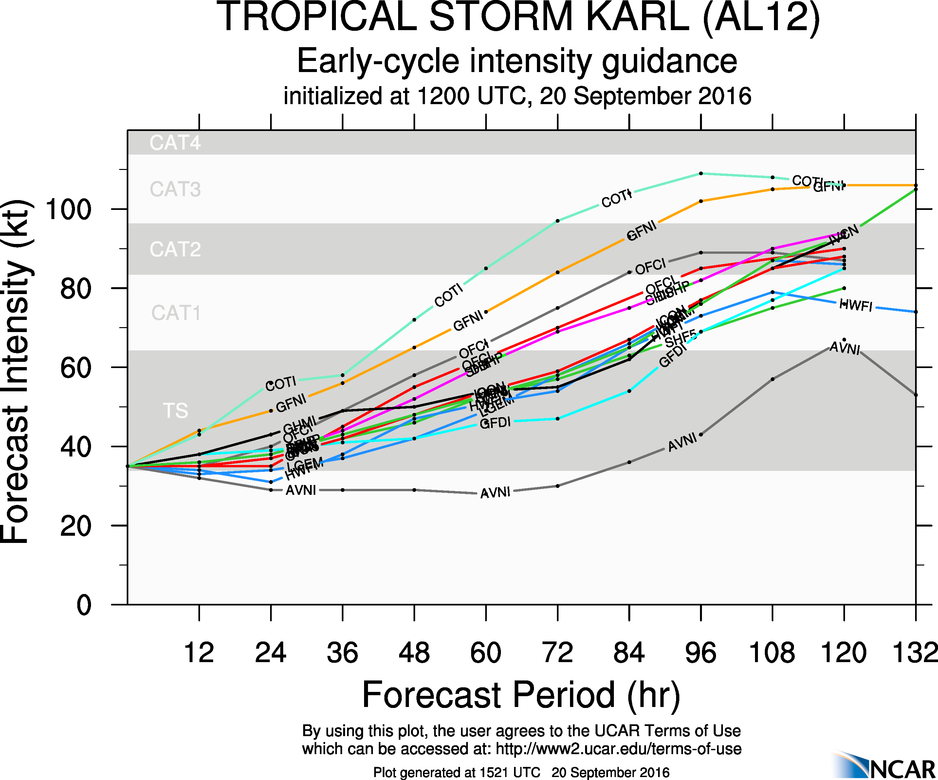 12Z Intensity forecasts |
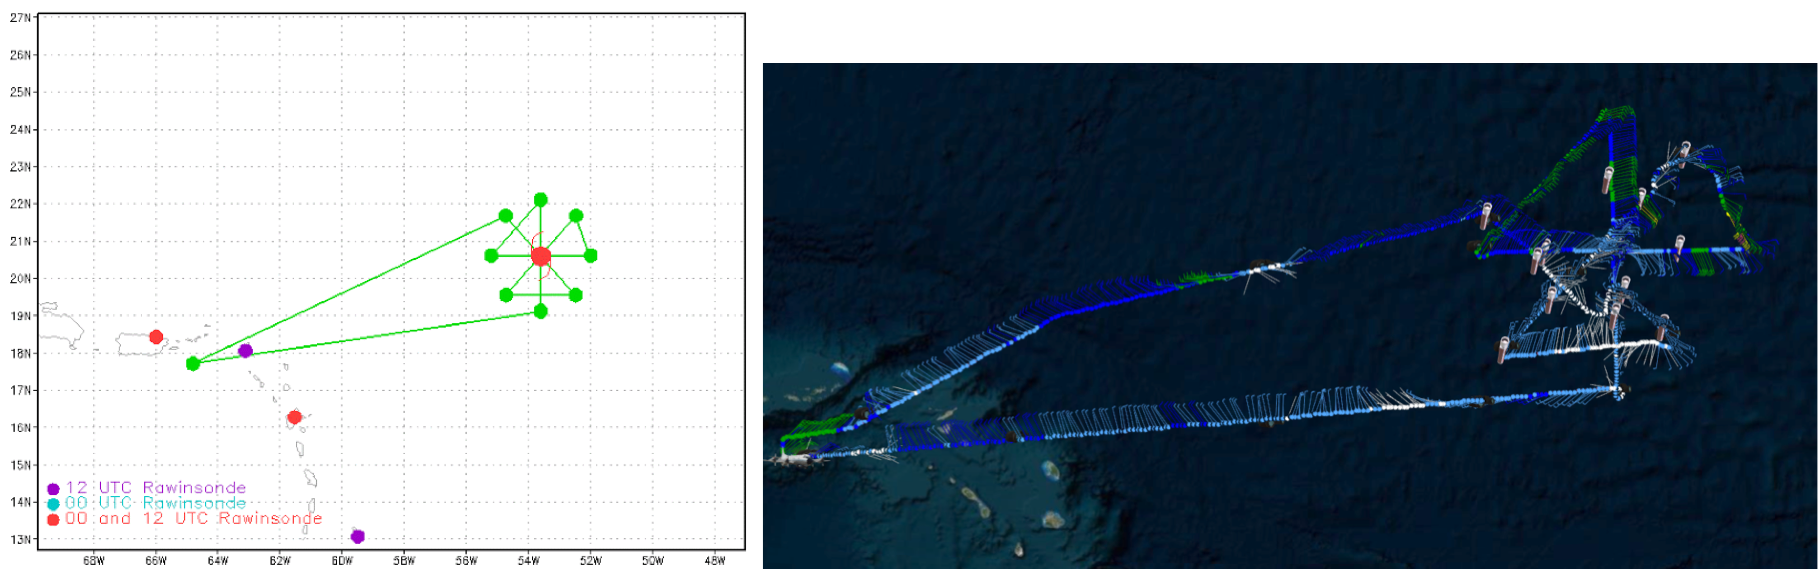
The plan is perform a rotated Figure-4 pattern to capture a symmetric coverage of the storm prior to RI with an initial point (IP) to the south (Figure 5a). Given the shallow depth of the storm, no flight level center fixes (10000 feet) will be performed. Instead, the pattern will be centered on the LLC using visible indicators. Upon completion of the mission to the east, the plane will return to St. Croix. This flight is concurrent with a G-IV synoptic mission. Therefore only sondes will only be dropped at the midpoints, on the non-cardinal direction end points, and once in the center.
|
Prepared by the Hurricane Research Division File: current1.ftk September 20, 2016 Aircraft: N43RF Proposed takeoff: 20/1800Z
DROP LOCATION TABLE
| #
| LAT
| LON
| RAD/AZM
| Time
|
| deg min
| deg min
| n mi/deg
| hr:min
| 1S | 19 06 | 53 36 | 90/180 | 1:59
| 2S | 22 06 | 53 36 | 90/000 | 2:45
| 3S | 20 36 | 55 12 | 90/270 | 3:17
| 4S | 20 36 | 52 00 | 90/090 | 4:03
| 5S | 21 40 | 52 28 | 90/045 | 4:21
| 6S | 19 32 | 54 43 | 90/225 | 5:07
| 7S | 19 32 | 52 29 | 90/135 | 5:39
| 8S | 21 40 | 54 44 | 90/315 | 6:25
| | ||||||||||||||
| Take off | Landing
| St. Croix, USVI
| 18:00 UTC
| St. Croix, USVI
| 02:00 UTC
| | ||
 Proposed and Actual flight tracks |
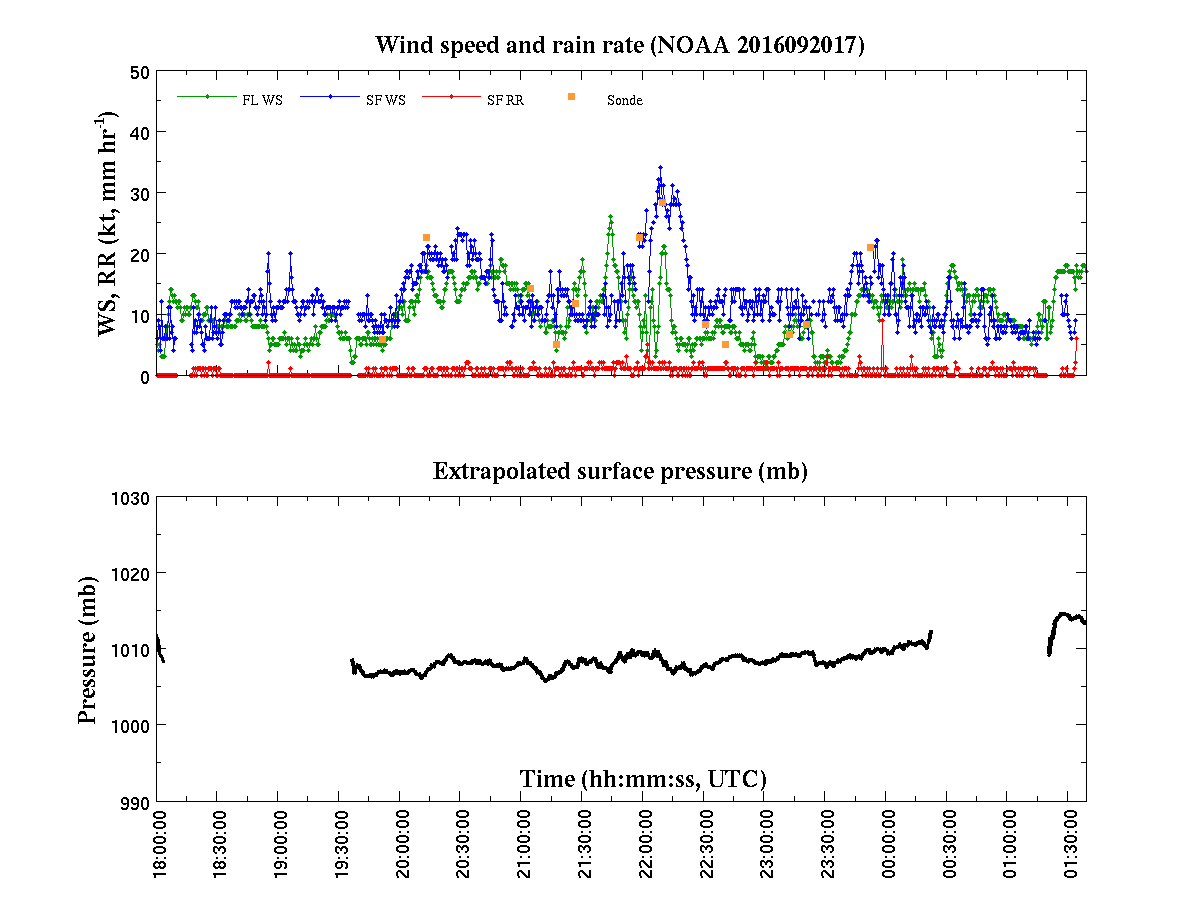
The rotated Figure-4 pattern was flown but the start was shifted to the S and the end in the NW (Figure 5b). Shear from the upper level low to the west continues to displace convection to the east and north. Radar composites show a weak, shallow vortex with the strongest convection in the NE quadrant (Figure 6). Western environment remains dry though sondes show moistening in the low levels on the southern portion of the storm. No TS force winds were found on either sondes or SFMR. The strongest surface (34kts) and flight level winds (25kts) were located in the NE. Hunted for a flight level center on the last pass and did not find a coherent vortex.
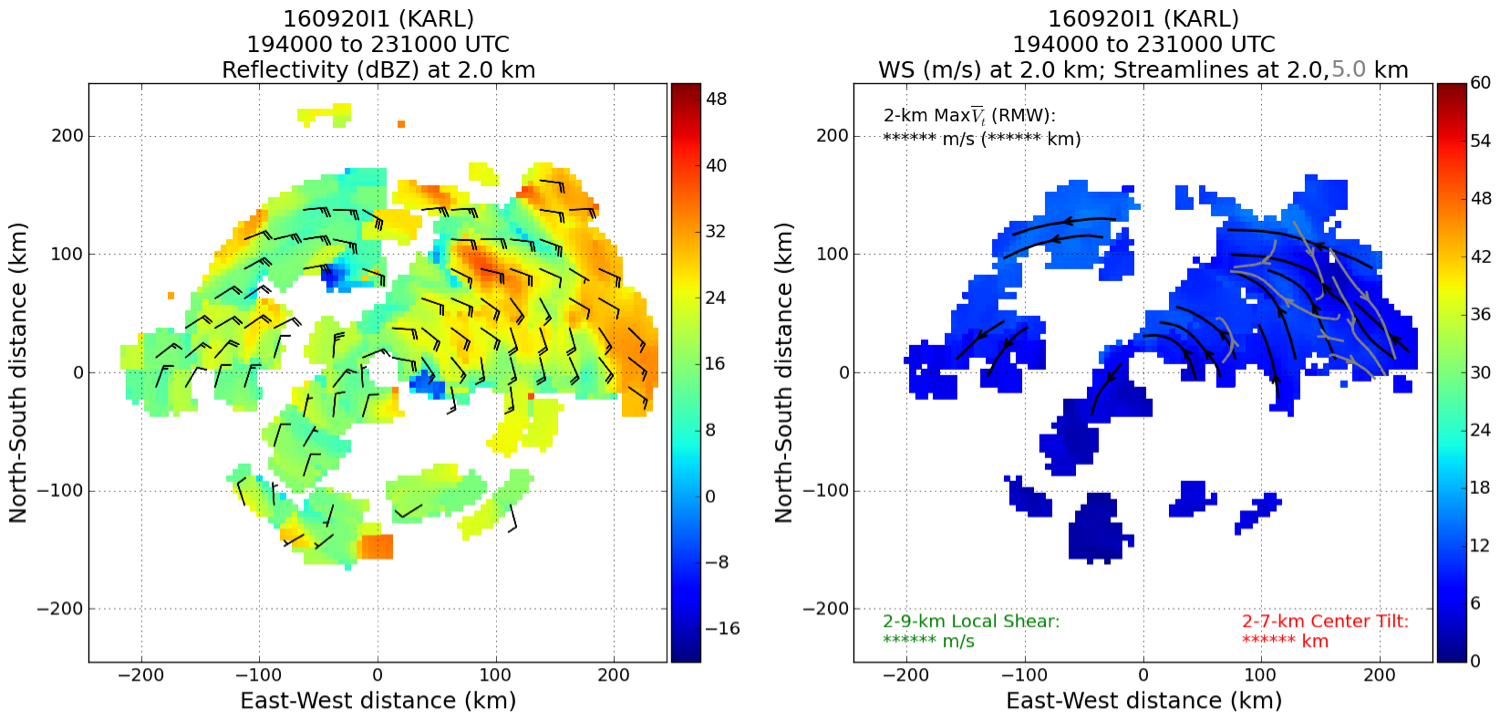 Radar analyses |
A total of 14 sondes were dropped (1 bad sonde) and 4 radar analyses were completed.
Mission Evaluation:
Coordinated with the G-IV well to conserve expendable resources. Weakening Karl makes RI less likely in the next couple days. Presence of the upper level low seems to be the inhibiting factor to intensification since the environment is slowly moistening and the SSTs are favorable.
Problems :
Only minor problems. LPS was not working at the beginning of the flight and the LF went down on the transit to the storm however was up once in Karl.
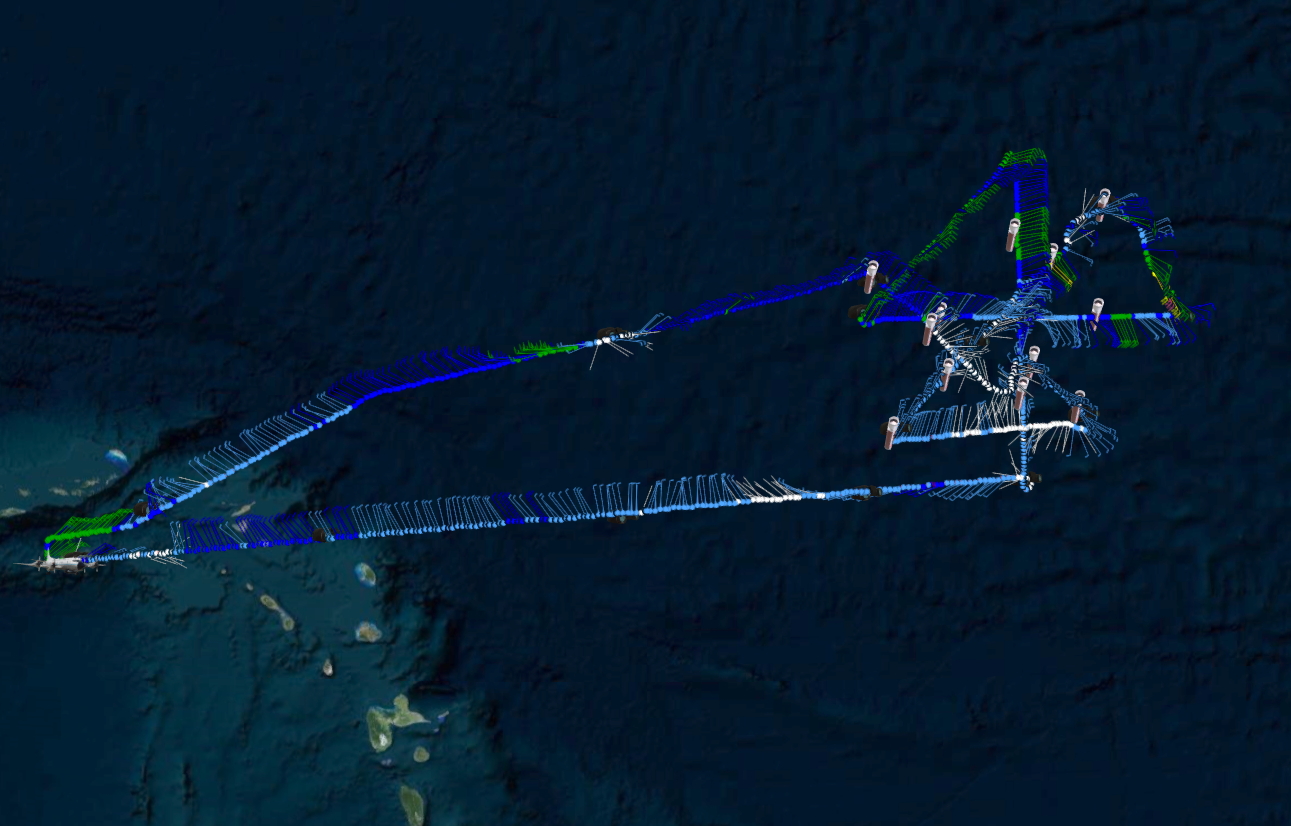 Final flight track |
||
Plot of raw High Density Obs |

Plot of raw Flight Level winds |
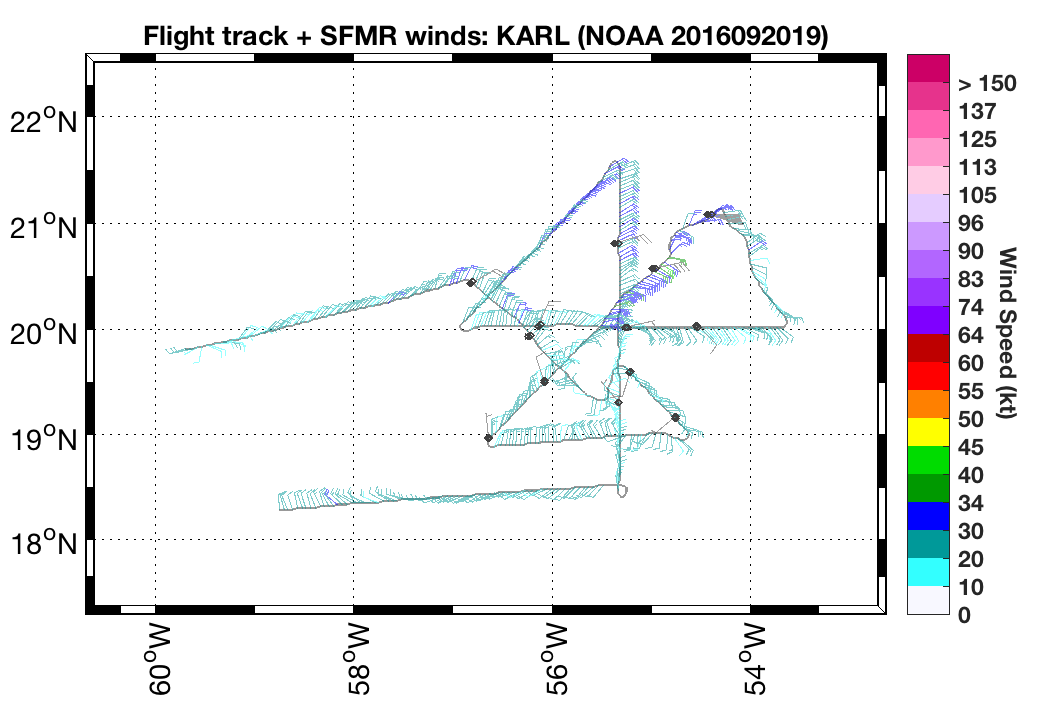
Plot of raw SFMR winds |