| LPS/Doppler/dropsonde scientist | Rob Rogers |
| Doppler/dropsonde Scientist | Paul Leighton |
| Pilots | Barry Choy Mark Nelson |
| Flight Director | Jackie Almeida |
| Navigator | Joe Bishop |
| Flt. Eng. | Dewie Floyd |
| Data Tech | Terry Lynch |
| Elec. Tech | Bobby Peek Jeff Smith |
Mission Plan :
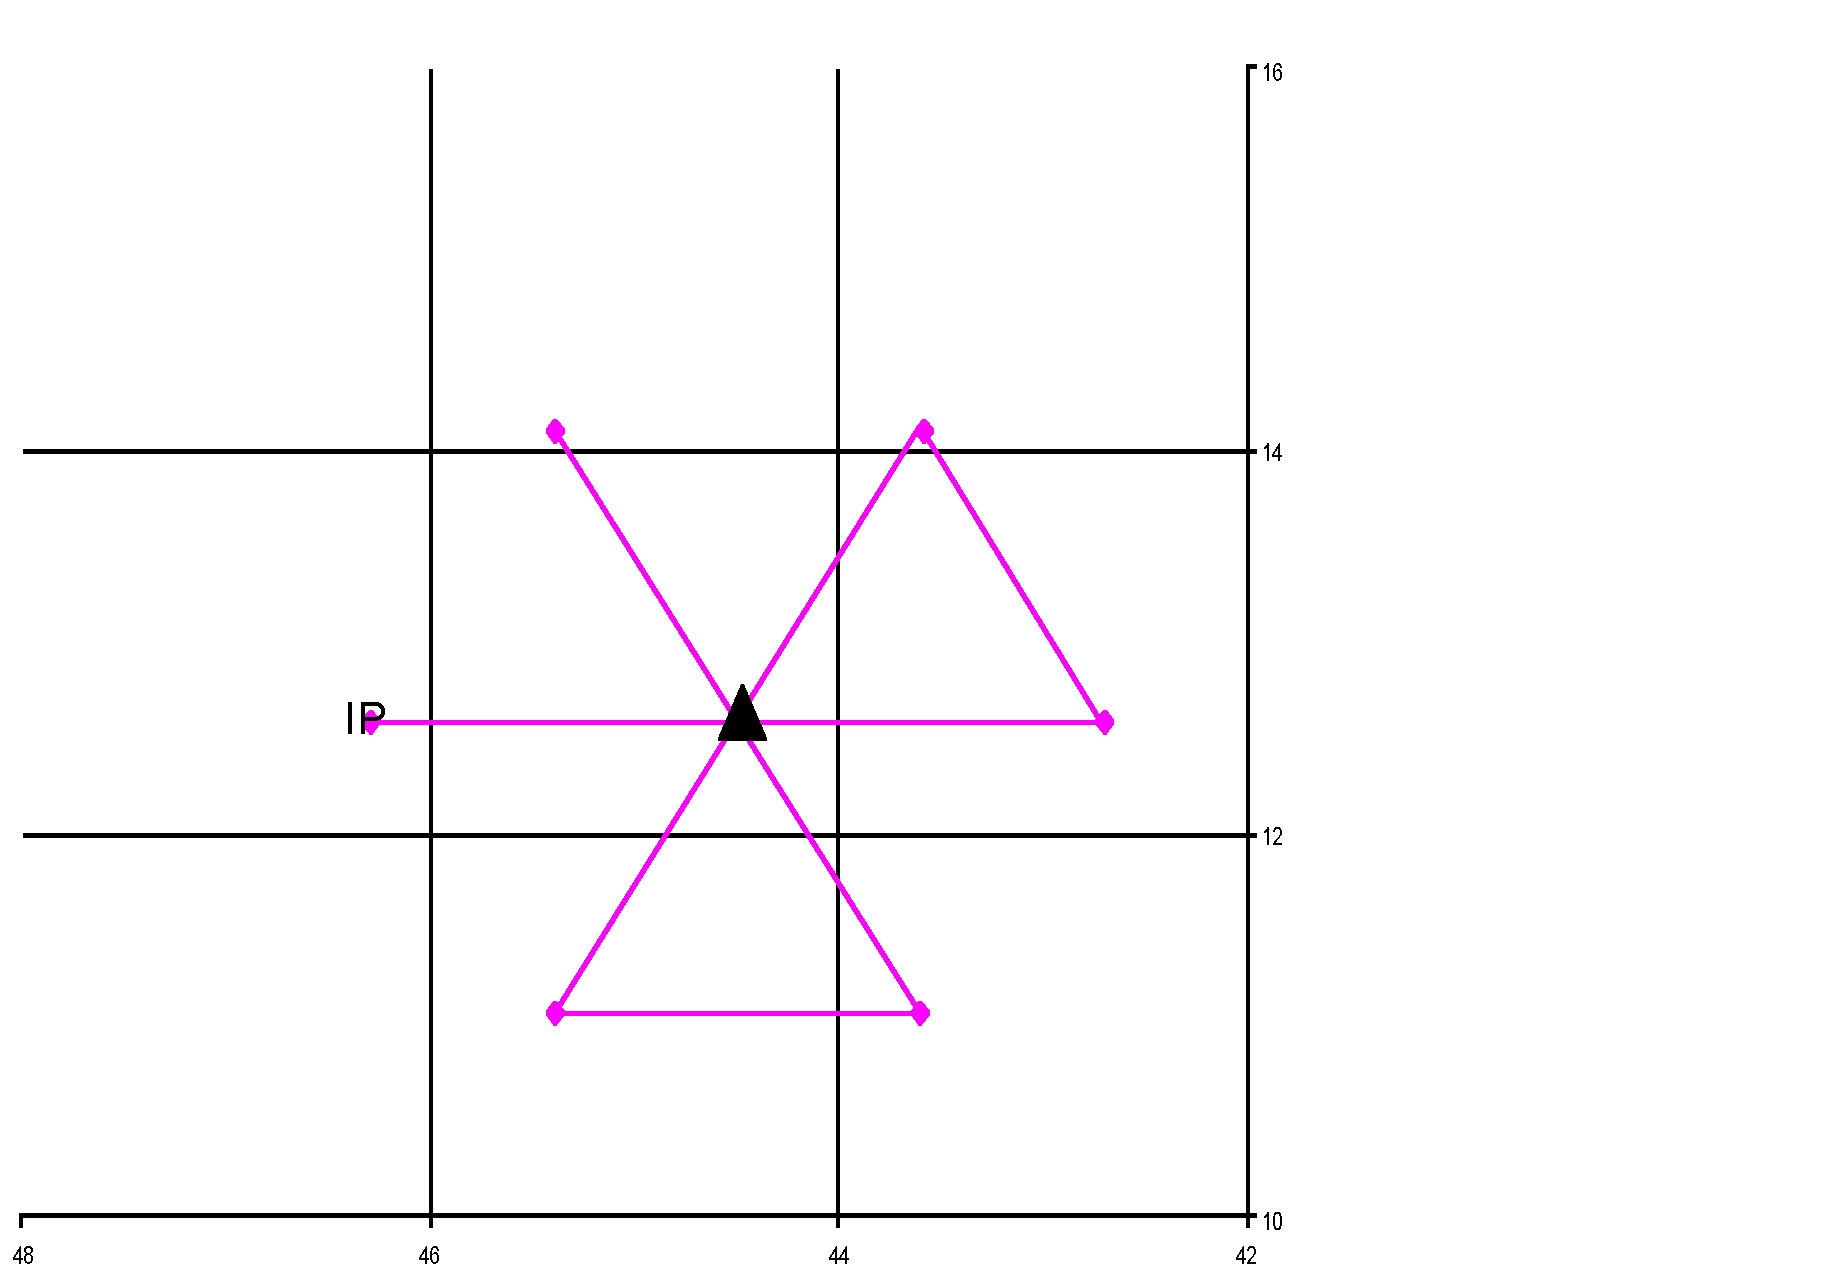
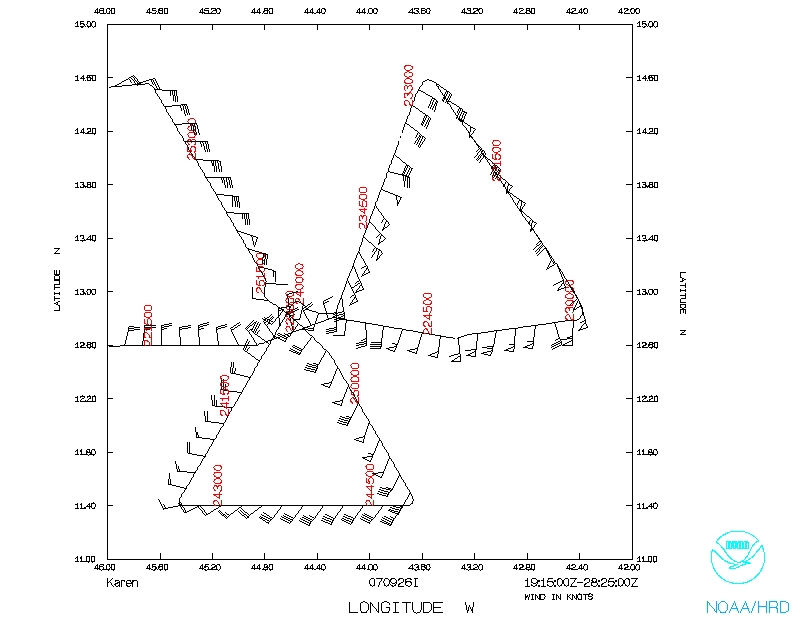
Fly butterfly pattern (Fig. 1) in T.S. Karen in support of 3-D Doppler winds mission. Karen has developed more convection near its central core this morning and is a border-line hurricane, though it is experiencing westerly shear as evident from IR imagery and cloud-track wind analyses. Fly the pattern at 10,000 ft, get fix for NHC at 00 UTC. Conduct Doppler analyses during each of three passes. No sondes will be dropped, except for drops at the center during the fixes. Flight will leave Barbados at 4:00 PM EDT, and it will recover at Barbados by 12:00 AM AST.
Mission Summary :
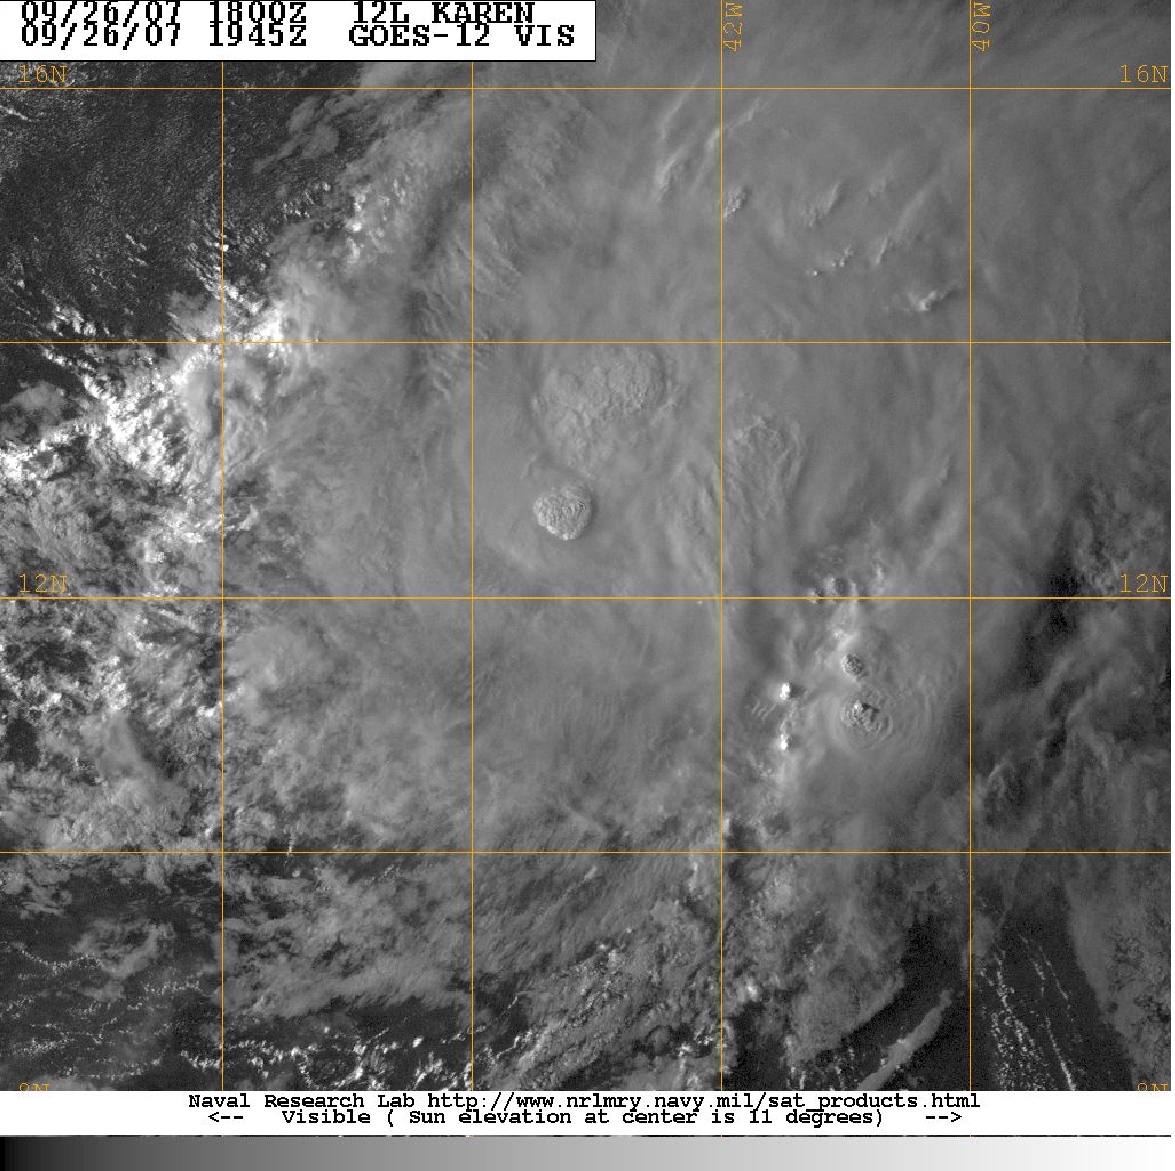
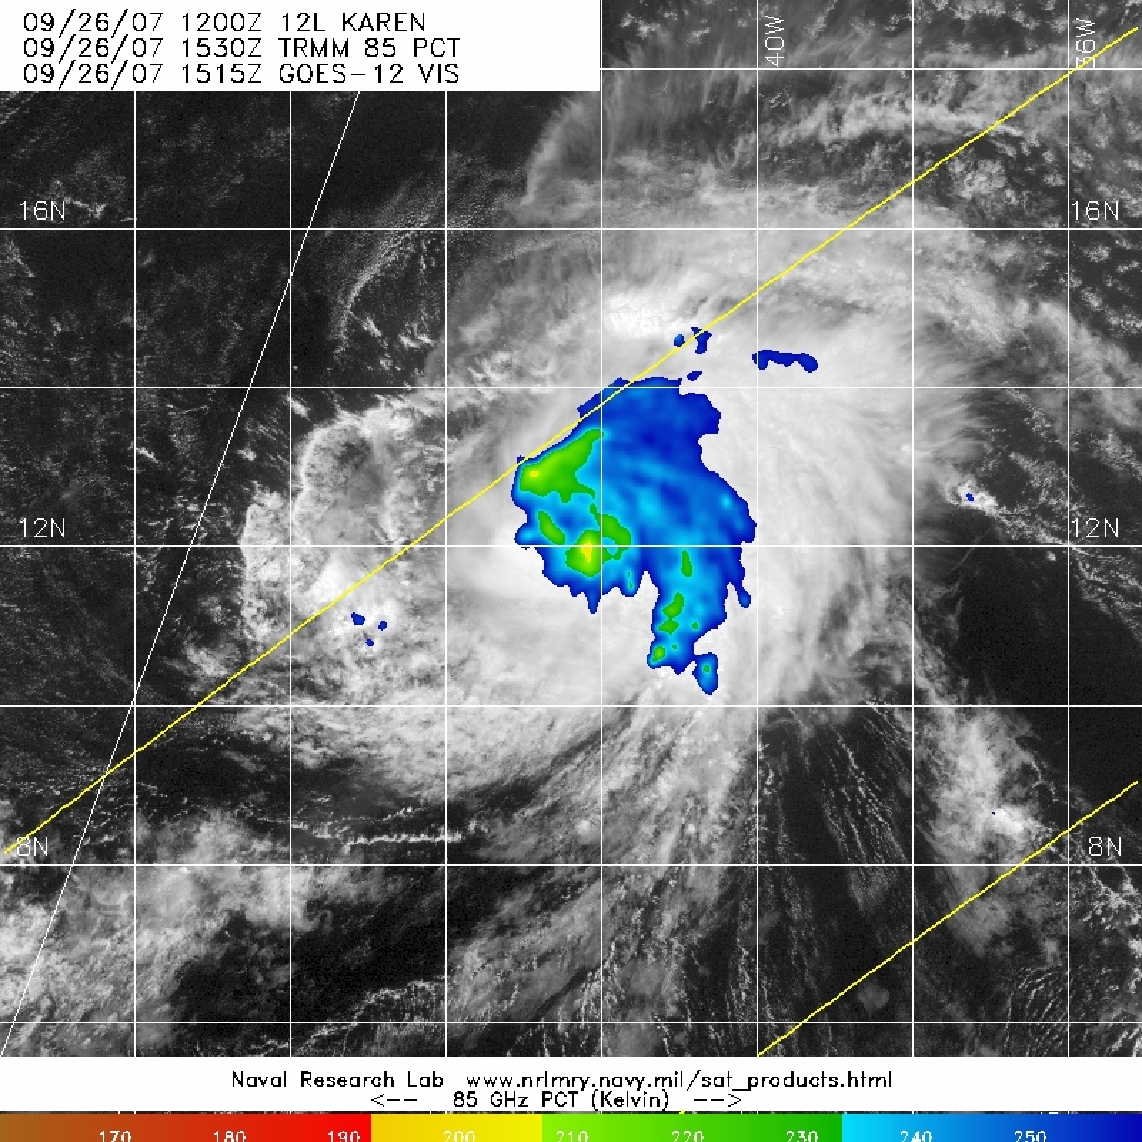
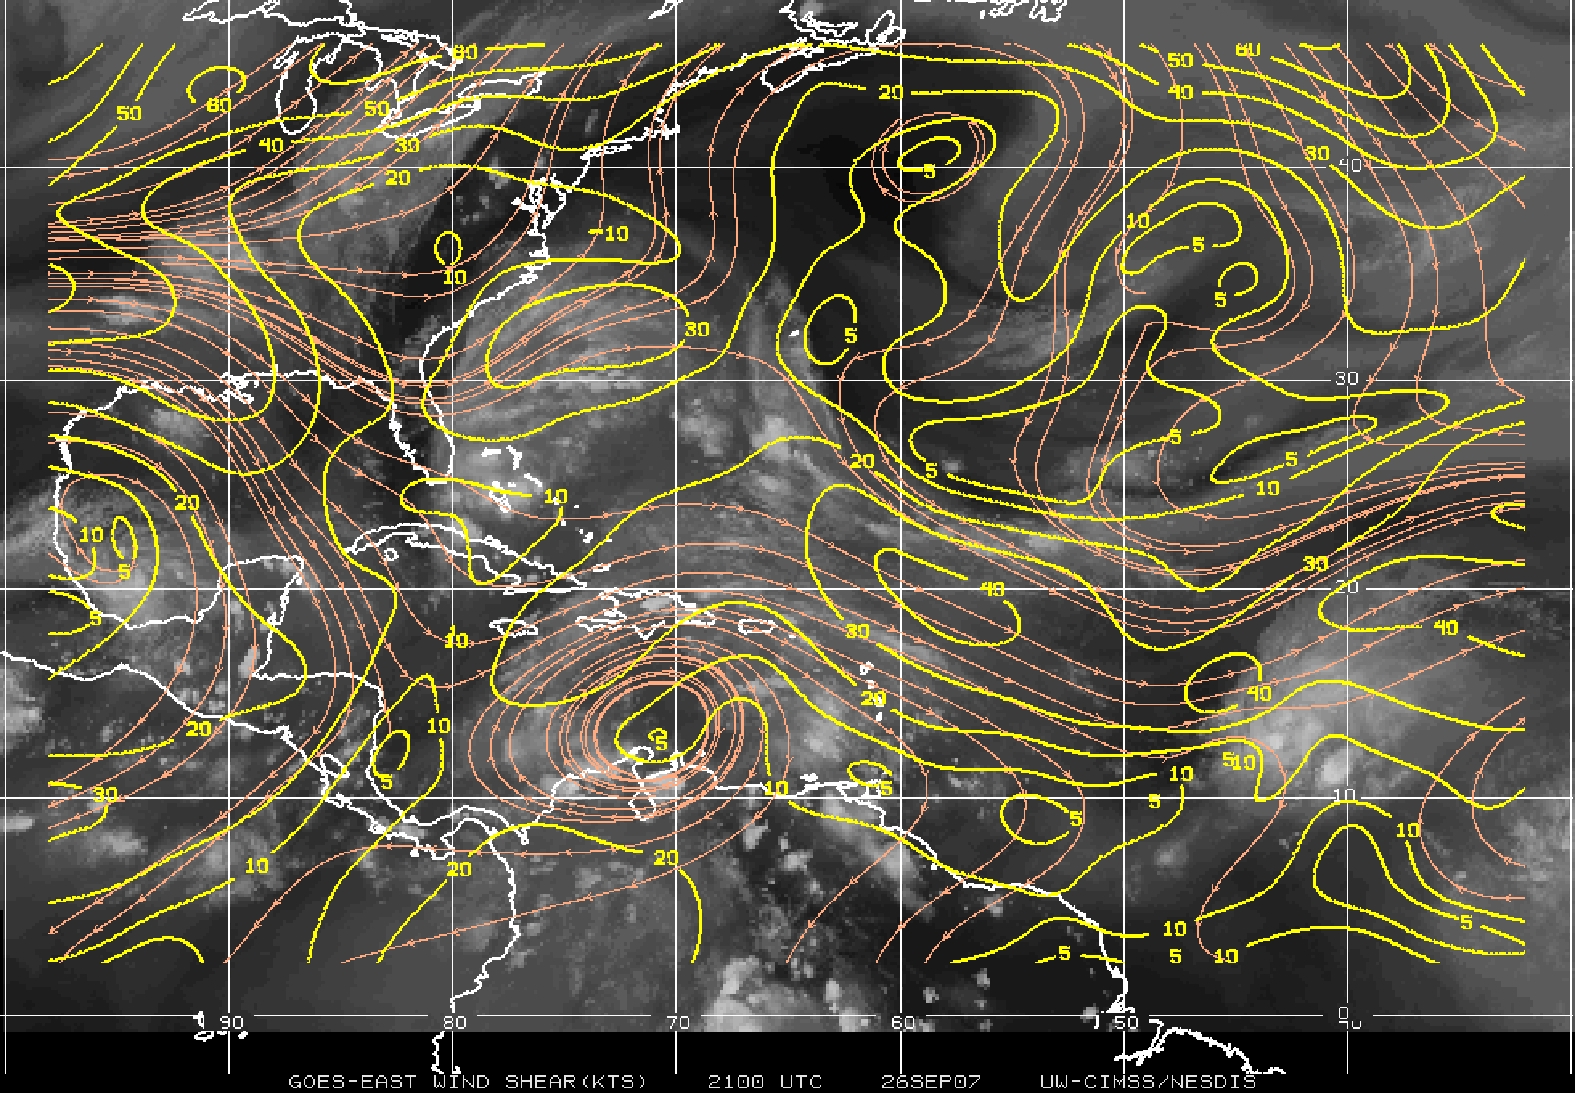
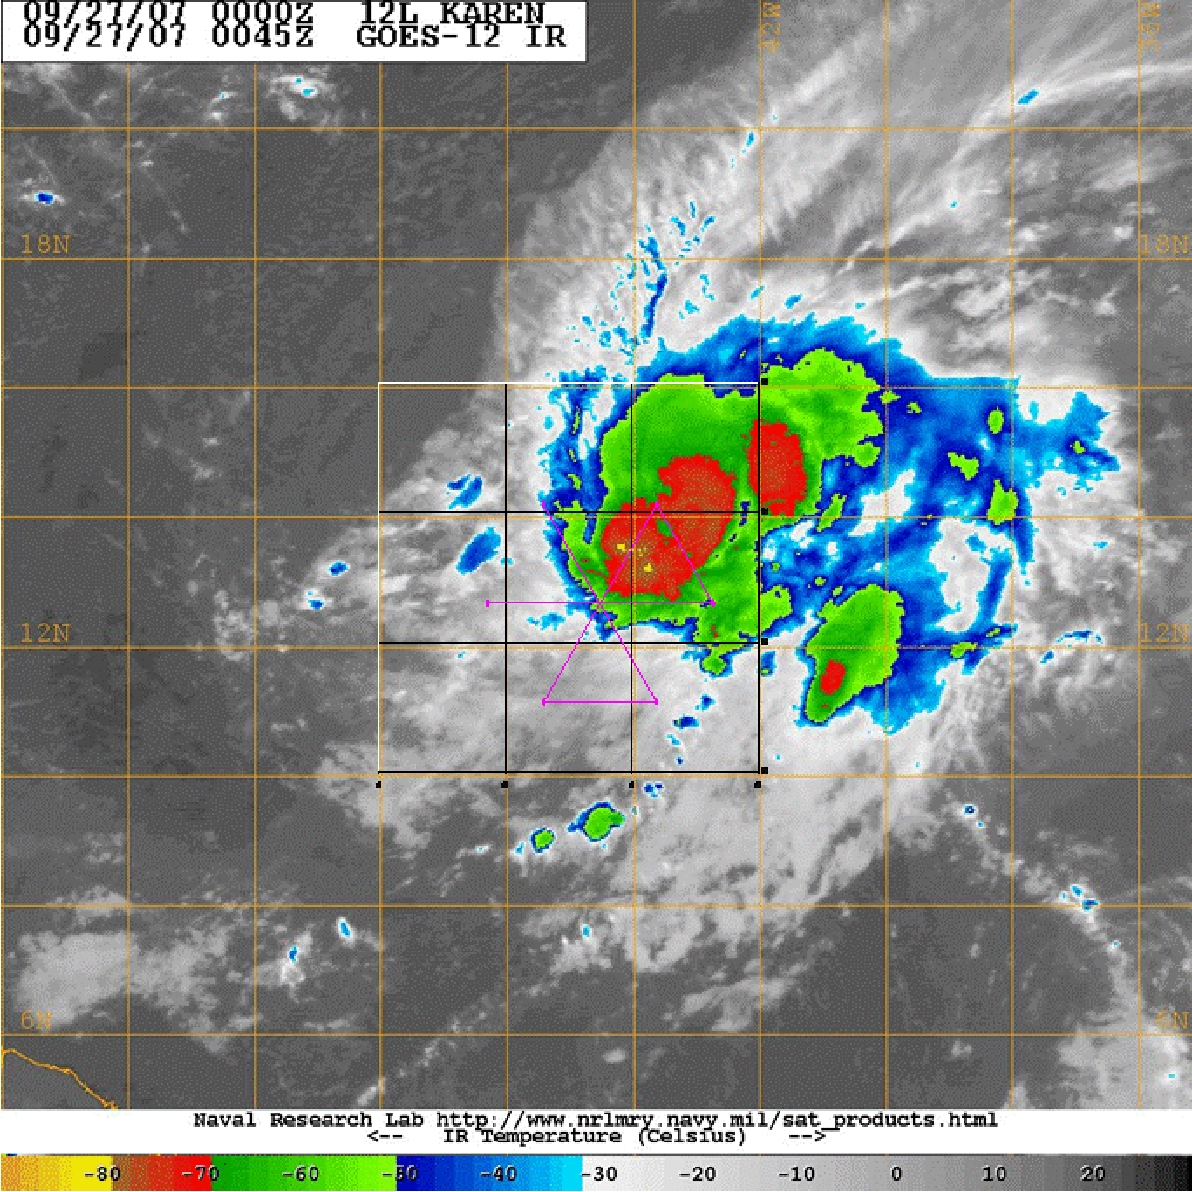
Karen was a moderate tropical storm prior to takeoff. It had areas of deep convection and associated stratiform precipitation within the circulation, as evident from visible satellite imagery (Fig. 2). Microwave imagery (Fig. 3) showed that most of the deep convection was located to the north and east of the center of circulation. This displacement was likely due to some westerly shear that the storm was experiencing during this time (Fig. 4). As a result, most of the precipitation (and scatterers) would likely be found on the north and east side of the pattern (Fig. 5).
Takeoff from Barbados was at 1915 UTC September 26. The pattern was flown generally as planned. Upon reaching the IP, west of the storm, we found that the flight-level winds were less than the SFMR winds for much of the inbound leg. On this leg, the flight-level winds were around 25 kt, while the SFMR was ranged from 28-40 kt, giving a flight-level to surface wind ratio between about 0.65-0.8. The first center fix was at 12 deg 48 min N, 44 deg 13 min W. Maximum SFMR winds were 55 kt and maximum flight-level winds were 25 kt on the W side of the storm. On the east side, the peak SFMR winds were 45 kt and the peak flight-level winds were 60 kt, indicating a substantial asymmetry, particularly at flight-level. There was widespread precipitation on
the east side of the storm, providing good tail radar coverage. Most of this was stratiform rainfall, with embedded convective cells. For much of the leg on the east side of the storm, the flight-level to surface wind ratio was about 1.4.
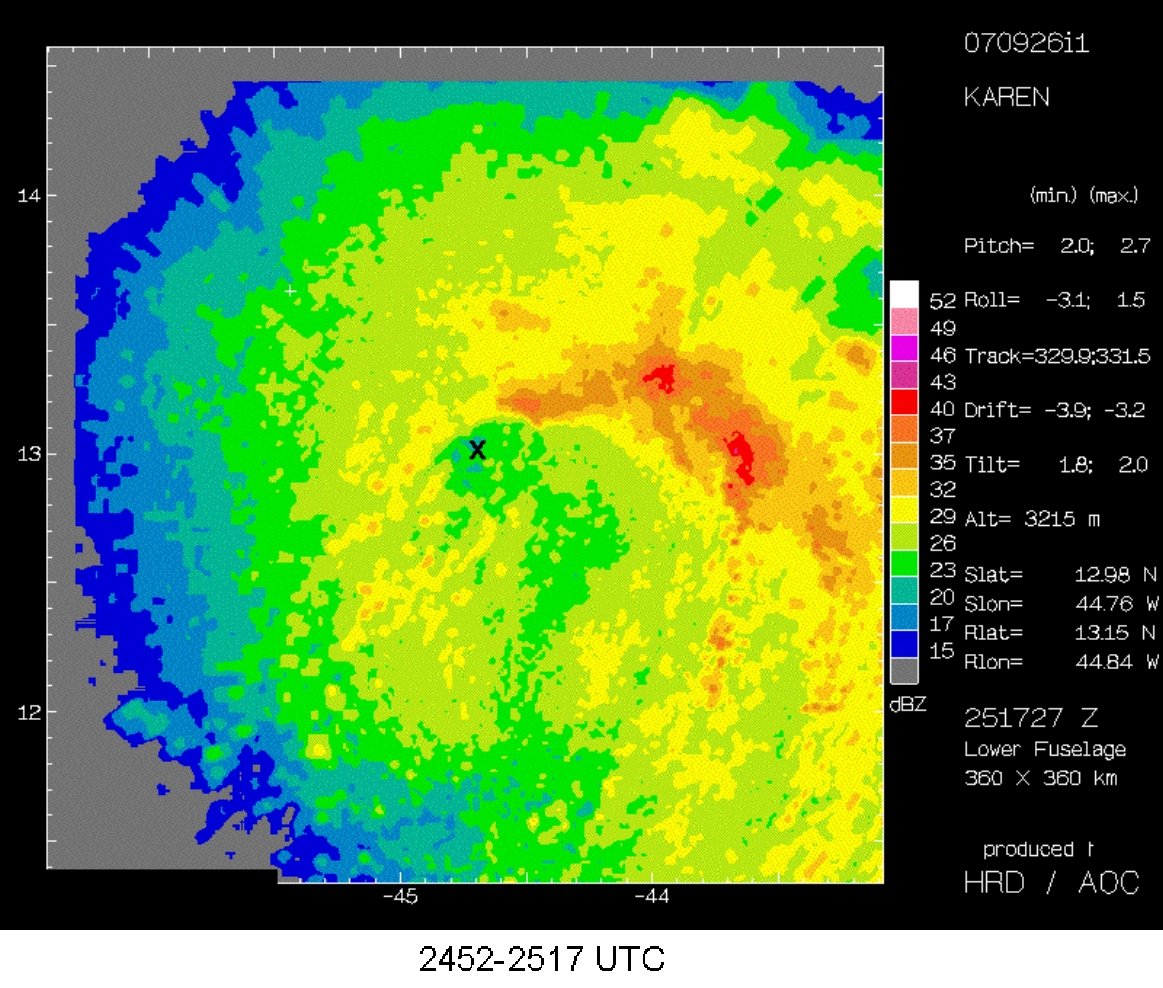
For the second fix, the center was marked at 12 deg 55 min N, 44 deg 34 min W. Maximum flight-level winds were 68 kt, and maximum SFMR winds were 63 kt on the NE side of the storm. The sonde pressure was 997.8 hPa. Winds from the center drop showed increasing southwesterly winds as the sonde fell, indicating a vortex whose surface center was displaced to the southwest from the flight- level center at 10,000 ft. On the southwest and southeast sides there was no precipitation at all. On the LF imagery pronounced banding features were evident about 60-100 nm east of the center (Fig. 6), though. Maximum flight- level winds were 50 kt, maximum SFMR winds were 25 kt on the southeast side. The final center fix was at 13 deg 2 min N, 44 deg 47 min W, with a central pressure of 997.1 hPa. Maximum flight-level winds were 50 kt, and maximum SFMR winds were 62 kt on the NW side of the storm. That marked the end of the pattern. Landing at Barbados was at 0427 UTC. Overall, the storm showed significant asymmetries, with convection nearly completely displaced from the surface and flight-level centers. Furthermore, the flight-level and surface winds showed significant variability in the ratio across the storm, and dropsondes at the center showed southeast winds below flight-level, indicative of a vortex whose center was tilted toward the southwest with decreasing altitude. These observations were reflected in the 11 PM forecast discussion issued by NHC.
Problems :
There were no problems on this flight. SFMR, dropsondes all worked fine. A total of 3 drops were released.
Robert Rogers
9/28/07
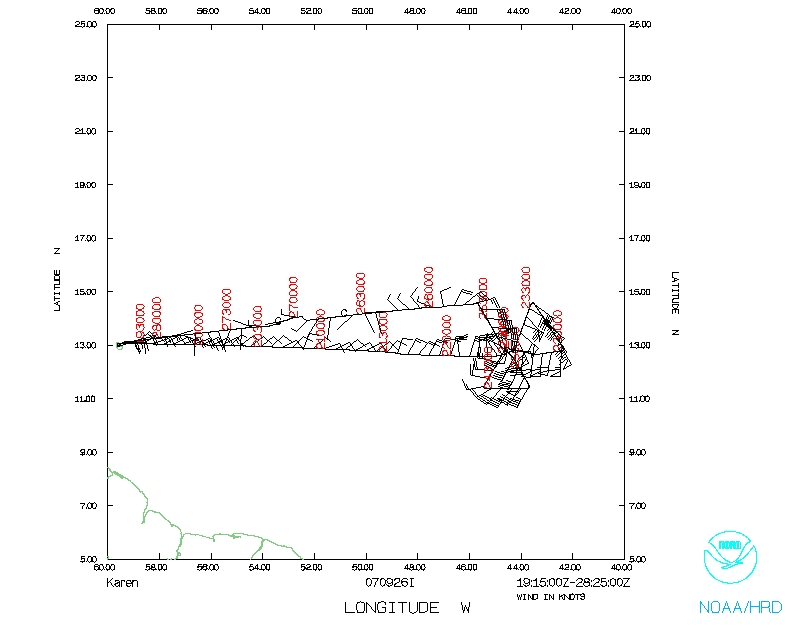 Flight track |
 Temperature and Moisture |
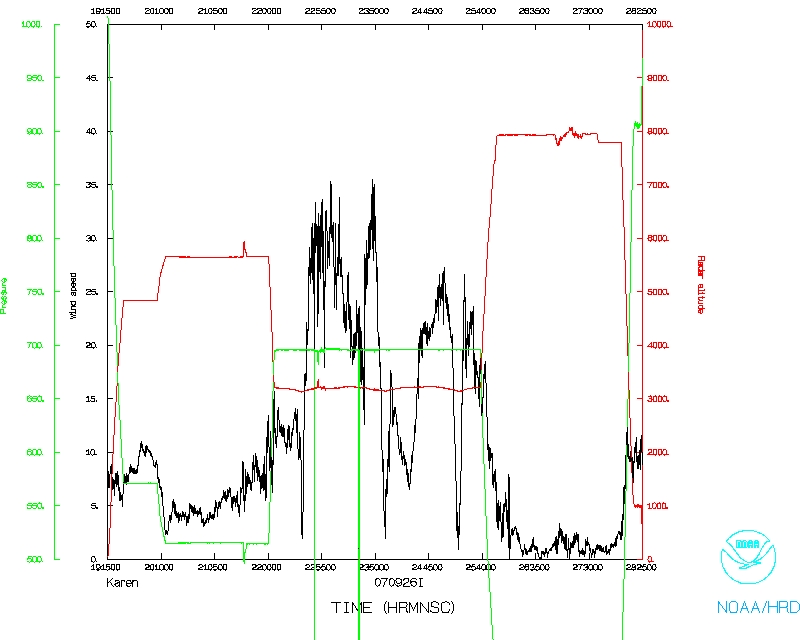 Wind and Atlitude |
 Flight track detail |
||