Mission Summary
20160809I1 Aircraft 43RF
Tropical Storm Javier
Doppler Wind LIDAR
Aircraft Crew (43RF)
| Aircraft Commander | Scott Price
|
| Co-pilot | Cathy Martin
|
| Co-pilot | Nate Kahn
|
| Navigator | Tim Gallagher
|
| Flight Engineer | Ken Heystek
|
| Flight Engineer | Paul Darby
|
| Flight Director | Rich Henning
|
| Data Technician | Todd Richards
|
| Data Technician | Terry Lynch
|
| Elec. Technician | Joe Greene
|
Scientific Crew (43RF)
| LPS | Lisa Bucci | HRD
|
| Radar | Paul Reasor | HRD
|
| Dropsonde | Brad Klotz | HRD
|
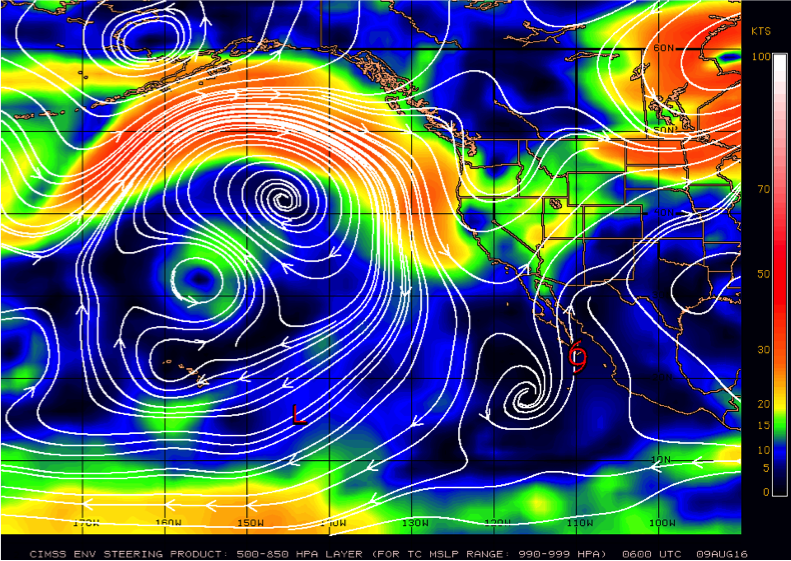
Figure 1.TS Javier in relation to DL flow
|

Figure 2.TS Javier in relation to shear
|
Mission Plan :
The mission is to conduct a DWL experiment into Tropical Storm Javier. The
40kt system is located off the coast of the Baja Peninsula, Mexico in the
East Pacific and moving NNE at about 5 knots (Figure 1). It is located under
a high pressure system (Figure 2), with shear ranging between 5 to 10 knots.
Satellite presentation shows decreasing convection in all quadrants as the
storm encounters dry air and cool SSTs. Track guidance show Javier will
continue to travel up the coast of the Baja Peninsula until dissipating in the
next 2-3 days (Figure 3).
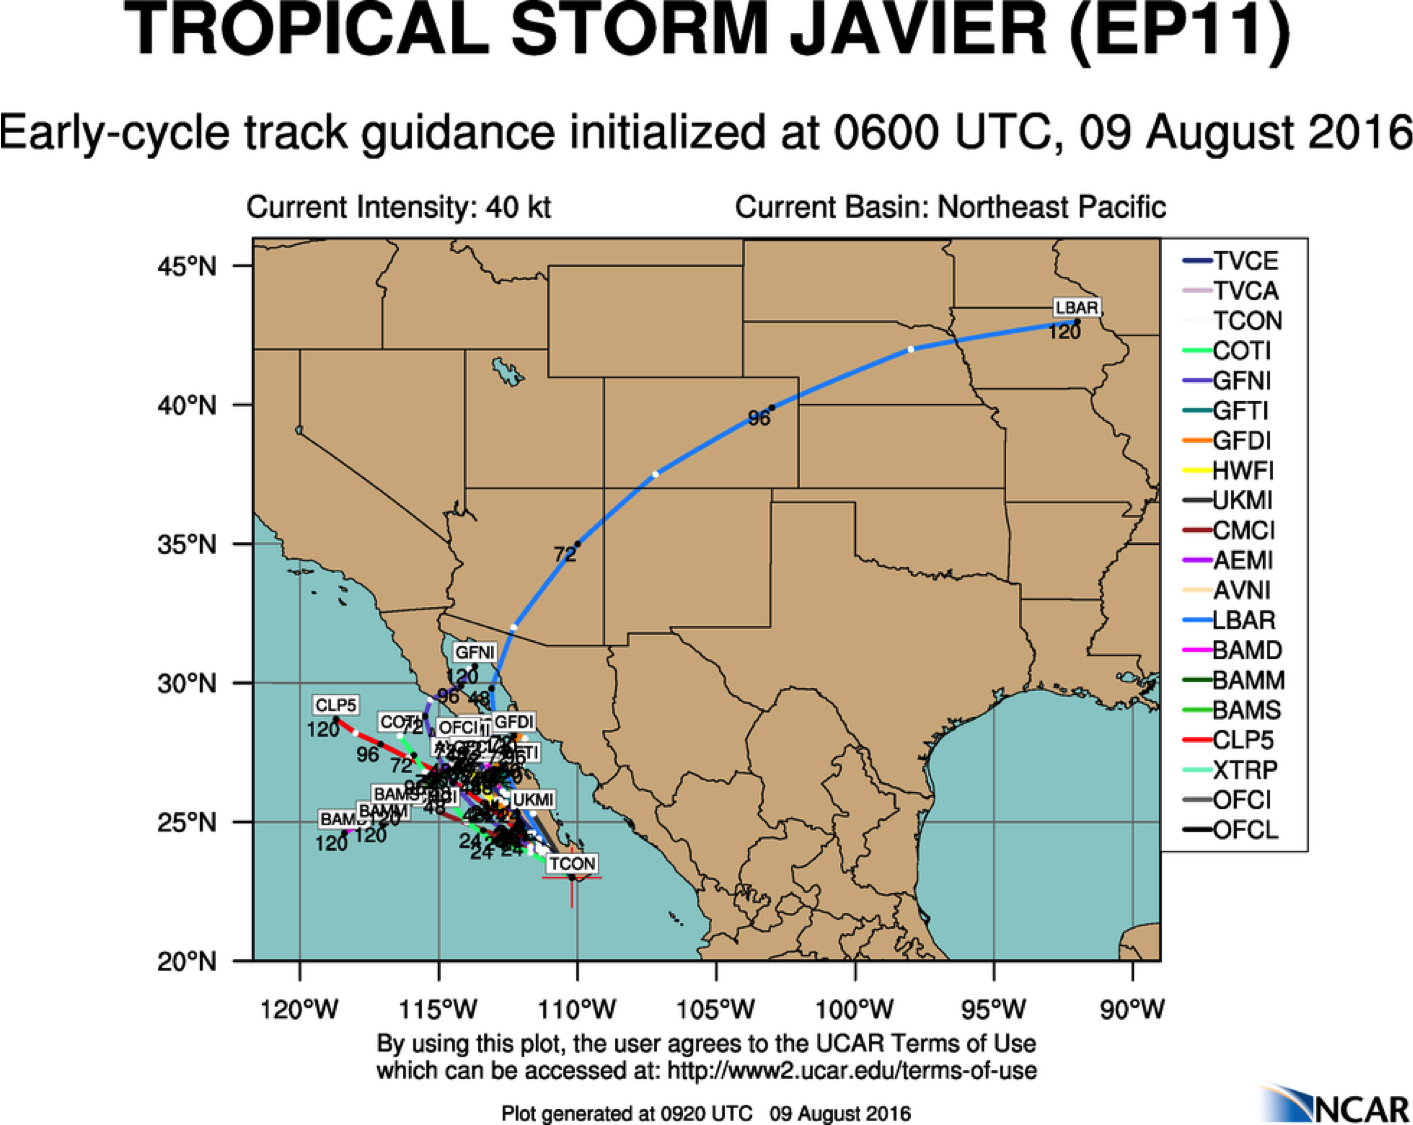
Figure 3.Forecast tracks for Javier
|
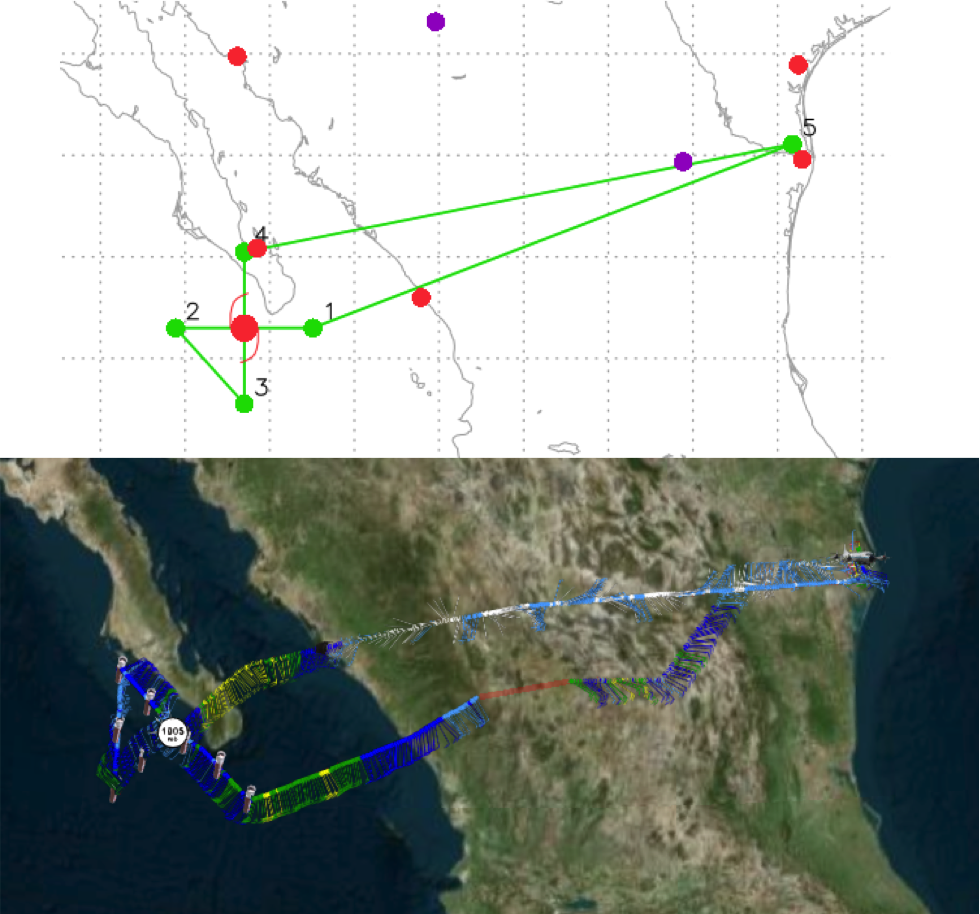
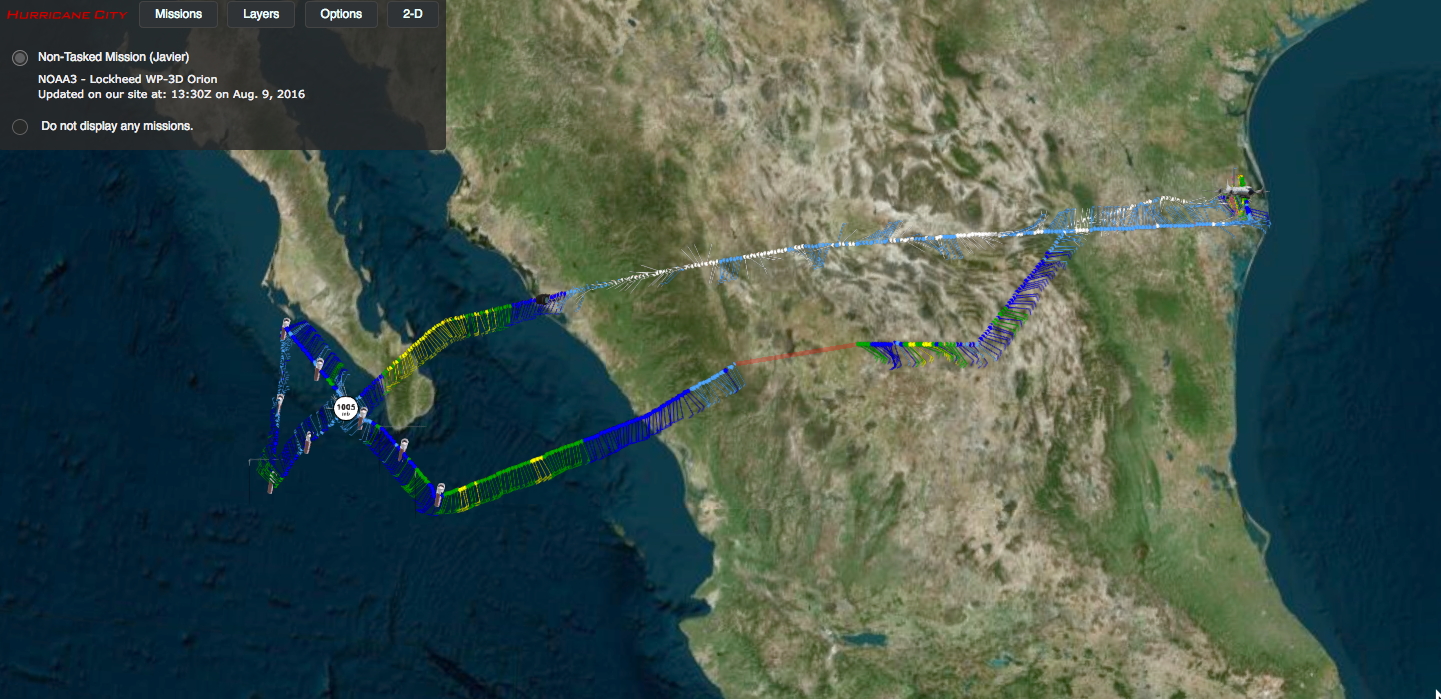
Figure 4a.Proposed track
Figure 4a.Actual track
|
Given the long transit time and proximity to land, the plan calls for a single
Figure-4 pattern with an initial point (IP) to the east (Figure 4a). Upon
completion of the mission, the plane will return to Harlingen, TX.
TDR MISSION PLAN: Javier
Prepared by the Hurricane Research Division File: current1.ftk
August 20, 2015
Aircraft: N43RF
Proposed takeoff: 09/0600Z
|
|
DROP LOCATION TABLE
|
| #
| LAT
| LON
| RAD/AZM
| Time
|
|
| deg min
| deg min
| n mi/deg
| hr:min
|
| 1S | 22 36 | 108 59 | 90/090 | 3:26
|
| 2S | 22 36 | 112 13 | 90/270 | 4:12
|
| 3S | 21 06 | 110 36 | 90/180 | 4:45
|
| 4S | 24 06 | 110 36 | 90/000 | 5:30
|
Mission Summary :
| Take off
| Landing
| Harligen, TX
| 05:57 UTC
| Harligen, TX
| 12:33 UTC
| |
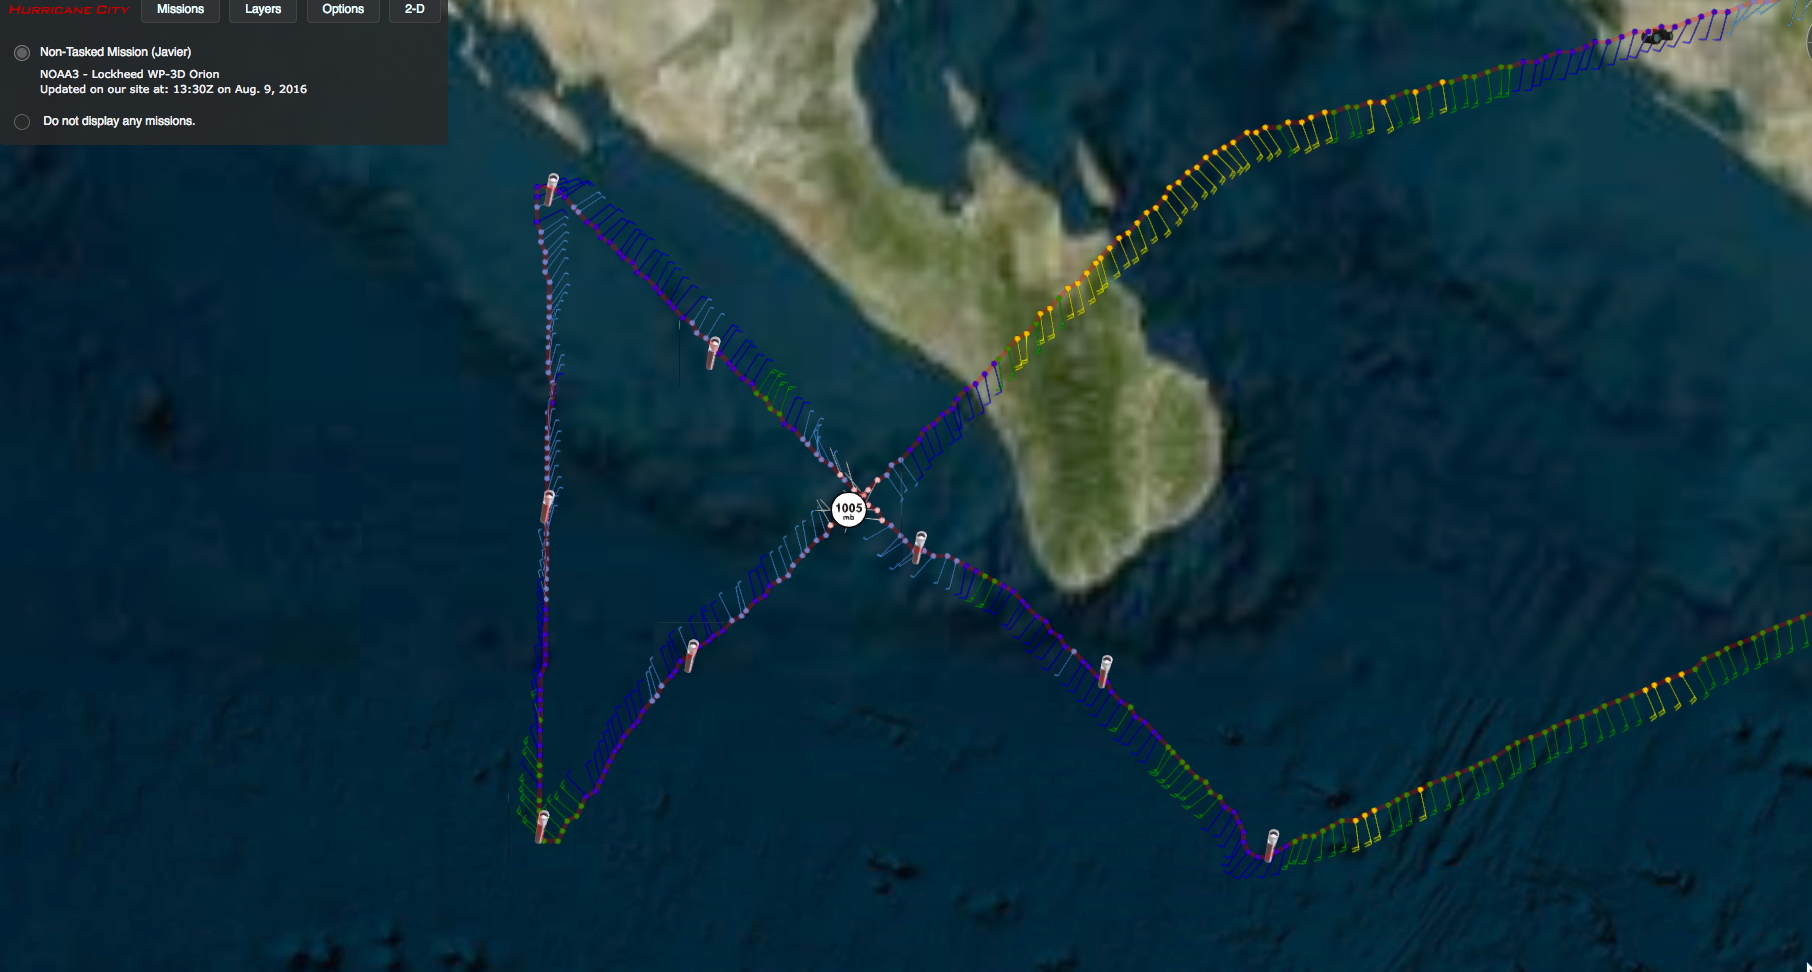
A Figure-4 pattern was flown, however the IP was shifted to the SE quadrant
making the end point over the NE (Figure 4b). The majority of the storm was
cloud and precipitation free making it ideal for the DWL. The strongest surface
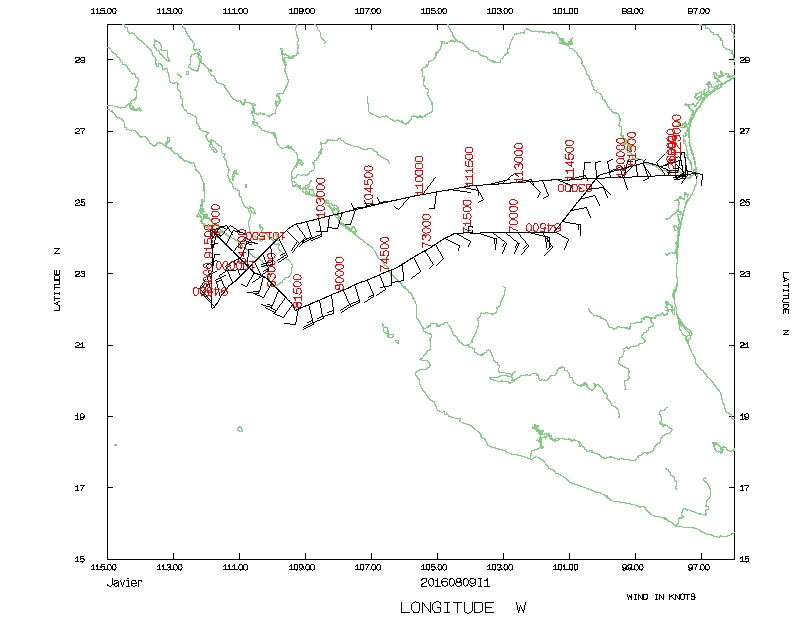
and flight level winds were located in the NNW. Radar composites show little
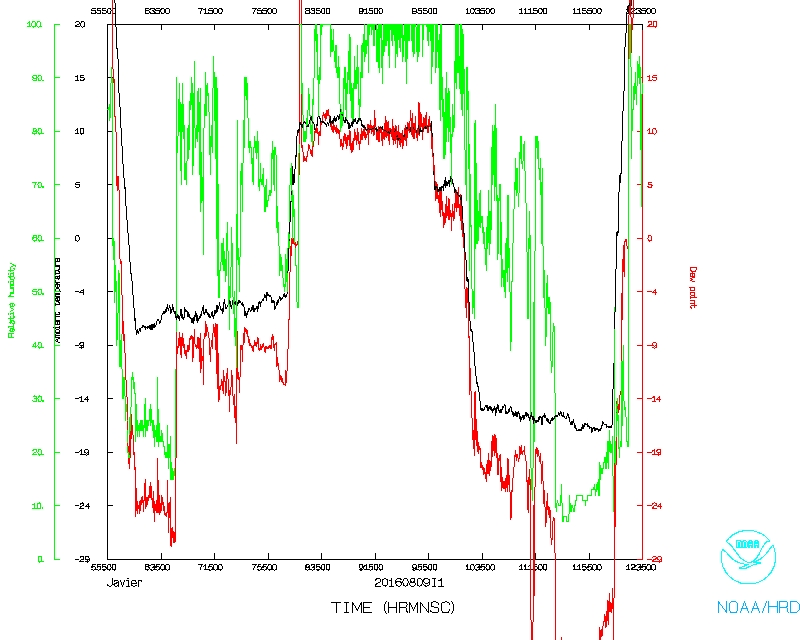
convection, however there were some weak (Figure 5). Dropsondes in the north
and western portions of the circulation showed significant dry air most likely
responsible for the lack of convection within the storm.
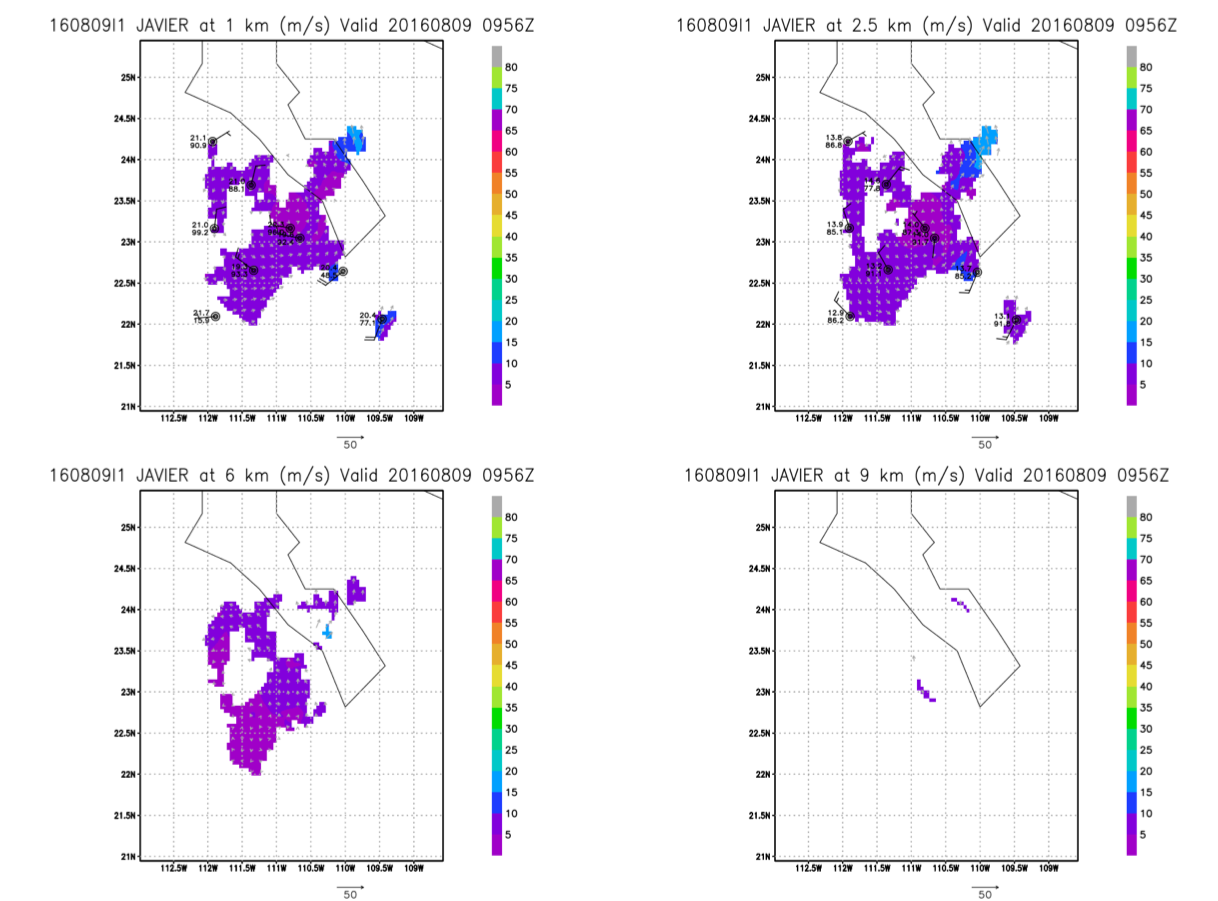
Figure 5.Doppler wind analyses for flight
|
A total of 9 sondes were dropped and 2 radar analyses were completed.
Mission Evaluation:
This mission collected DWL observations successfully and captured the second
snapshot of a tropical cyclone spinning down. Within the storm, the DWL
initially collected wind profiles both above and below the plane (4 conical
scans downward, 1 upward), however there the signal pointed upward was not
strong. Therefore, the observations were switched to only collecting data
below the aircraft. No specific calibration flight was needed given the long
commute over Mexico when observations were also collected.
Problems :
Old radar files were present in the current mission folder causing the radar
analysis to fail until the files were deleted.
Lisa Bucci
October 19, 2016
Mission Data :
LPS log |
Radar log |
DWL log |
Dropsonde log
Flight Director's log |
Flight Director's manifest |
serial data |
NetCDF data |
1 second data
Page last updated Nov. 09, 2016
Return to Mission page.