Mission Summary
20040915I1 Aircraft 43RF
Ivan flight 2004
Flight Crew (43RF)
| Flight Director | Tom Shepherd |
| Pilots | LCDR Randy Tebeest
LCDR Tom Strong
LCDR Mark Nelson |
| Navigators | LT Peter Siegel
LCDR John Adler |
| Flight Engineers | Joe Klippel
Randy Mitchell |
| Systems Engineer | Jeff Smith |
| Systems Analyst | Terry Lynch |
| Data Technician | Damon Sans Souci |
Scientific Crew (43RF)
| Lead Scientist | Peter Dodge |
| Sonde Scientist | Mike Black |
| Radar Scientist | John Gamache |
| SRA Scientist | Ed Walsh (NASA) |
| Guests | Two jounalists from Tampa TV station |
Mission Plan :
Because the Air Force Weather Squadron had evacuated Keesler AFB in
advance of Hurricane Ivan's projected landfall on the Gulf Coast, NHC
tasked NOAA 43 for the 00, 03 and 06 UTC fixes. Although the fix
requirements limited our flexibility for coastal passes, Tom Shepherd
and Peter Siegal came up with a pattern that would allow at least one
east-west pass from Panama City to Mobile Bay. As H Ivan was forecast
to be quite close to the coast by 0400, we thought we might be able to
sneak in another leg along the coast as we did our final fix.
Teams from Texas Tech (TTU), the Florida Coastal Monitoring
Program (FCMP), the Center for Severe Weather Research (CSWR),
University of Alabama-Huntsville (UAH) and University of
Louisiana-Monroe (ULM) had deployed portable Doppler radars (CSWR),
wind towers (TTU, ULM, and FCMP), and a profiler (UAH). The teams were
concentrated on the east side of Mobile Bay, anticpating being in
strong onshore flow.
Mission Summary :
NOAA 43 departed MacDill at 2256 UTC. We reached the IP and turned
at 2340 to head NW to the center for the first fix. 43 continued NW to
the coast and then turned S at 2335 and flew over the BURL1 C-Man
station. By 0110 we were headed NE back to the center. After fixing
the center we flew to the coast and by 0210 we were headed W along the
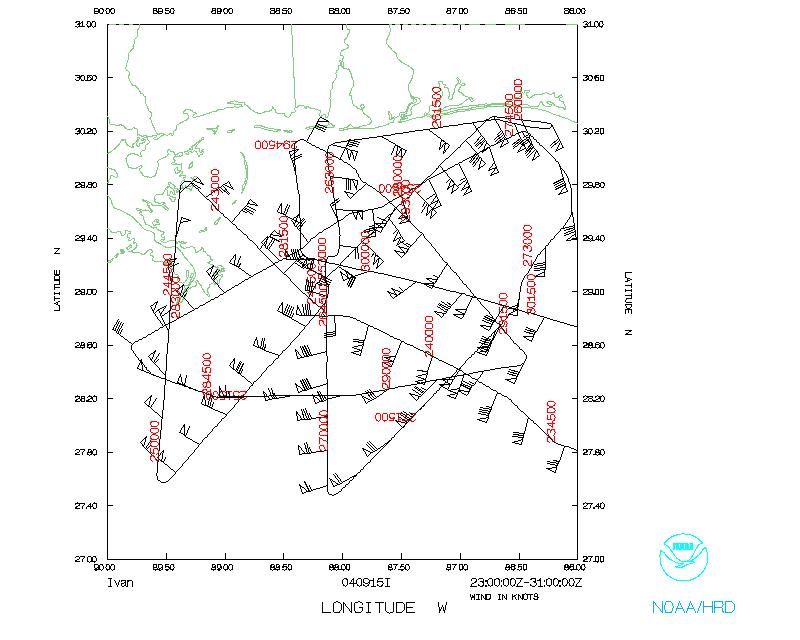
Gulf Coast. We deployed several GPS sondes along the coast, attempting
to drop them near the mobile platforms clustered on the E side of
Mobile Bay. At this time the winds were almost parallel to the coast
so this leg passed quickly!
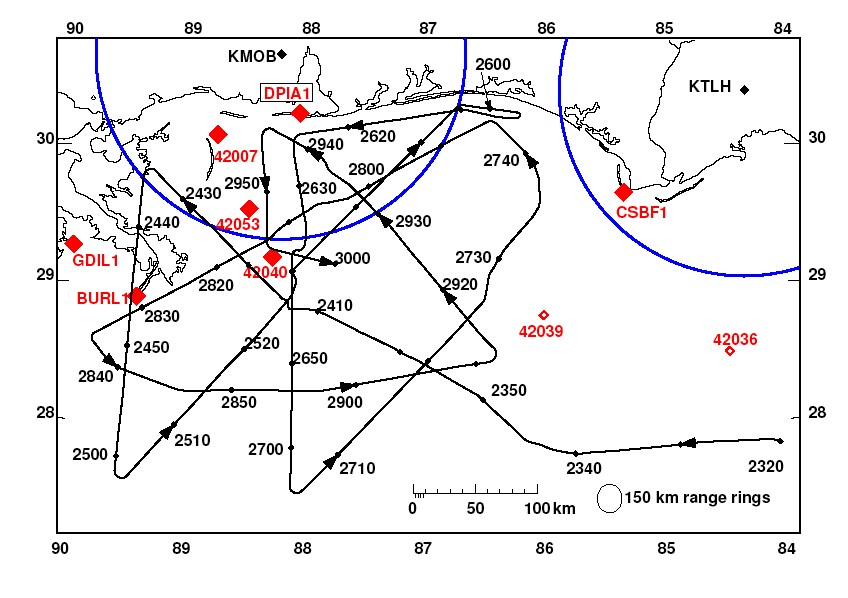 At 0225 43 turned S offshore of Dauphin Island (DPIA1 C-Man station)
and completed another center fix at 0238. The aircraft continued on a
long leg S to map out the wind radii. This was followed by a long run
NE and then N up to the coast to measure wind in the E side of the
storm. Then SW back to the center at 0407, continuing to a point SW of
BURL1.
At 0225 43 turned S offshore of Dauphin Island (DPIA1 C-Man station)
and completed another center fix at 0238. The aircraft continued on a
long leg S to map out the wind radii. This was followed by a long run
NE and then N up to the coast to measure wind in the E side of the
storm. Then SW back to the center at 0407, continuing to a point SW of
BURL1.
At this point Mike drew up a plan to head E to a point S of Panama
City, then N to the coast, followed by one more run along the coast
(where the mobile platforms would now be experiencing onshore flow)
and then a final fix before heading home. The timing would have worked,
but then the Air Force showed up on the scene to take over the
reconnaissance. So we had to turn at 0512 to head back to N of the
center to complete one more fix at 0538 UTC. After the fix 43 turned
SE out of the eye and headed back to base.
NOAA 43 landed back at MacDill at 0706 UTC.
Acknowledgments:
Prof. John Schroeder, Becca Paulsen, Dr. Josh Wurman, Dr. Forrest
Masters, Dr. Rob Howard, Prof. Kevin Knupp and Justin Walters kept
us apprised of the latest mobile platform positions which were crucial
for our attempts to target their sites with GPS drops. Tom Shepherd
and the rest of the AOC flight crew were helpful in modifying the
flight track to help us achieve the research goals while still
maintaining the operational integrity of the mission. This flight
came after 2 weeks of almost constant flying, and the AOC crew
maintained their professional yet friendly attitude throughout the
flight.
Mission Data :
One minute listing
Figures:
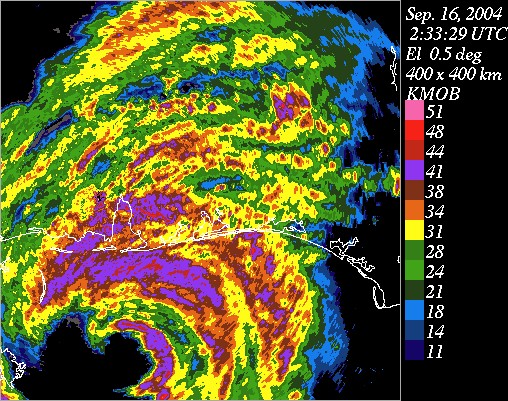
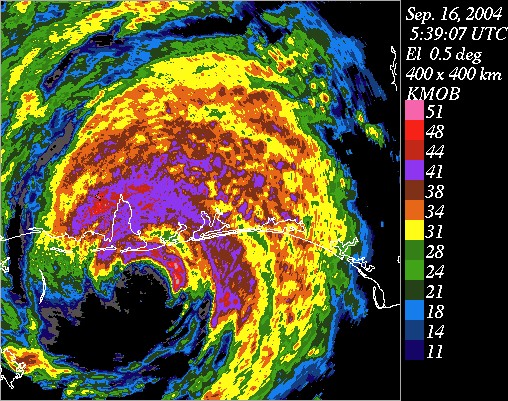
Radar Images from Mobile 88D
Tables:
Table 1
Mobile Platforms
| Latitude
| Longitued
| Platform
| Location
|
| 30 28' 45" | 87 11' 12" | T1 | FCMP Pensacola Airport
|
| 30 28' 21" | 87 52' 30" | T2 | FCMP Fairhope
|
| 30 17' 31" | 87 40' 35" | WEMITE 1 | TTU GulfShores - Jack Edwards Airport
|
| 30 30' | 87 53' | WEMITE 2 | TTU Fairhope High School
|
| 30 24' 26" | 89 04' 00" | SBCOM | TTU Gulfport Biloxi Airport
|
| 30 18' 36" | 87 33' 36" | SBCOM | TTU Wolf Airport
|
| 30 18' 36" | 86 28' 07" | SBCOM | TTU Destin Fort Walton Beach Airport
|
| 30 17' 31" | 87 40' 35" | DOW3 Radar | CSWR GulfShores - Jack Edwards Airport
|
| 30 18' 36" | 87 33' 36" | DOW2 Radar | CSWR Wolf Airport
|
| 30 20' | 87 33' | MIPS Profiler | UAH Wolf Airport
|
| 30 25' | 88 04' | Tower | ULM Dauphin Island
|
Note: Contact PI's if more precise locations desired.
Table 2
Hurricane Centers
Time
UTC
| Lat
| Lon
| Aircraft
|
|
|
| 2000 | 28 15' | 88 16' | Air Force
|
| 0014 | 28 53' | 88 11' | NOAA 43
|
| 0130 | 29 03' | 88 06' | NOAA 43
|
| 0238 | 29 15' | 88 05' | NOAA 43 NOAA 43
|
| 0407 | 29 34' | 87 58' | NOAA 43
|
| 0538 | 29 55' | 87 53' | NOAA 43 Last
|
| 0649 | 30 13' | 87 53' | Air Force
|
Table 3
Transmitted GPS Sonde Drops
| Drop
| Serial #
| Launch
UTC
| Latitude
| Longitude
| Splash
UTC
| Comments
|
| 1 | 003825298 | 2354 | 28.44 | 86.86 | 2358 | WL150 16574 085 DLM 18591 988783 M BL 17081
|
| 2 | 003825020 | 0014 | 28.88 | 88.19 | 0017 | WL150 05009 085 DLM 03008 931697 M BL 04009 EYE
|
| 3 | 003838054 | 0009 | 28.88 | 87.87 | 0012 | DLM 18094 851837 LST 876 EYEWALL 090
|
| 4 | 003838050 | 0009 | 28.89 | 87.89 | 0013 | WL150 14595 105 DLM 17589 938698 MBL 15103 LST 030 EYEWALL 090
|
| 5 | 003825299 | 0018 | 29.03 | 88.50 | 0022 | WL150 01575 085 DLM 03584 953696 MBL 02586 EYEWALL 090
|
| 6 | 003825326 | 0129 | 29.06 | 88.12 | 0132 | WL150 34508 085 DLM 34503 932700 M BL 35007 EYE
|
| 7 | 003825315 | 0134 | 29.38 | 87.97 | 0137 | DLM 12107 918698 LST 276 EYEWALL 045
|
| 8 | 003825012 | 0126 | 29.39 | 87.98 | 0138 | WL150 09114 086 DLM 12107 948698 MBL 10119 LST 011 EYEWALL 045
|
| 9 | 003825016 | 0152 | 30.20 | 87.00 | 0155 | DLM 13584 966696 MBL 13581 LST 248
|
| 10 | 004255326 | 0206 | 30.29 | 86.46 | 0210 | DLM 13581 975695 MBL 11069 LST 206
|
| 11 | 004245005 | 0222 | 30.13 | 88.04 | 0225 | WL150 06579 085 DLM 09600 979697 MBL 06591 RAINBAND
|
| 12 | 010715113 | 0233 | 29.48 | 88.12 | 0237 | WL150 08080 085 DLM 08080 944928
|
| 13 | 003838055 | 0237 | 29.24 | 88.08 | 0240 | WL150 30011 085 DLM 31510 936763 MBL 30510 EYE
|
| 14 | 010715124 | 0241 | 29.00 | 88.03 | 0244 | DLM 27091 948697 EYEWALL 180
|
| 15 | 004255288 | 0345 | 30.22 | 86.68 | 0349 | WL150 11573 085 DLM 13589 993696 MBL 12081 RAINBAND
|
| 16 | 010715118 | 0401 | 29.77 | 87.64 | 0405 | WL150 13097 085 DLM 15104 957694 MBL 13608 EYEWALL 045
|
| 17 | 003825301 | 0401 | 29.73 | 87.65 | 0404 | DLM 15604 907694 LST 471 EYEWALL 045
|
| 18 | 010715112 | 0407 | 29.56 | 87.98 | 0410 | WL150 23011 087 DLM 23011 938885 MBL 23011 LST 012 EYE
|
| 19 | 010715117 | 0419 | 29.06 | 88.70 | 0423 | WL150 30581 118 DLM 32074 976697 MBL 31086 LST 043 RAINBAND
|
| 20 | 004255327 | 0519 | 29.03 | 86.81 | 0523 | WL150 18068 085 DLM 20087 991774 MBL 18579 RAINBAND
|
| 21 | 010715121 | 0533 | 29.80 | 87.58 | 0537 | WL150 17583 085 DLM 20596 952696 MBL 18599 EYEWALL 090
|
| 22 | 004255287 | 0538 | 29.80 | 87.58 | 0537 | WL150 18099 085 DLM 20097 952696 MBL 18607 EYEWALL 090
|
| 23 | 010715001 | 0544 | 30.07 | 88.37 | 0548 | WL150 35573 085 DLM 02577 963696 MBL 00580 EYEWALL 270
|
This table lists sondes that were transmitted to NHC.
WL150: Wind in lowest 150 m
DLM: Deep Layer Mean wind
MBL: Mean Boundary Layer Wind
LST: Height of lowest wind
Page last updated February 16, 2005
Return to Mission page.