Flight Data | ||
 Flight track |
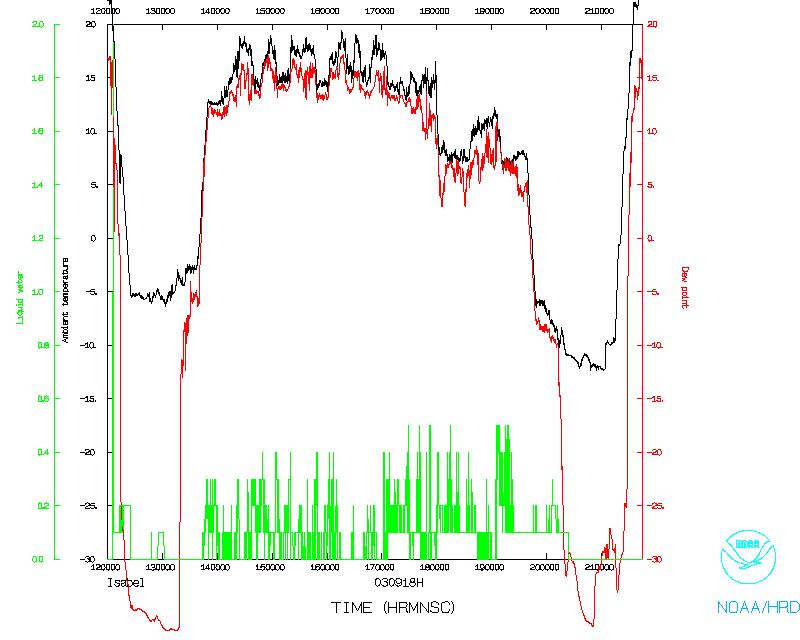 Temperature and Moisture |
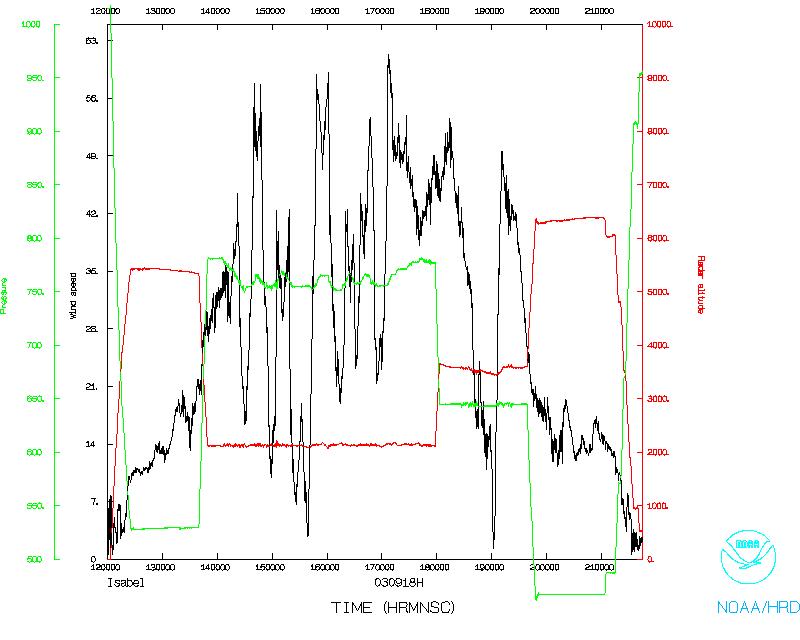 Wind and Altitude |
 Flight track |
||
| Lead Scientists | Peter Dodge
Paul Chang |
| Workstation Scientist | Paul Leighton |
| Cloud Physics Scientist | Bob Black |
| Radar Scientist | John Gamache |
| IWRAP Scientist | Daniel Esteban Fernandez |
| NESDIS Real Time | Tim Mavor |
| Observer | Jim McFadden |
| Reporter | Chris Muncie |
| Pilots | CDR Phil Kennedy
LCDR Tom Strong LT Mike Silah |
| Navigator | LCDR John Adler |
| Flight Directors | Tom Shepherd
Paul Flaherty |
| Technicians | Sean McMilan
Mark Rogers Bobby Peek |
| Flight Engineers | Greg Bast
Steve Wade |
The flight will leave MacDill AFB, FL at 8:00 AM EDT and recover at 6:00 PM EDT at MacDill AFB, FL. It is executing a Landfall experiment as Hurricane Isabel comes ashore.
The research flight plan was designed to accomplish two goals:
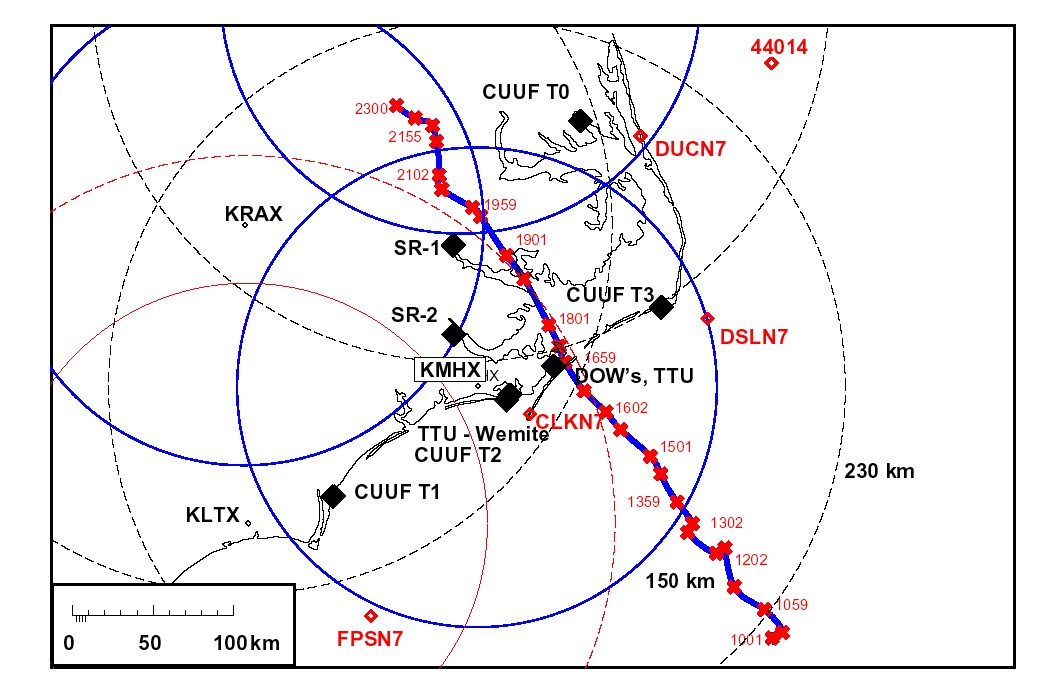
An incredible array of portable wind towers and Doppler radars were deployed in eastern North Carolina: 4 towers from a combined Clemson University - University of Florida team were erected right at the coast (CUUF T0-T3), 3 Portable radars from the Center for Severe Weather Research (DOWs) were located with a Texas Tech WEMITE wind tower on a small spit of land in Pamlico Sound, TTU and University of Oklahoma teams set up SMART-R radars at two inland locations to examine mesoscale and convective scale features. TTU also deployed other towers in a grid to examine coherent structures in the boundary layer.
Mission Summary :
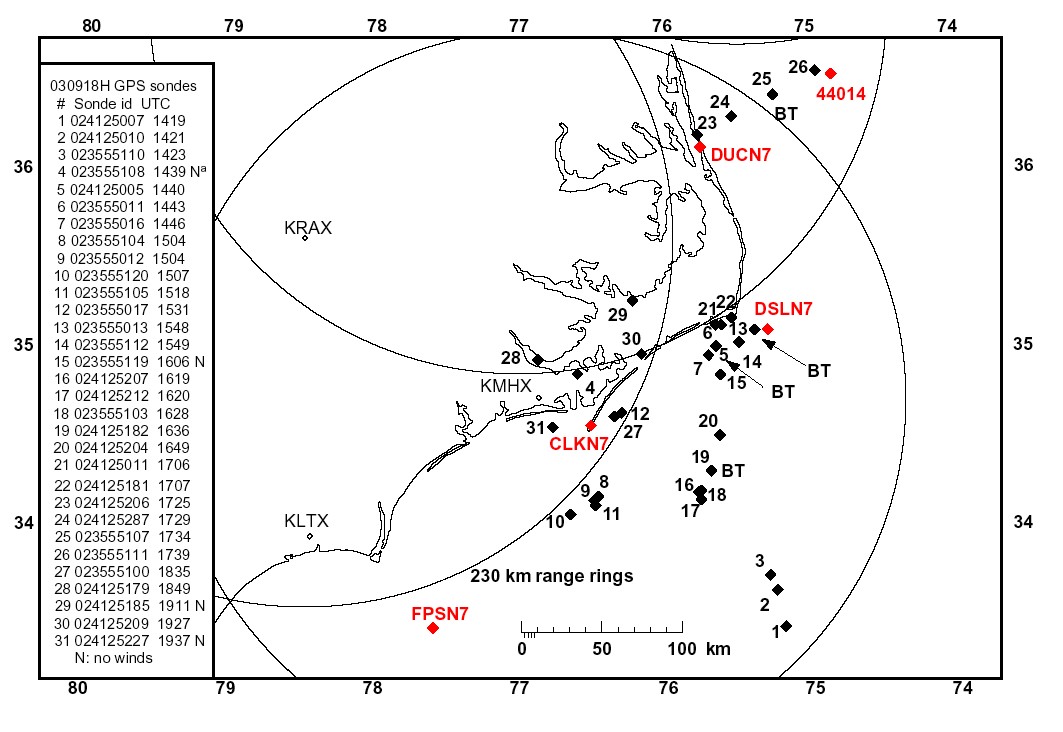
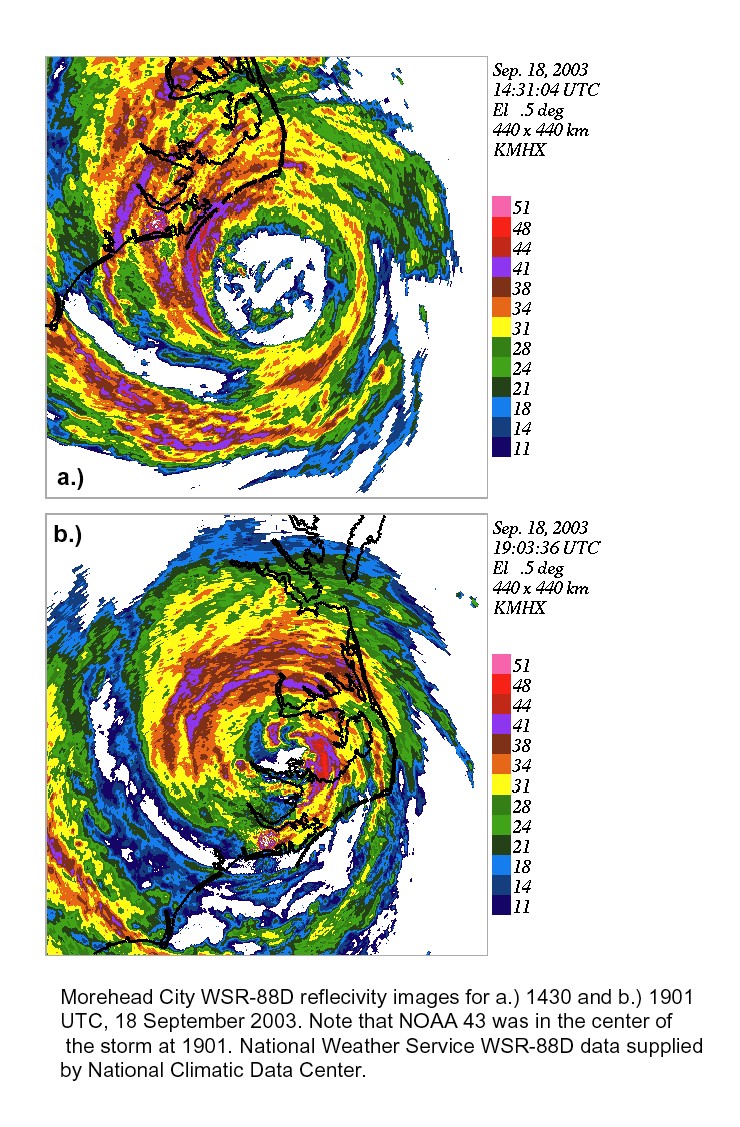
Four radar composites were transmitted which showed evidence of an inner eyewall trying to form before the storm made landfall. There were also about 32 dropsondes released during the flight.
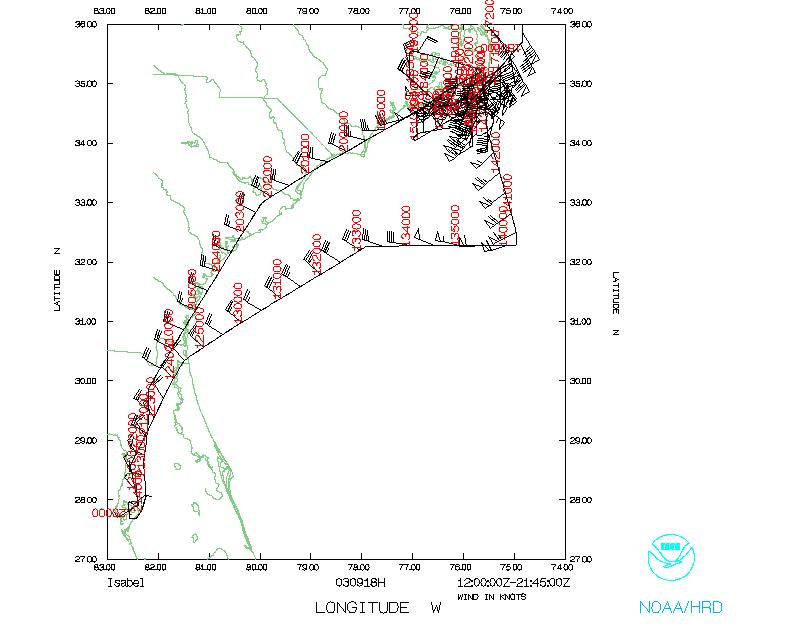
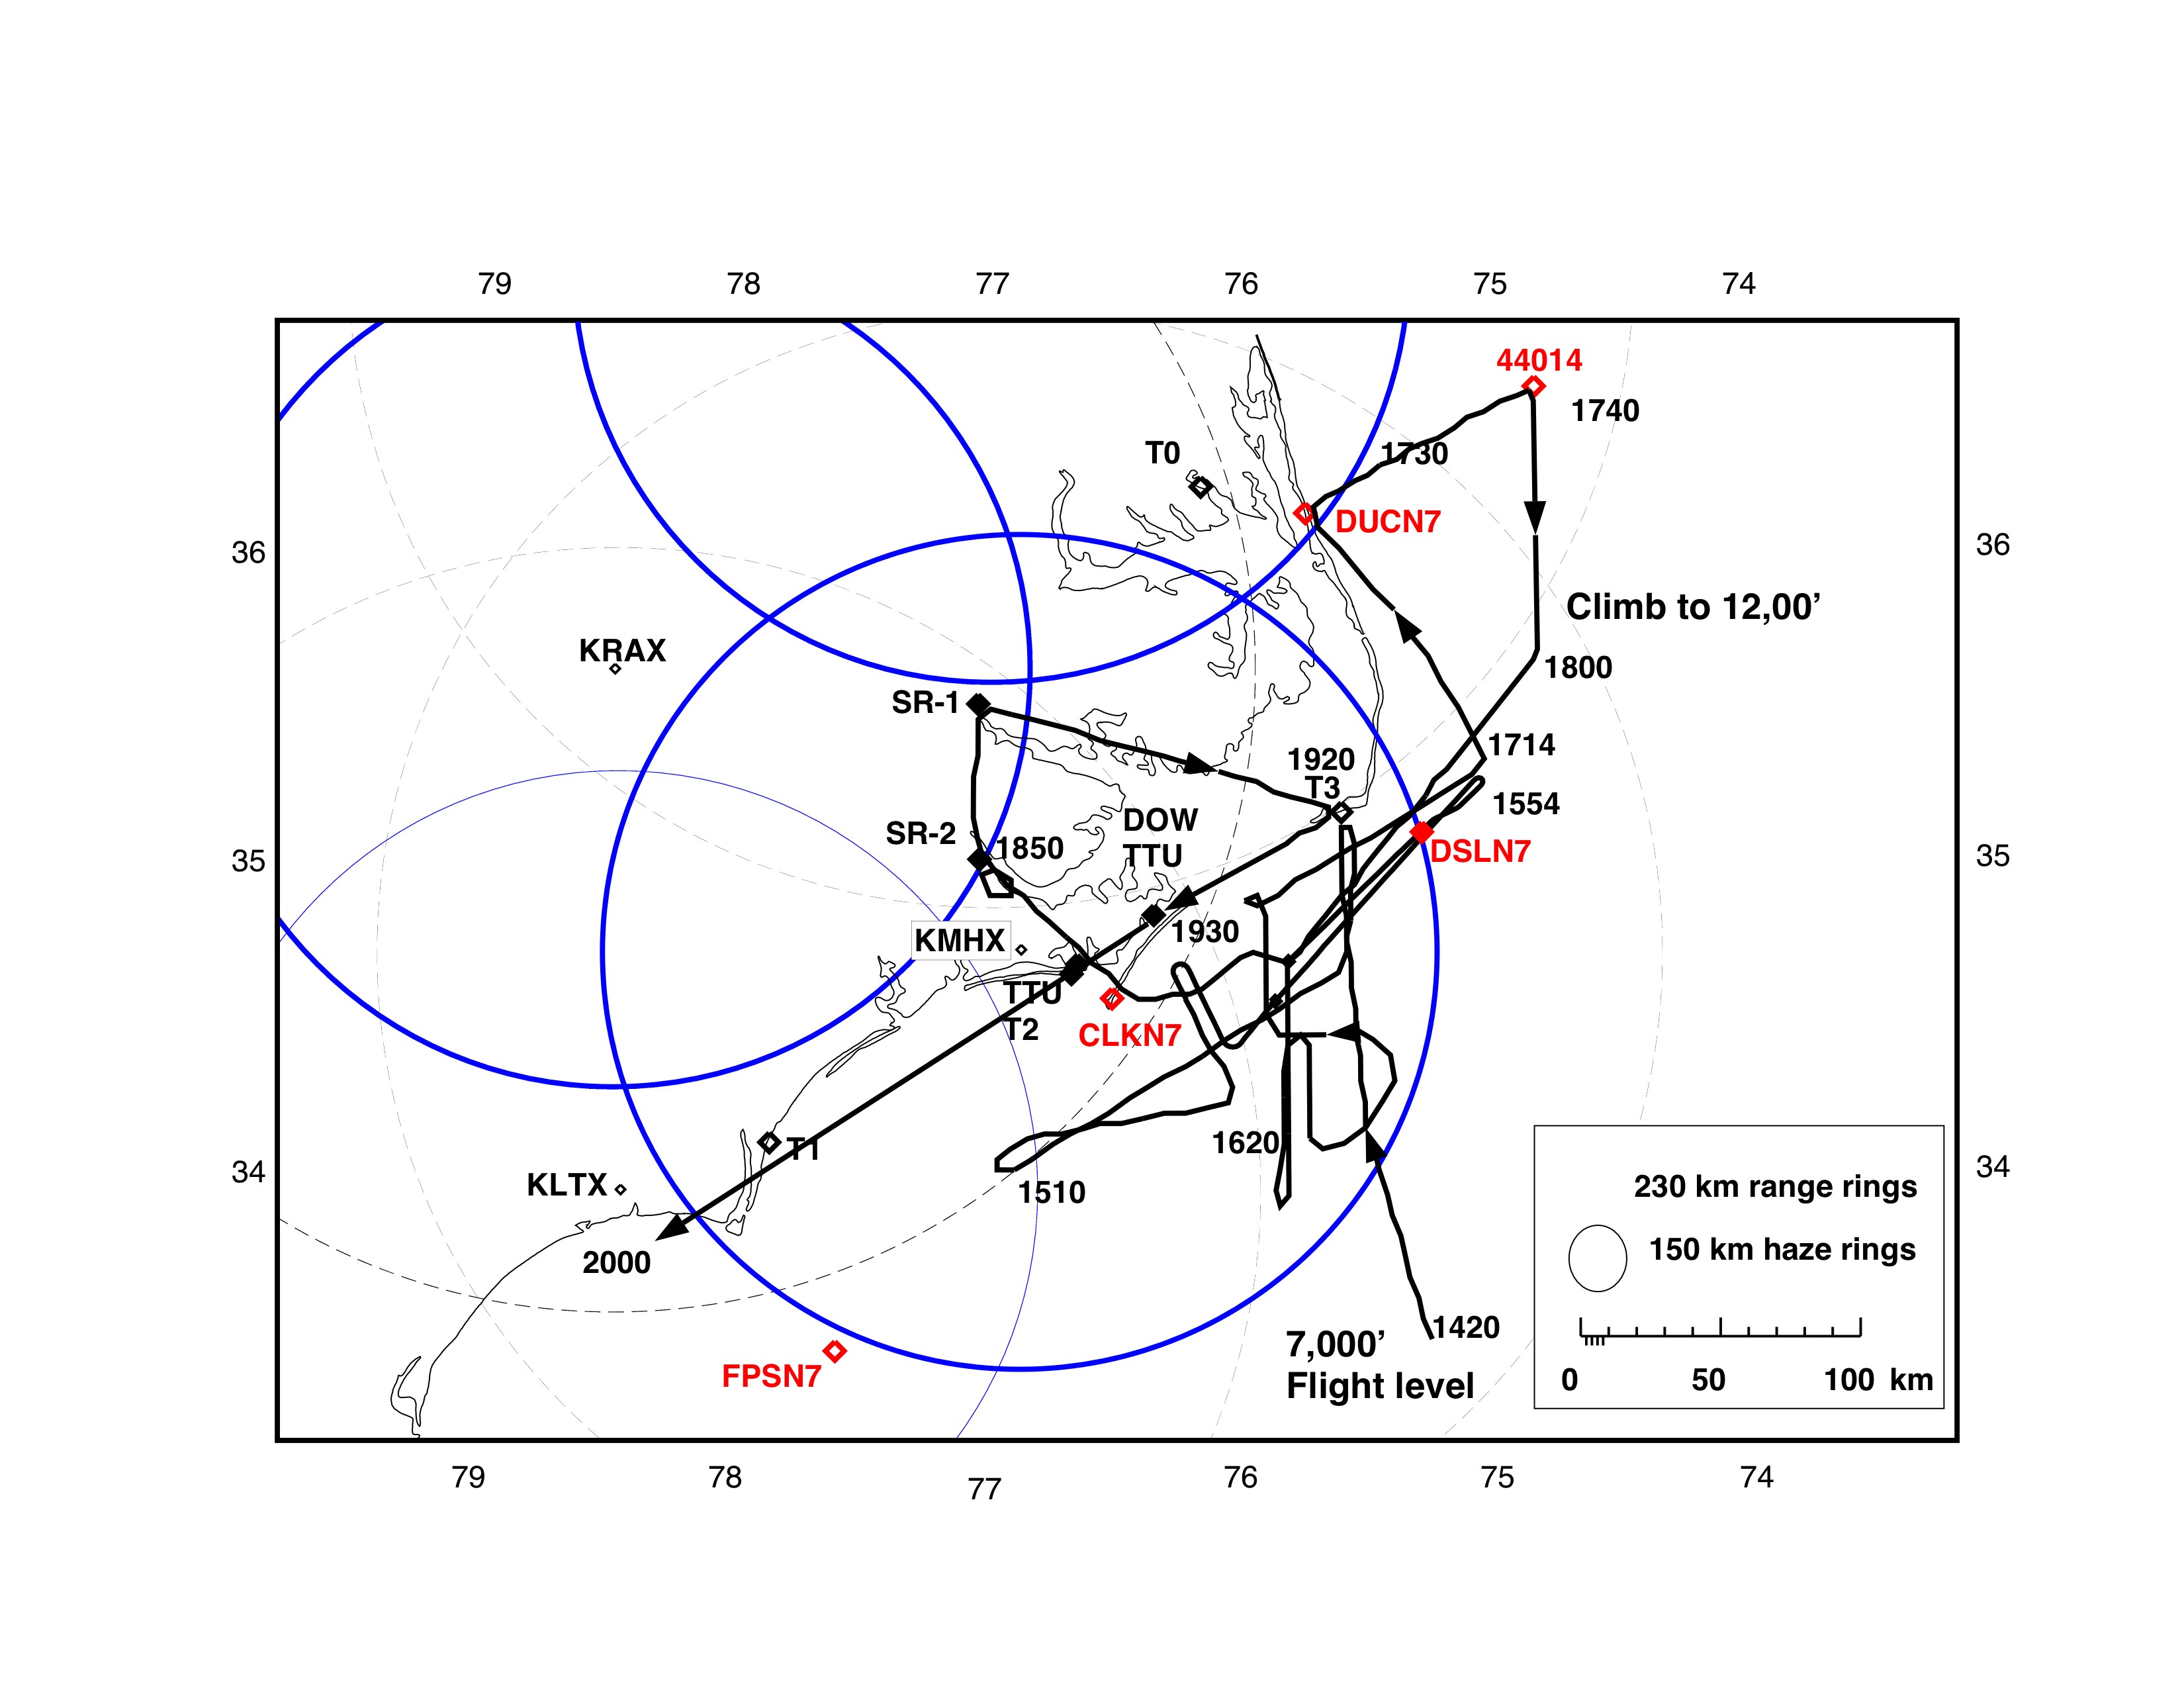
NOAA 42 left Tampa at 1202 UTC, 18 September 2003, and reached our IP at ~1350 UTC, near buoy 41002. Figure 2 shows the flight track and figure 3 shows the GPS sonde splash locations. The aircraft descended to 7,000 ft and remained at that altitude until the over land portion of the flight. The eyewall was already on the coast (Figure 4a) so the eyewall pattern was truncated. We then flew several short legs in and out of the eyewall to collect IWRAP and sonde data in the higher winds. During this time the remnants of the inner eyewall seemed to develop a crescent shaped region of convection, as if the inner eyewall was reforming.
Numerous sondes were deployed in near Diamond Shoals which should be compared with the data collected at the T3 CUUF tower on Cape Hatteras. At 1710 we made a run up the coast to DUCN7 to investigate the transition in the windfield as the wind moved on shore. In hindsight we should have planned our track to be more parallel to the surface wind but these sonde data should still be valuable to describe the changes in this region, especially when combined with the T0 tower data.
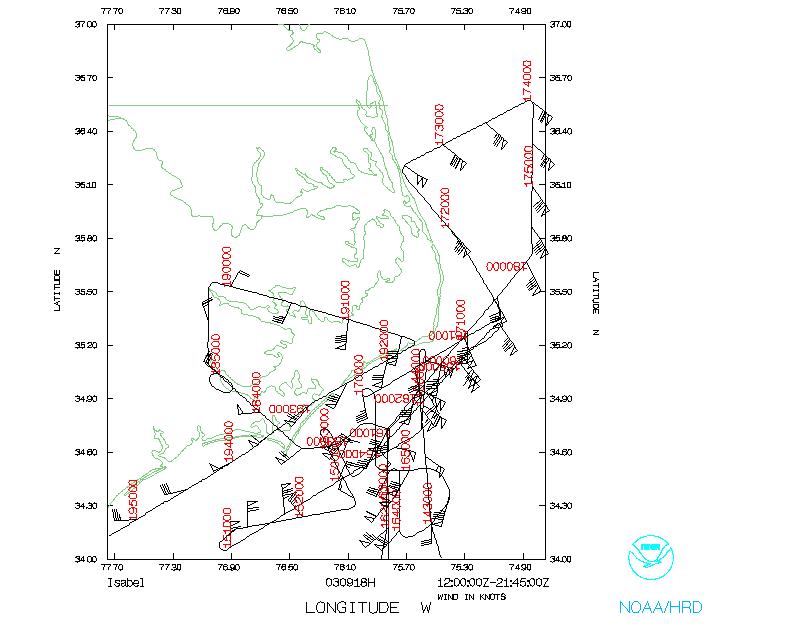
After turning to head South after dropping a GPS sonde at buoy 44014, at 1758 we climbed to 12,000 ft to begin an over land pattern. By this time the center of the storm was about equidistant from the two SMART-R radars. We flew an upwind pattern starting at CLKN7 then passing over the two SMART-R radars, then back to the coast to tower T3. During that eastern leg we passed right through the inner convective feature (Figure 4b). The research portion of the flight finished by passing near the DOWs and other TTU tower. We left the storm at 1937 and landed at MacDill at 2150 UTC.
Evaluation :
This hybrid mission went well. Most of the sondes worked and the radar functioned well. We had some confusion in the second part of the flight while planning the overland portion, but once everyone got on the same page things went well. In future landfall flights we must make sure that everyone has a list and map of all the surface stations so that communications go smoothly between LPS, Flight Director and the Flight Crew.
Acknowledgments :
Paul Flaherty, Tom Shepherd John Adler, and the flight crew flew a complicated pattern with their usual dedication and attention to detail. Sean McMillan kept the radar running, while Mark Rogers and Bobby Peek managed to keep up with our evolving plans for AXBT and GPS sonde drops.
Problems :
When the Lower Fuselage radar is operated in sector mode, to avoid interference with the IWRAP, the LF display and data archival are degraded significantly. The IWRAP should be modified to avoid this problem, as the LF is an important instrument during landfall flights.
Peter Dodge
Lead Scientist
Mission Data :
Flight Data | ||
Flight track |
Temperature and Moisture |
Wind and Altitude |
Flight track |
||
| Time | Lat | Lon | |
| 1333 | 34.000 | 75.420 | |
| 1359 | 34.120 | 75.520 | |
| 1435 | 34.280 | 75.630 | |
| 1501 | 34.380 | 75.700 | |
| 1532 | 34.530 | 75.900 | |
| 1602 | 34.630 | 76.000 | |
| 1633 | 34.750 | 76.150 | replaced 34.810 -75.950 |
| 1654 | 34.850 | 76.333 | USAF Recco |
| 1659 | 34.910 | 76.280 | |
| 1730 | 35.000 | 76.320 | |
| 1801 | 35.120 | 76.390 | |
| 1832 | 35.380 | 76.560 | |
| 1901 | 35.510 | 76.680 | |
| 1933 | 35.730 | 76.860 | |
| 1959 | 35.780 | 76.920 | |
| 2031 | 35.880 | 77.130 |
| Splash | |||||
| Drop # | Sonde ID | Time UTC | Lat | Lon | Comments |
| 1 | 024125007 | 1419 | 33.48 | 75.21 | EYEWALL 180 LST 010 DLM 24076 978766 MBL 24082 WL150 23576 085 |
| 2 | 024125010 | 1421 | 33.70 | 75.28 | WL150 23088 102 DLM 23590 970764 MBL 23591 LST 027 EYEWALL 180 |
| 3 | 023555110 | 1423 | 33.77 | 75.31 | DLM 23579 968760 EYEWALL 180 |
| 4 | 023555108 | 1439 | 34.91 | 75.61 | near coast, no winds |
| 5 | 024125005 | 1440 | 35.01 | 75.71 | WL150 07595 136 DLM 09603 967760 MBL 08097 LST 061 EYEWALL 000 |
| 6 | 023555011 | 1443 | 35.18 | 75.66 | WL150 08075 085 DLM 09596 976766 MBL 08591 EYEWALL 000 |
| 7 | 023555016 | 1446 | 35.06 | 75.66 | WL150 08089 112 DLM 09601 969760 MBL 08099 LST 037 EYEWALL 000 |
| 8 | 023555104 | 1504 | 34.22 | 76.47 | WL150 31074 085 DLM 34575 968763 MBL 32083 EYEWALL 270 |
| 9 | 023555012 | 1504 | 34.20 | 76.50 | WL150 31068 085 DLM 33578 970753 MBL 31574 EYEWALL 270 |
| 10 | 023555120 | 1507 | 34.12 | 76.66 | WL150 30075 108 DLM 33573 975762 MBL 30581 LST 033 EYEWALL 270 |
| 11 | 023555105 | 1518 | 34.17 | 76.49 | WL150 29570 085 DLM 32575 971763 MBL 30077 DLM 32575 971763 |
| 12 | 023555017 | 1531 | 34.69 | 76.31 | WL150 04044 085 DLM 05040 962755 MBL 05046 |
| 13 | 023555013 | 1548 | 35.08 | 75.50 | WL150 10087 085 DLM 12609 967757 MBL 11097 EYEWALL 045 |
| 14 | 023555112 | 1549 | 35.15 | 75.39 | WL150 10581 085 DLM 12601 973763 MBL 11095 EYEWALL 045 |
| 15 | 023555119 | 1606 | 34.90 | 75.63 | eyewall NE, not sent: GA problems |
| 16 | 024125207 | 1619 | 34.25 | 75.77 | WL150 23078 107 DLM 23576 967758 MBL 23584 LST 032 EYEWALL 180 |
| 17 | 024125212 | 1620 | 34.20 | 75.77 | WL150 23577 085 DLM 24078 970759 MBL 23587 EYEWALL 180 |
| 18 | 023555103 | 1628 | 34.24 | 75.79 | WL150 23079 096 DLM 24074 969762 MBL 23586 LST 021 EYEWALL 180 |
| 19 | 024125182 | 1636 | 34.36 | 75.70 | WL150 22082 086 DLM 22577 971758 MBL 22587 LST 011 EYEWALL 180 SST 278 |
| 20 | 024125204 | 1649 | 34.56 | 75.64 | WL150 20073 085 DLM 20582 968760 MBL 20579 EYEWALL 135 |
| 21 | 024125011 | 1706 | 35.18 | 75.62 | WL150 13587 197 DLM 15604 958758 MBL 14091 LST 122 EYEWALL 090 |
| 22 | 024125181 | 1707 | 35.22 | 75.55 | WL150 13083 085 DLM 15107 970759 MBL 14091 |
| 23 | 024125206 | 1725 | 36.25 | 75.77 | WL150 08567 085 DLM 11092 987772 MBL 09078 RAINBAND |
| 24 | 024125287 | 1729 | 36.35 | 75.53 | WL150 09068 085 DLM 10587 990895 MBL 10081 RAINBAND |
| 25 | 023555107 | 1734 | 36.47 | 75.24 | WL150 10061 085 DLM 11584 994779 MBL 10573 RAINBAND |
| 26 | 023555111 | 1739 | 36.60 | 74.94 | WL150 10561 085 DLM 12078 996778 MBL 11068 RAINBAND |
| 27 | 023555100 | 1835 | 34.67 | 76.36 | WL150 24063 085 DLM 24563 975644 MBL 25069 RAINBAND |
| 28 | 024125179 | 1849 | 34.99 | 76.88 | DLM 29049 952644 MBL 27565 LST 188 |
| 29 | 024125185 | 1911 | 35.32 | 76.23 | no winds |
| 30 | 024125209 | 1927 | 35.02 | 76.17 | WL150 21053 085 DLM 21069 978646 MBL 21560 |
| 31 | 024125227 | 1937 | 34.61 | 76.78 | no winds |
| Launch Time (UTC) | Lat | Lon | SST (°C) | |
| 1440 | 35.18 | 75.58 | 23 | Hit the mud |
| 1548 | 35.03 | 75.42 | 25 | |
| 1636 | 34.32 | 75.75 | 27.8 | |
| 1734 | 36.45 | 75.16 | 20.8??? |
| Latitude | Longitude | Instrument |
| 35.56667 | 77.05000 | SMART-R1 Washinton, NC |
| 35.06667 | 77.04167 | SMART-R2 New Bern, NC |
| 34.88833 | 76.35667 | DOWs, TTU Atlantic Airport |
| 34.69833 | 76.67917 | Clemson/UF T2 Atlantic Beach |
| 35.21667 | 75.61667 | Clemson T3 Cape Hatteras |
| 34.14916 | 77.85389 | Clemson T1 Wilmington |
| 36.26667 | 76.16667 | Clemson T0 Elizabeth City |
| 34.72927 | 76.65667 | TTU WEMITE at Morehead / Beaufort airport |